Tony Meier | Windermere Real Estate | 37 Years Experience | 788 Closed Eastside Sales
Audio Version here:
[audio mp3="https://eastsidehomes.com/wp-content/uploads/Seattles-Eastside-Real-Estate-Market-Update-4-15-26.mp3"][/audio]
Last week we cautioned that the spring-break-elevated MOI of 3.16 was not a reliable baseline, with several school districts still on break this week. That caution was well-placed. Here is what the data shows as spring break winds down.
If we can help you think through what this means for your move, we are here. Tony Meier & Team — Windermere Real Estate / NE, Kirkland, WA
📌 WHAT'S COVERED THIS WEEK
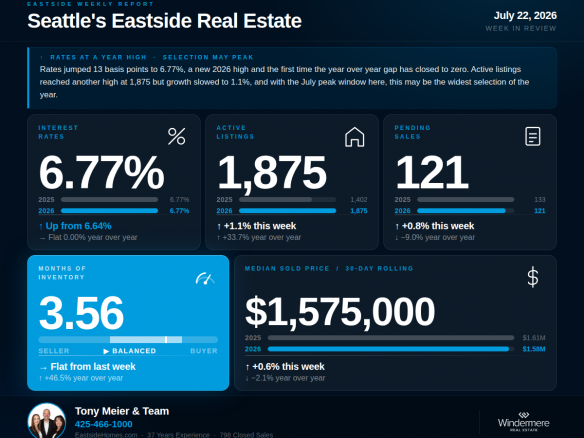
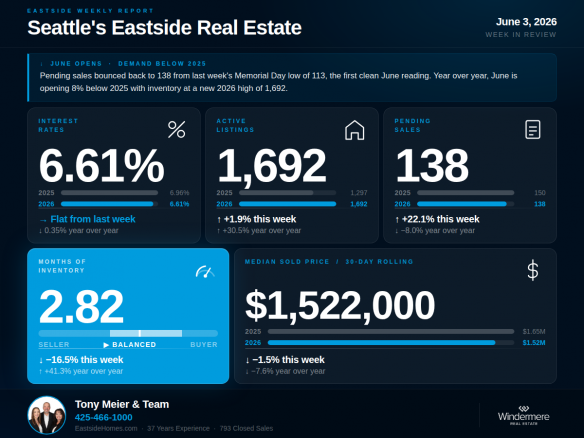
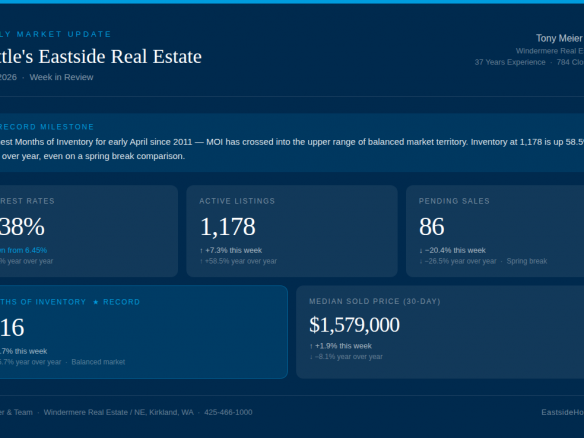
💰 INTEREST RATES — 6.32% | ↓ Down from last week's 6.38% | ↓ Down 0.56% year over year
Rates continued their gradual retreat this week, easing to 6.32% — down from 6.38% last week and down 0.56% compared to this same week one year ago. Rates have now recovered meaningfully from the peak spike of 0.65 points above pre-conflict levels and currently sit 0.33 points above where they were before the Iran conflict began. That partial recovery is a modest positive for buyer affordability, though rates remain elevated relative to late February.🏡 ACTIVE LISTINGS — 1,245 | ↑ Up 5.7% from last week | ↑ Up 52.4% year over year
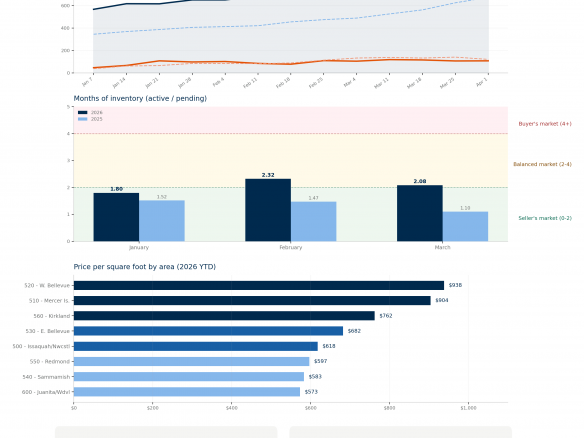
Active listings climbed again to 1,245 — another 2026 high and up 52.4% from the 817 homes available during the comparable week in 2025. Inventory is continuing its seasonal build, with some districts still on spring break this week adding to the supply-side pressure.📝 PENDING SALES — 128 | ↑ Up 48.8% from last week | ↑ Up 25.5% year over year
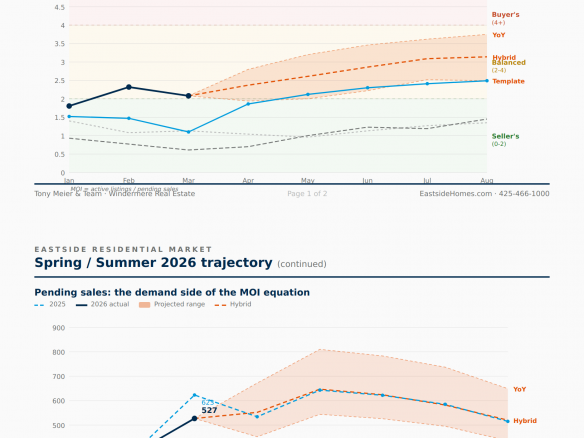
Pending sales bounced back sharply to 128 this week — up 48.8% from last week's spring-break-suppressed reading of 86, and up 25.5% compared to the same week in 2025, when 102 contracts were written. That rebound confirms what last week's data suggested: buyer demand did not disappear during spring break, it was deferred. Buyers are active and engaging with the market when they are available to do so.📦 MONTHS OF INVENTORY — 2.24 | ↓ Down 29.0% from last week's 3.16 | ↑ Up 21.4% year over year
MOI pulled back to 2.24 from last week's spring-break-elevated 3.16 — a significant weekly swing that confirms our caution against treating 3.16 as a new baseline. At 2.24, MOI remains solidly in balanced market territory, defined locally as 2 to 4 months, and sits 21.4% above the 1.85 recorded during the comparable week in 2025. The underlying trend is unchanged — this market is more balanced than it has been at this time of year since 2011.🏠 MEDIAN SOLD PRICE (Rolling 30-Day) — $1,537,944 | ↓ Down 2.6% from last week | ↓ Down 10.0% year over year
The 30-day median eased to $1,537,944 — now 10% below the $1,710,000 recorded at this same point in 2025. The weekly closed median of $1,470,000 reflects a still-thin sales sample as spring break winds down and should be interpreted with caution. The 30-day figure, which smooths weekly volatility, is the more reliable price indicator and it is pointing clearly below year-ago levels.🔍 THE BIG PICTURE — WHAT THIS ALL MEANS
The key data point this week is the pending rebound to 128 — up 25.5% year over year on a comparable-week basis. Buyers are active and have not stepped away from this market. What has changed is the environment they are buying into: more inventory, more choices, and more negotiating room than at any comparable spring period since 2011. Inventory at 1,245 continues to set 2026 highs, and the 30-day median running 10% below last year signals that pricing discipline remains essential for sellers. The market is functioning — but it is rewarding accuracy and preparation, not optimism.🏠 FOR SELLERS
With 52.4% more competition on the market than a year ago, pricing discipline is the single most important decision you will make. Homes priced accurately against today's comparable sales — not 2025 peaks, and not even the partial recovery readings from January and February 2026 — are still selling well, while overpriced listings are sitting longer and often requiring reductions that erode both value and negotiating position. We have done extensive analysis on exactly what this market shift means for sellers in each Eastside sub-market — if you are considering a move, we would welcome the opportunity to walk you through what the data shows for your specific area and home.🔑 FOR BUYERS
Buyers today have more negotiating leverage for this time of year — spring — than at any point since 2011. This week's pending rebound confirms that well-priced homes are still attracting offers. More choices, more time to conduct proper due diligence, and more room for thoughtful negotiation than buyers have experienced in years — but arriving pre-approved and prepared remains essential in a market where accurately priced homes are still moving.If we can help you think through what this means for your move, we are here. Tony Meier & Team — Windermere Real Estate / NE, Kirkland, WA