Northwest MLS brokers encouraged by declining mortgage rates with some saying pent-up demand is triggering multiple offers
Northwest MLS brokers encouraged by declining mortgage rates with some saying pent-up demand is triggering multiple offers
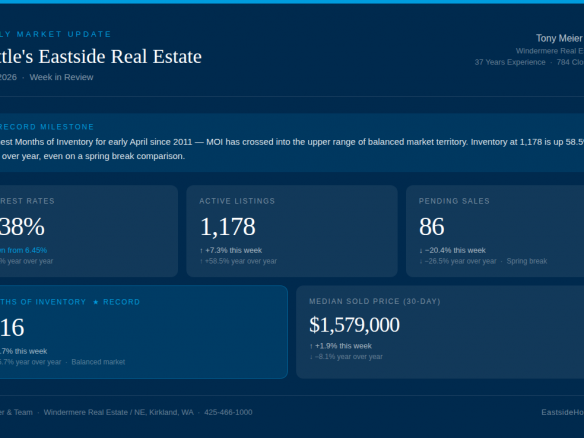
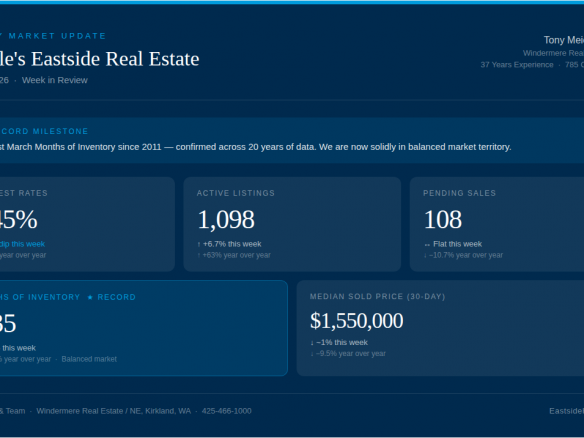
Tony Meier & Team. 37 years. 789 closed sales. $239M+ in closed volume since 2020.
Pending sales around Washington state reached the highest level since October and surged nearly 44% from December, according to the January report from Northwest Multiple Listing Service. Last month’s 5,776 mutually accepted offers were down about 9% from a year ago, but brokers seemed encouraged by the “favorable spike.”
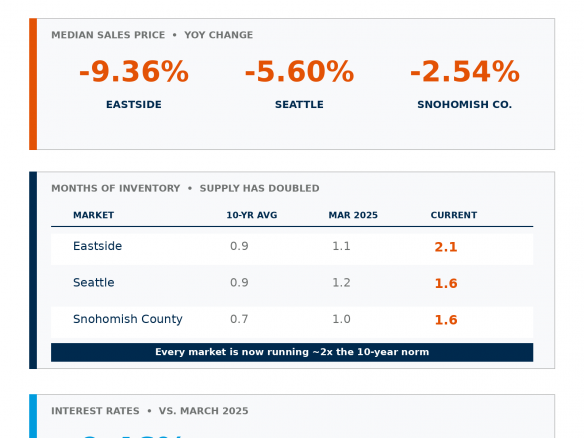
Prices on last month’s closed sales edged up slightly, at 0.41%, compared with twelve months ago. The area-wide median price on January’s 3,264 completed transactions $557,250; a year ago, when there were 5,085 closed sales, it was $555,000. Nine of the 26 counties in the report had year-over-year price bumps.
“We are seeing multiple offers once again,” stated John Deely, VP of operations at Coldwell Banker Bain. “It’s not like it was at the peak of the market, but buyers are out there and competing for properties,” he added.
The selection of properties, based on the number of total active listings in the MLS database, improved significantly from a year ago, rising from 3,092 listings to 8,220 at month end. That total, which includes 7,179 single family homes and 1,041 condominiums, was down about 13.2% from December’s selection.
Brokers added 4,925 new listings to the MLS database in January, about 1,000 fewer than the same month a year ago. Last month’s additions outgained December when 2,980 properties were added, as well as November, when 4,890 listings were added.
“While residential inventory is popping above six months in a few of our reporting counties, which is at the upper edge of a balanced market, our most populated counties – King, Pierce and Snohomish – are still sitting at one to two months of inventory, which is indicative of a seller’s market,” Deely commented.
The January report from Northwest MLS shows Adams, Columbia, Grays Harbor, Okanogan and San Juan counties each had more than six months of inventory. Ten counties had less than three months of supply.
“We saw a favorable spike of intensity in the market in January,” reported L. Lennox Scott, chairman and CEO of John L. Scott Real Estate. “With fewer new resale homes coming onto the market, there’s a shortage/low level of unsold inventory, especially in the more affordable and mid-price ranges where approximately 80% of sales activity takes place.”
Broker Dean Rebhuhn, owner of Village Homes and Properties, believes “the spring real estate market is here early. A combination of pent-up buyer demand, attractive prices and low inventory in King, Pierce and Snohomish counties are driving sales.” He pointed to “reasonable interest rates” and new properties coming on the market daily as factors for the creation of what he called the “new normal market.”
On Thursday, Freddie Mac (the Federal Home Loan Mortgage Home Loan Mortgage Corporation) reported the U.S. weekly average for a 30-year fixed-rate mortgage was 6.09%, down about a full point from November when it peaked at just over 7%. According to its research, this one percentage point rate reduction can allow as many as three million more mortgage-ready consumers to qualify and afford a $400,000 loan, the median home price in the U.S.
George Ratiu, manager of economic research at Realtor.com, said the recent decline in rates means for today’s buyer of a median priced home, the down payment amount is lower than it would have been last summer.
“While interest rates have tempered a bit, many buyers are moving forward to purchase with an intent to refinance once rates come down more,” stated Frank Wilson, Kitsap regional manager and branch managing broker at John L. Scott’s North Kitsap office.
Last month’s median price for homes that sold in Kitsap County was $487,000, well below the median price in both King County ($723,000) and Snohomish County ($645,000). Prices in Kitsap are down from both a year ago and December, but inventory is tight with slightly more than two months of supply.
Wilson described the market in Kitsap as “similar to a well-planted bed of tulips. You know it is there but will not see any real color until March or April.” He believes many sellers are waiting until later in the year to sell, but noted buyers who must buy are currently out in numbers. “We are seeing good traffic at our open houses and new, correctly priced listings are receiving multiple offers.”
NAR Chief Economist Lawrence Yun suggested the “recent low point in home sales activity is likely over.” Commenting on pending sales for December, he stated, “Mortgage rates are the dominant factor driving home sales, and recent declines in rates are clearly helping to stabilize the market.”
Although brokers and buyers welcome the declining rates and improving inventory, several obstacles still face first-time home buyers. Based on his observations, Rebhuhn said the biggest challenge for first timers involves assembling the down payment. “Buyers are using savings, gifts and loans from family, and borrowing from investment and retirement accounts,” according to Rebhuhn.
Deely also noted challenges exist in the condo market.
“The condo market in our most populated counties is quite a bit different and not recovering as quickly,” Deely said, adding, “However, it is still active and the sales that are taking place are keeping the condo market in balance.”
Northwest MLS statistics for January show there were 757 pending sales of condos, about 24% fewer than the same month a year ago. Last month’s volume was the highest since October when brokers reported 823 pending sales.
Condo prices system-wide were down about 2.5% from a year ago, declining from $435,000 to $424,000. Only four counties (Kitsap, Pacific, Skagit and Thurston) reported year-over-year price increases for last month’s condo sales.
Yun believes the “new normal” for mortgage rates will likely be in the 5.5% to 6.5% range, adding, “Job gains will steadily become important in driving local home-sales markets.”
Last week, the U.S. Labor Department defied expectations by reporting the addition of 517,000 jobs on a seasonally adjusted basis, the largest increase since July. The unemployment rate fell to 3.4%, the lowest level since 1968.
Washington’s Employment Security Department reported a statewide unemployment rate of 4.2% for December. (January figures are not yet published.) In that report, the U.S. unemployment rate was 3.5%. ESD’s county snapshot shows unemployment rates range from 2.8% in King County to 11% in Ferry County.
About Northwest Multiple Listing Service
As the leading resource for the region’s residential real estate industry, NWMLS provides valuable products and services, superior member support, and the most trusted, current listing data and industry information for real estate professionals. NWMLS is a member-owned, not-for-profit organization with more than 2,500 member offices and 32,000 real estate brokers throughout Washington state. With extensive knowledge of the region, NWMLS operates 20 service centers and serves 26 counties, providing dedicated support to its members and fostering a robust, cooperative brokerage environment. nwmls.com.
Single Fam. Homes + Condos
New Listings
Total
Active
Listings
# PendingSales
# Closed
Sales
Avg.
Closed
Price
Median
Closed
Price
This mo. Inventory
Same mo., yr ago
King
1,753
2,262
1,820
1,003
$891,282
$723,000
2.26
0.49
Snohomish
719
875
886
513
$725,988
$645,000
1.71
0.33
Pierce
784
1,210
1,082
568
$560,661
$509,997
2.13
0.47
Kitsap
270
424
323
197
$571,833
$487,000
2.15
0.58
Mason
69
151
91
53
$376,519
$360,000
2.85
0.75
Skagit
104
204
124
73
$503,862
$480,000
2.79
0.88
Grays Harbor
95
298
96
48
$347,966
$304,002
6.21
1.62
Lewis
67
183
109
58
$412,159
$390,000
3.16
1.02
Cowlitz
77
173
110
53
$392,143
$362,500
3.26
0.71
Grant
81
199
51
45
$321,662
$312,390
4.42
1.51
Thurston
246
390
330
171
$497,483
$474,500
2.28
0.38
San Juan
9
70
13
11
$2,202,032
$810,000
6.36
2.10
Island
94
173
123
68
$497,081
$449,000
2.54
0.46
Kittitas
48
148
48
25
$610,396
$399,988
5.92
0.68
Jefferson
26
76
17
16
$517,448
$497,500
4.75
1.29
Okanogan
20
110
27
18
$479,339
$330,000
6.11
2.16
Whatcom
190
420
193
124
$630,744
$560,000
3.39
0.77
Clark
42
94
56
42
$562,058
$532,500
2.24
0.57
Pacific
28
106
28
28
$344,779
$330,000
3.79
1.43
Ferry
1
16
2
3
$219,667
$229,000
5.33
5.75
Clallam
50
123
59
43
$402,146
$379,000
2.86
0.94
Chelan
39
157
39
30
$571,027
$517,450
5.23
1.60
Douglas
23
64
32
19
$518,716
$460,000
3.37
1.33
Adams
8
46
9
7
$309,060
$275,000
6.57
2.33
Walla Walla
33
89
49
18
$371,944
$331,000
4.94
1.07
Columbia
6
23
8
3
$253,333
$265,000
7.67
2.67
Others
43
136
51
27
$415,716
$349,990
5.04
1.57
Total
4,925
8,220
5,776
3,264
$668,692
$557,250
2.52
0.61
4-county Puget Sound Region Pending Sales (SFH + Condo combined)
(totals include King, Snohomish, Pierce & Kitsap counties)
Jan
Feb
Mar
Apr
May
Jun
Jul
Aug
Sep
Oct
Nov
Dec
2004
4521
6284
8073
7910
7888
8186
7583
7464
6984
6761
6228
5195
2005
5426
6833
8801
8420
8610
8896
8207
8784
7561
7157
6188
4837
2006
5275
6032
8174
7651
8411
8094
7121
7692
6216
6403
5292
4346
2007
4869
6239
7192
6974
7311
6876
6371
5580
4153
4447
3896
2975
2008
3291
4167
4520
4624
4526
4765
4580
4584
4445
3346
2841
2432
2009
3250
3407
4262
5372
5498
5963
5551
5764
5825
5702
3829
3440
2010
4381
5211
6821
7368
4058
4239
4306
4520
4350
4376
3938
3474
2011
4272
4767
6049
5732
5963
5868
5657
5944
5299
5384
4814
4197
2012
4921
6069
7386
7015
7295
6733
6489
6341
5871
6453
5188
4181
2013
5548
6095
7400
7462
7743
7374
7264
6916
5951
6222
5083
3957
2014
5406
5587
7099
7325
8055
7546
7169
6959
6661
6469
5220
4410
2015
5791
6541
8648
8671
8620
8608
8248
7792
7179
6977
5703
4475
2016
5420
6703
8130
8332
9153
8869
8545
8628
7729
7487
6115
4727
2017
5710
6024
7592
7621
9188
9042
8514
8637
7441
7740
6094
4460
2018
5484
5725
7373
7565
8742
8052
7612
6893
6235
6367
5328
4037
2019
5472
4910
7588
8090
8597
8231
7773
7345
6896
6797
5788
4183
2020
5352
6078
6477
5066
7297
8335
8817
9179
8606
7934
6122
4851
2021
5216
5600
8002
7716
8674
8824
8049
8586
7880
7405
6022
3943
2022
4405
5560
7312
6908
7482
6031
5934
6581
5208
4410
3521
2778
2023
4111
Thinking about a move on the Eastside?
Tony Meier & Team has closed 789 residential transactions with $239M+ in volume since 2020. Whether you are six months out or just curious about your home’s value, we would be glad to help you think it through.