Tony Meier & Team's Weekly Market Update
4 Min. Read
Audio version:
[audio mp3="https://eastsidehomes.com/wp-content/uploads/Eastside-Weely-Market-Update-4-29-26.mp3"][/audio]
If we can help you think through what this means for your move, we are here. Tony Meier & Team — Windermere Real Estate / NE, Kirkland, WA
🏡 April Listings Cross a 14-Year High — and the Demand Gap Tells the Real Story | Seattle's Eastside Real Estate Update 04-29-26
Tony Meier | Windermere Real Estate | 37 Years Experience | 789 Closed Eastside Sales Two milestones arrived together this week that place the current Eastside market in a context we have not seen since 2012. At 1,402 active listings, April 2026 has now surpassed the previous modern-era April high of 1,285 set in 2019. To find a higher April listing count, you have to go back to April 2012 at 1,729.📌 WHAT'S COVERED THIS WEEK
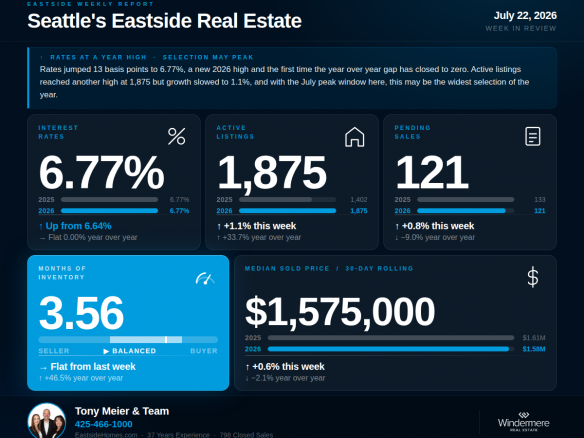
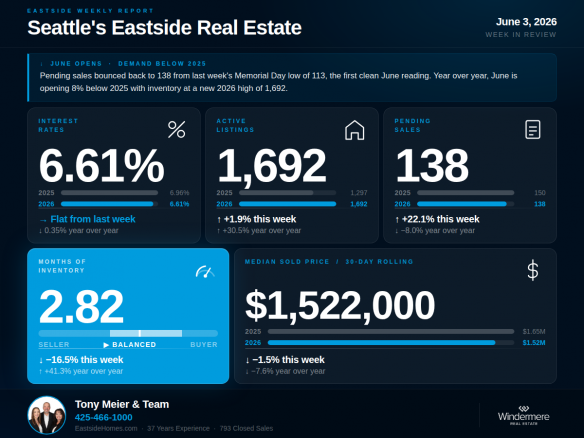
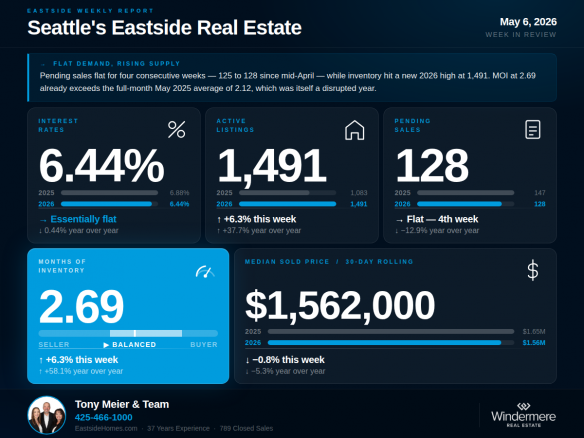
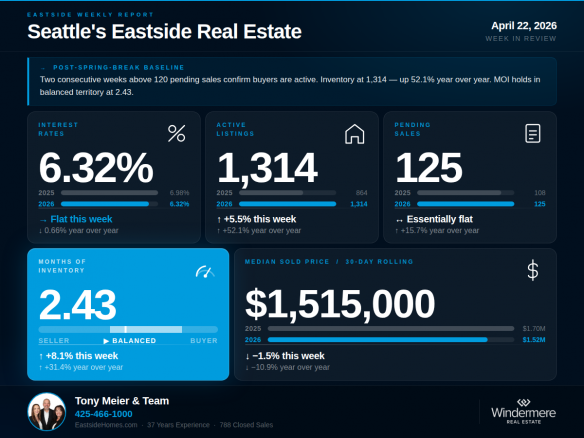
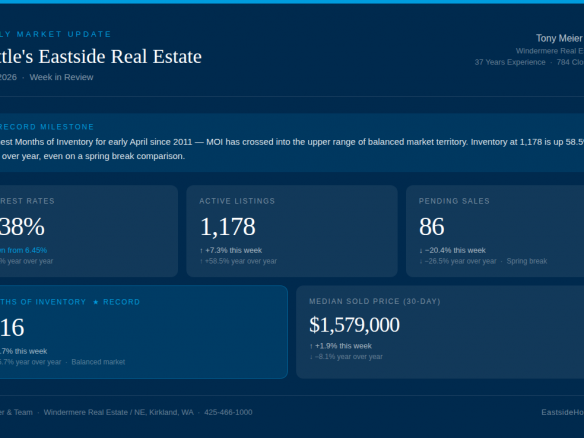
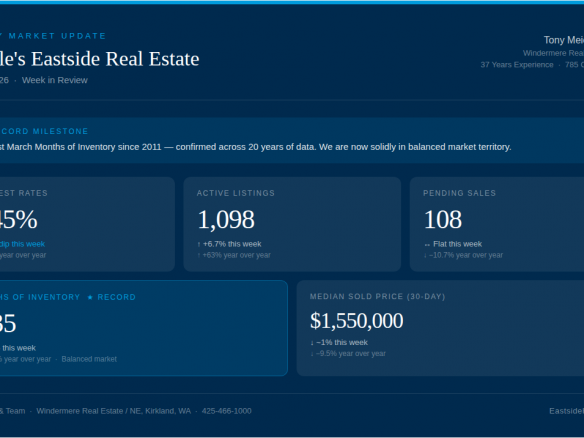
💰 INTEREST RATES — 6.45% | ↑ Up from last week's 6.32% | ↓ Down 0.36% year over year
Rates reversed course this week, climbing back to 6.45% from last week's 6.32% — a 13-basis-point move in a single week that returns rates to within range of the March peak. Rates now sit 0.46 points above the pre-conflict baseline of 5.99%, erasing much of the partial recovery that had built over the prior three weeks. Year over year, rates remain down 0.36% — but the near-term direction is the signal buyers are responding to.🏡 ACTIVE LISTINGS — 1,402 | ↑ Up 6.7% from last week | ↑ Up 43.8% year over year
Active listings reached 1,402 this week — surpassing the 2019 April high of 1,285 and setting a level not seen in any April since 2012. March's weekly data had stayed just below the 2019 benchmark. That changed this week. For context: when April listings last reached comparable levels in 2012, there were 917 pending sales absorbing them, producing a MOI of 1.89. Today, with similar supply, the demand picture is fundamentally different.📝 PENDING SALES — 128 | → Essentially flat from last week | ↓ Down 13.5% year over year
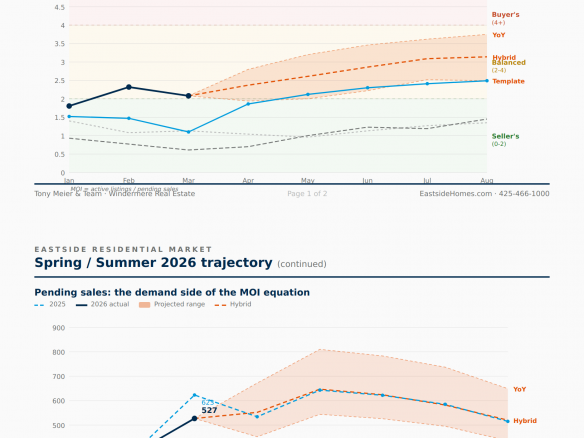
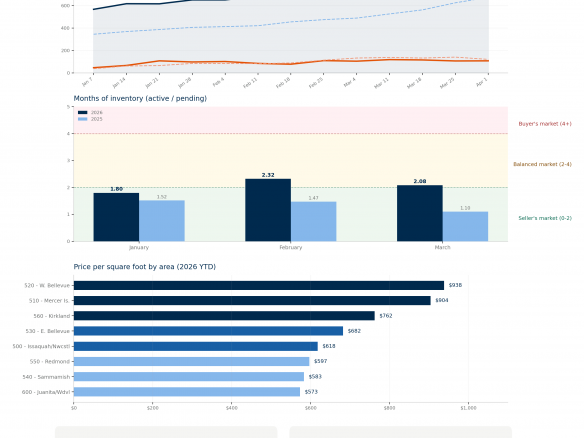
Pending sales came in at 128 — essentially flat from last week's 125 and down 13.5% from the 148 recorded during the comparable week in 2025. Demand has not evaporated, but the gap between supply growth and buyer absorption continues to widen. Estimated monthly pending of roughly 512 against 1,402 active listings produces an absorption ratio of approximately 37% — compared to 77% when April listings were last at comparable levels in 2019.📦 MONTHS OF INVENTORY — 2.53 | ↑ Up 4.1% from last week's 2.43 | ↑ Up 66.3% year over year
MOI reached 2.53 this week — the highest April reading in this dataset since 2011. The monthly data confirms March 2026 closed at 2.08, already the highest March since 2011. April is now tracking materially above that. In each of the three prior years where MOI crossed 2.0 — 2018, 2022, and 2025 — it continued climbing through summer before peaking in fall or winter. In 2026, we have crossed that threshold two to three months earlier than in any of those prior cycles, entering the seasonal inventory build from a significantly more elevated base.🏠 MEDIAN SOLD PRICE (Rolling 30-Day) — $1,575,000 | ↑ Up 3.96% from last week | ↓ Down 7.9% year over year
The 30-day median recovered modestly to $1,575,000 — still 7.9% below the $1,700,000 recorded at this same point in 2025. The weekly closed median of $1,727,500 reflects a thin transaction sample and should not be read as a standalone trend indicator.🔍 THE BIG PICTURE — WHAT THIS ALL MEANS
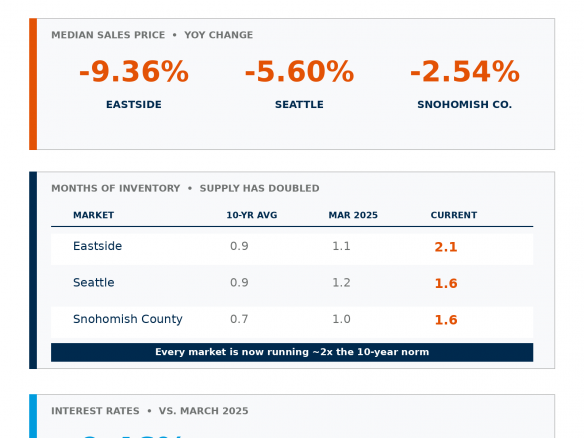
Two things are now confirmed by the data. First, April 2026 active listings have crossed above the 2019 April high — the first time any April has reached this level since 2012. Second, the demand side that absorbed comparable inventory levels in 2012 and 2019 no longer exists at that scale. In 2012, 917 monthly pending sales met 1,729 listings. In 2019, 997 buyers met 1,285 listings. Today, an estimated 512 monthly pending sales are meeting 1,402 listings. The supply milestone matters — but the demand gap is the more consequential number. MOI at 2.53 and climbing into the seasonal build season is the clearest expression of that gap.🏠 FOR SELLERS
With more active listings this April than at any point since 2012, pricing discipline is the single most important decision you will make. Homes priced accurately against today's comparable sales — not 2025 peaks, not January or February 2026 — are still selling, while overpriced listings are sitting longer and requiring reductions that erode both value and negotiating position. We have done extensive analysis on what this shift means for sellers across each Eastside sub-market and would welcome the opportunity to walk you through what the data shows for your specific area and home.🔑 FOR BUYERS
Buyers today are operating in the most supply-rich April market since 2012 — with significantly more negotiating leverage than that prior inventory cycle produced, because demand is thinner relative to supply. More choices, more time for due diligence, and more room for thoughtful negotiation than any spring in the past decade. Well-priced homes are still moving, so arriving pre-approved and prepared remains essential — and with rates moving back up this week, stress-testing your qualification at current levels before making a move is a sound step.If we can help you think through what this means for your move, we are here. Tony Meier & Team — Windermere Real Estate / NE, Kirkland, WA