Tony Meier & Team's Weekly Market Update
5 Min. Read
Audio version
[audio mp3="https://eastsidehomes.com/wp-content/uploads/Eastside-Real-Estate-Market-Update-5-20-26.mp3"][/audio]
If we can help you think through what this means for your move, we are here. Tony Meier & Team — Windermere Real Estate / NE, Kirkland, WA
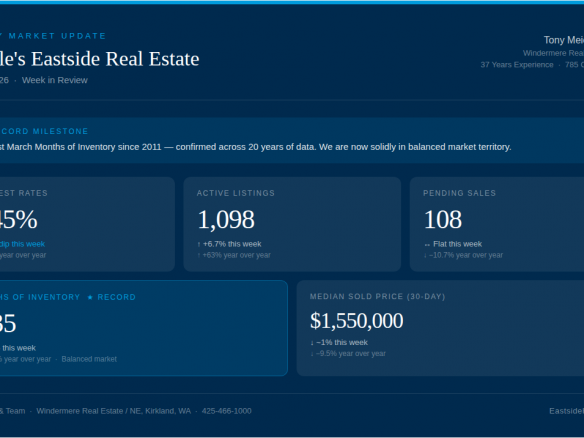
🏡 A New Rate High, a Pending Rebound, and a Market Still Searching for Direction | Seattle's Eastside Real Estate Update 05-20-26
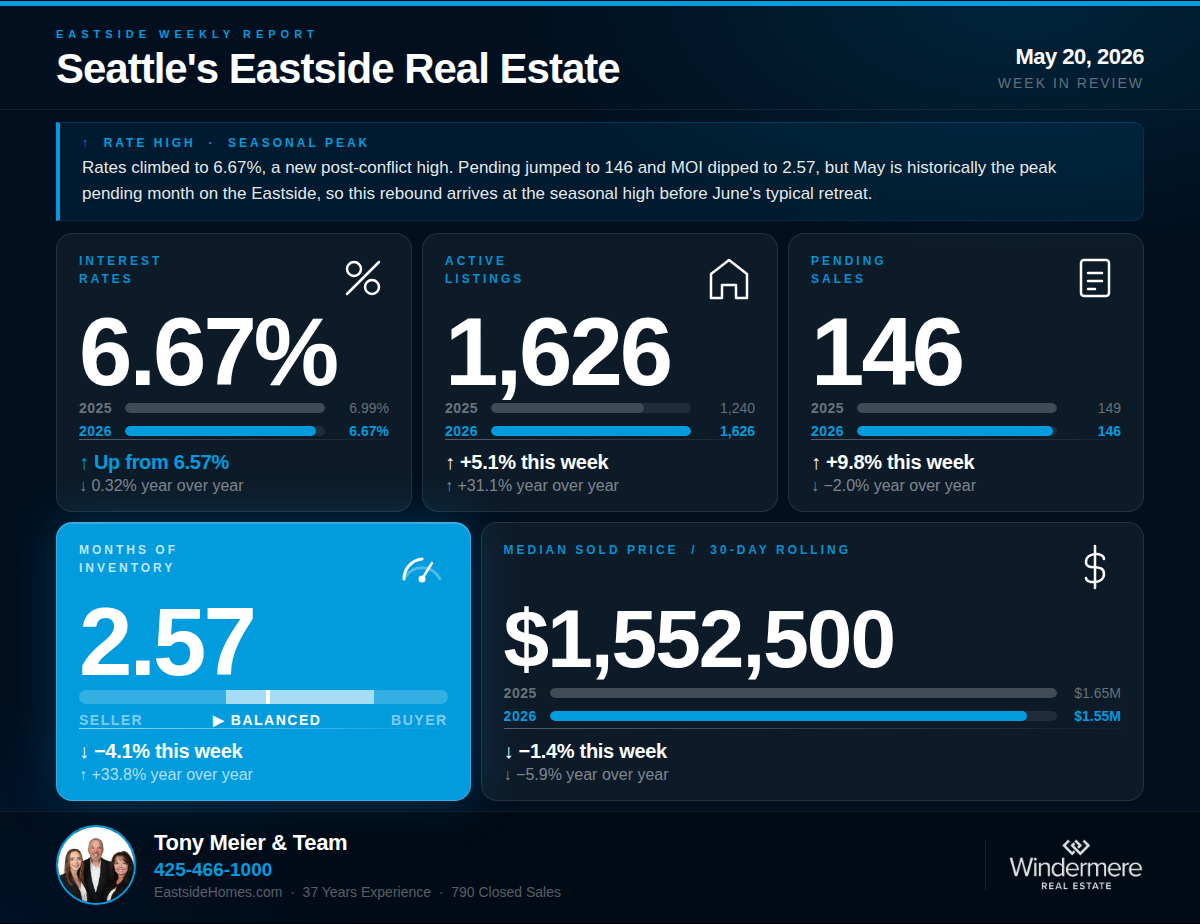
Tony Meier | Windermere Real Estate | 37 Years Experience | 789 Closed Eastside Sales Two signals this week cut in opposite directions and deserve careful reading. Rates climbed to 6.67% — a new post-conflict high that surpasses even the 6.62% reached intra-week in late March. At the same time, pending sales jumped to 146 and Months of Inventory declined for the second consecutive week. Before reading too much into the pending rebound, context matters: May is historically the peak pending month on the Eastside, confirmed in 14 of the last 20 years. A jump in the final week of May is consistent with seasonal peak activity — not a signal of strengthening demand. From June onward, buyer activity historically declines. The market is sending mixed signals, and the data warrants an honest read of both.📌 WHAT'S COVERED THIS WEEK
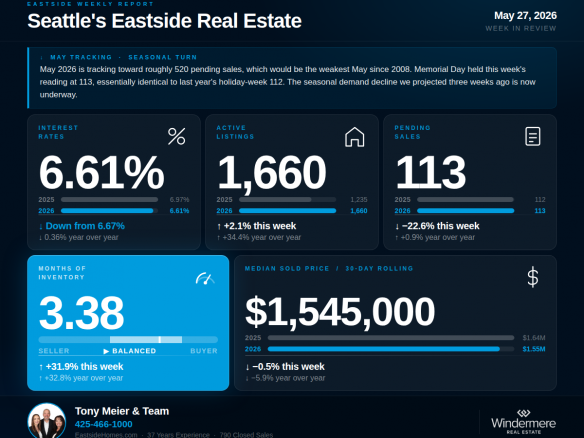
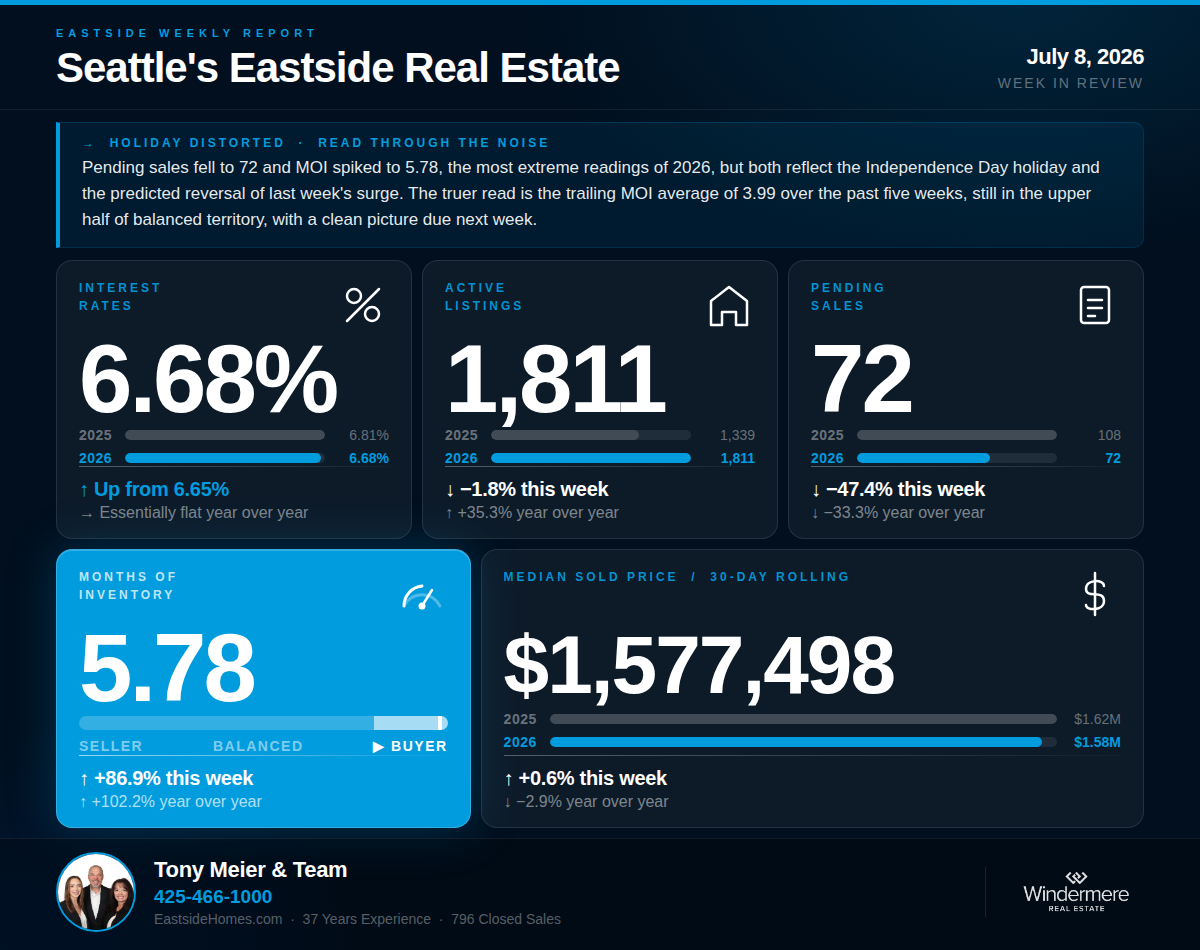
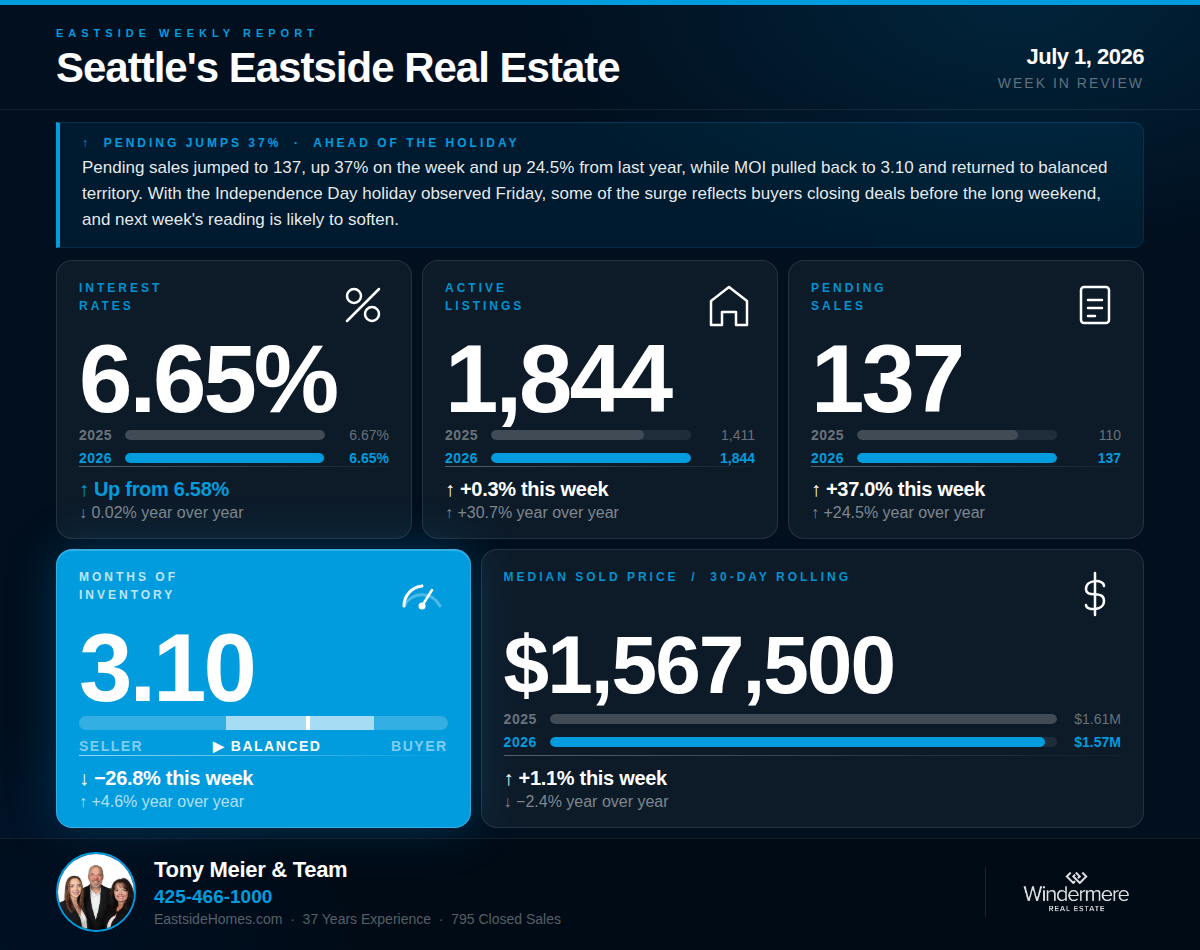
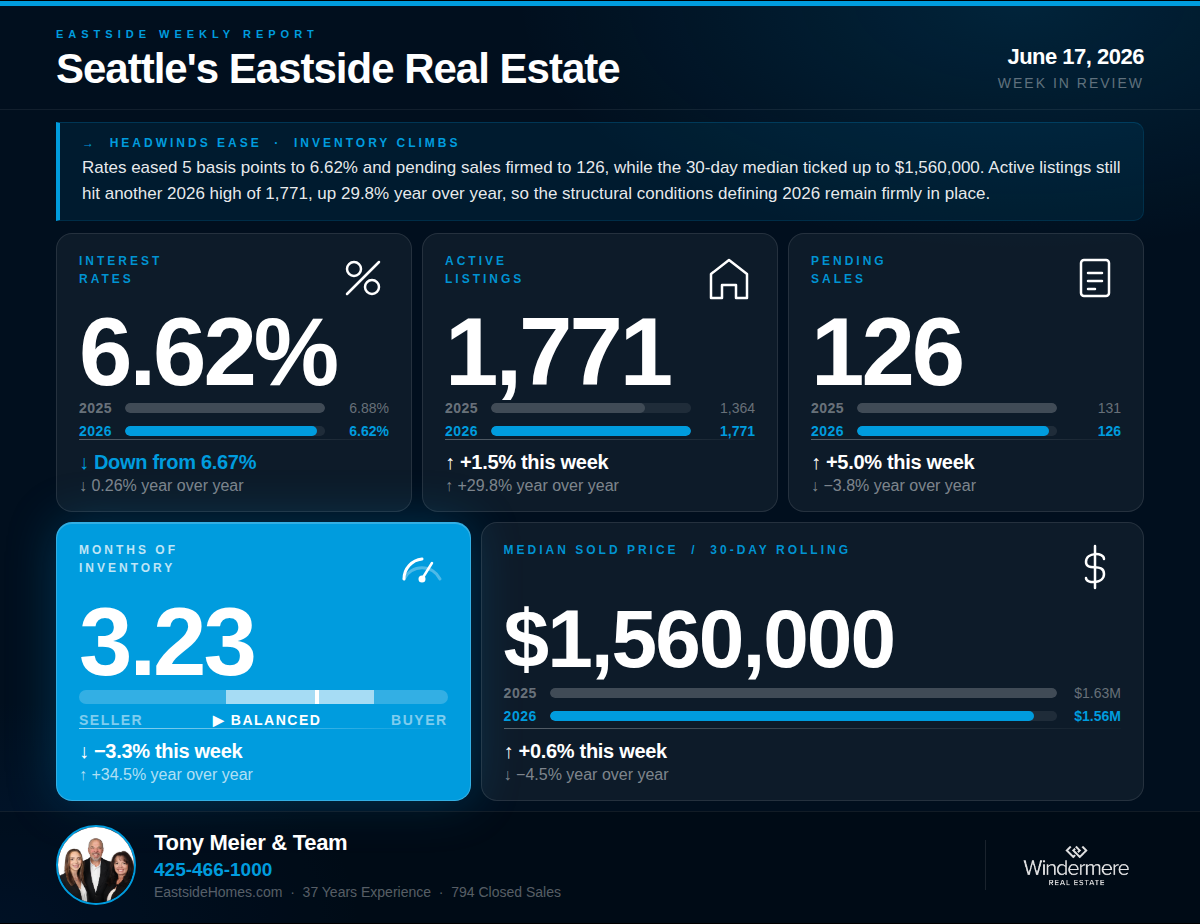
💰 INTEREST RATES — 6.67% | ↑ Up from last week's 6.57% | ↓ Down 0.32% year over year
Rates reached 6.67% this week — up 10 basis points from last week and now the highest reading since the Iran conflict began, surpassing the previous intra-week high of 6.62% reached in late March. The pre-conflict baseline of 5.99% is now 0.68 points below where rates sit today. Year over year, rates remain down 0.32%, but the near-term move is the operative signal. On a $1.5M home, this week's rate represents roughly $650 more per month in carrying costs than buyers faced in late February.🏡 ACTIVE LISTINGS — 1,626 | ↑ Up 5.1% from last week | ↑ Up 31.1% year over year
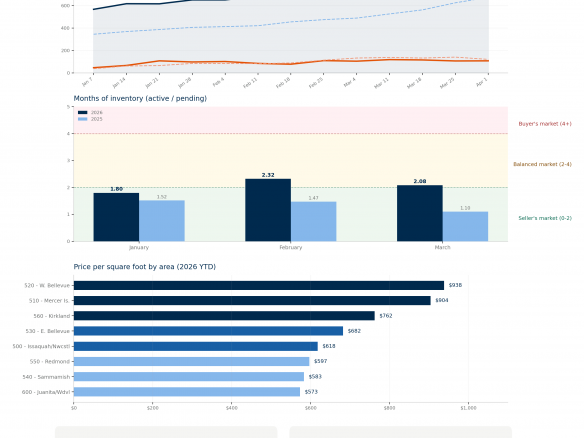
Active listings reached 1,626 this week — another 2026 high and up 31.1% from the 1,240 homes on the market during the comparable week in 2025. The inventory build continues at a steady pace with no sign of plateauing.📝 PENDING SALES — 146 | ↑ Up 9.8% from last week | ↓ Down 2.0% year over year
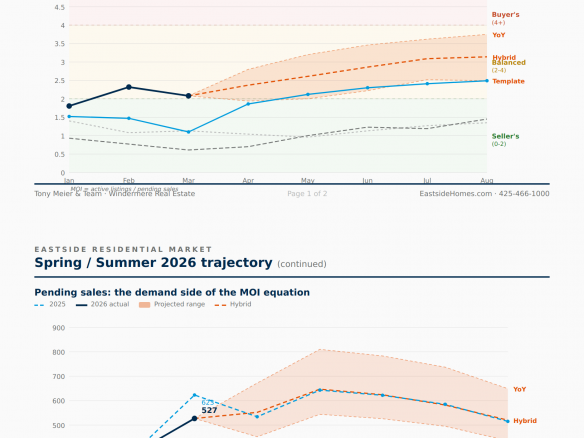
Pending sales came in at 146 this week — up 9.8% from last week and the strongest weekly reading since spring break ended. Year over year, pending is down just 2.0% from the 149 recorded during the comparable week in 2025. The week-over-week improvement is real, but it arrives at the seasonally expected peak. May is historically the strongest pending month of the year on the Eastside — confirmed in 14 of the last 20 years — and the final week of May routinely produces the highest single-week readings before demand begins its seasonal retreat in June. With three weeks now complete, May 2026 is tracking toward approximately 540 to 560 pending sales for the month. That would represent the weakest May since 2008, even with this week's uptick. The data is not signaling a demand recovery — it is signaling that buyers are active at the seasonal peak, as they historically are, before the summer slowdown begins.📦 MONTHS OF INVENTORY — 2.57 | ↓ Down 4.1% from last week's 2.68 | ↑ Up 33.8% year over year
MOI declined to 2.57 this week — down from last week's 2.68 and the second consecutive week of decline, the first back-to-back drop since February. The driver is the pending rebound rather than any slowdown in new listings. MOI remains solidly in balanced market territory, defined locally as 2 to 4 months, and sits 33.8% above the 1.92 recorded during the comparable week in 2025. Two weeks of MOI decline is worth noting, but should be read alongside the seasonal context: pending sales typically peak in May and fall from June onward, which means MOI is likely to resume its climb as summer progresses and buyer activity retreats from its seasonal high.🏠 MEDIAN SOLD PRICE (Rolling 30-Day) — $1,552,500 | ↓ Down 1.4% from last week | ↓ Down 5.9% year over year
The 30-day median eased slightly to $1,552,500 — down 1.4% from last week and 5.9% below the $1,650,000 recorded at this same point in 2025. Closed sales came in at 111 — up 18.1% year over year from the 94 recorded during the comparable week in 2025, a positive transaction signal that reflects deals written several weeks ago rather than current market conditions.🔍 THE BIG PICTURE — WHAT THIS ALL MEANS
This week the data produces a familiar pattern at an unfamiliar scale. Pending sales are at their seasonal peak — as expected in the final week of May — and MOI has dipped modestly as a result. Rates are simultaneously at their highest level since the conflict began. These two forces are pulling in opposite directions, but the seasonal one is temporary. History is clear: pending sales decline from June onward, inventory continues to build toward a July peak, and the MOI pressure that has defined 2026 since February is more likely to resume than reverse. The market is functioning at its seasonal best right now. What comes next is the more important question.🏠 FOR SELLERS
With 31.1% more competition on the market than a year ago, pricing discipline remains the single most important decision you will make. Homes priced accurately against today's comparable sales are still selling, while overpriced listings are sitting longer and often requiring reductions that erode both value and negotiating position. The seasonal data makes the timing case clearly: pending sales are at their annual peak now and will decline from June onward, while inventory continues building toward a July high. Sellers who wait are not simply facing more competition — they are facing more listings and fewer buyers simultaneously. Homes that are accurately priced and well-prepared today are entering the market at the most favorable point in the seasonal curve that 2026 will offer. We have done extensive analysis on what this shift means for sellers in each Eastside sub-market and would welcome the opportunity to walk you through what the data shows for your specific area and home.🔑 FOR BUYERS
Buyers today have more negotiating leverage for this time of year than at any point since 2011. Based on 20 years of data, active listings typically peak in July before beginning a sustained seasonal decline. Buyers who are pre-approved and ready to move now will have the most choices available to them at any point in 2026 — but that window is finite. With rates at a new post-conflict high, arriving pre-approved and stress-testing your qualification at current levels before making a move is an essential first step.If we can help you think through what this means for your move, we are here. Tony Meier & Team — Windermere Real Estate / NE, Kirkland, WA