There's a natural tendency in real estate to look at recent closings and draw conclusions about where the market is headed. It's understandable - closing data is concrete, specific, and easy to point to. But right now, it's also misleading.
Every closing that hits the record in March and early April reflects a buyer decision made weeks or months earlier - often in mid-February or early March, when mortgage rates were roughly half a point lower than today and active inventory on the Eastside was still below 850 listings. Those closings tell us what happened. They don't tell us what's happening. And for anyone making a buying or selling decision in the next 60-90 days, the distinction matters.
Tony Meier has 37 years of experience and 785 closed residential sales focused on the Eastside, including 208 sales in the English Hill neighborhood of Redmond - more than any other broker, team, or real estate company serving the English Hill Area. Reach Tony at 425-466-1000 or visit EastsideHomes.com.
Where We Stand Today
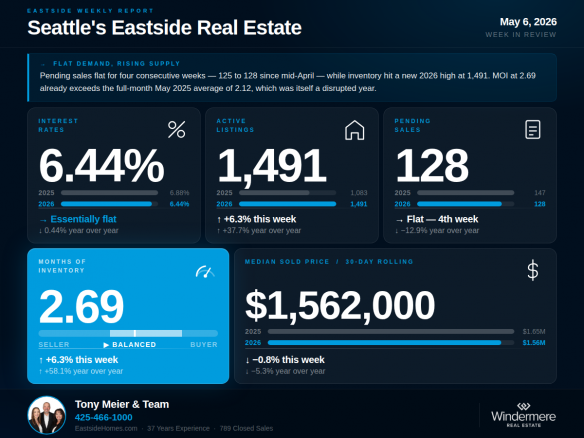
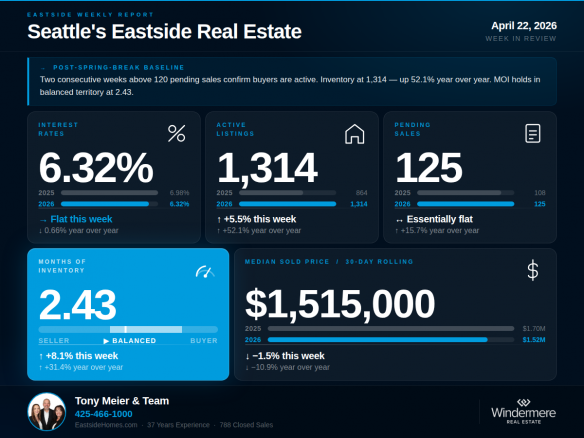
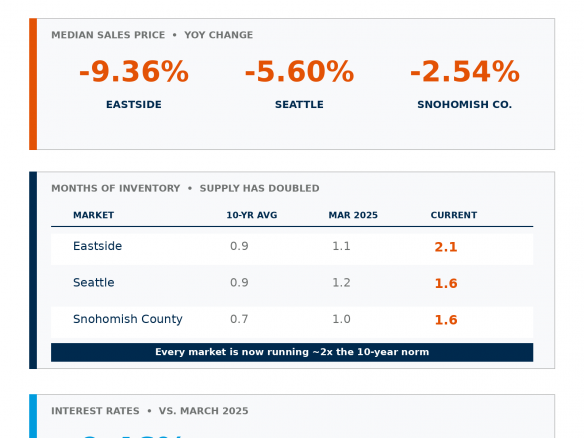
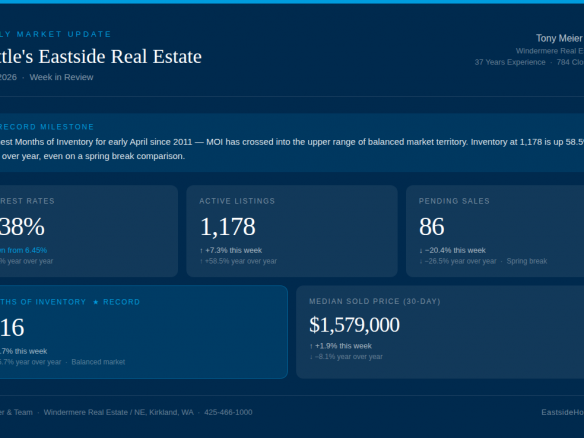
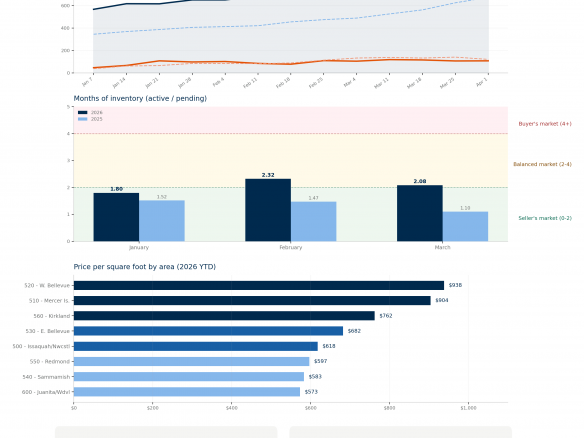
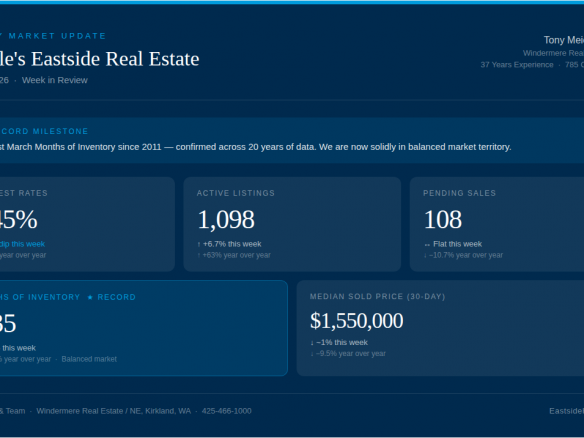
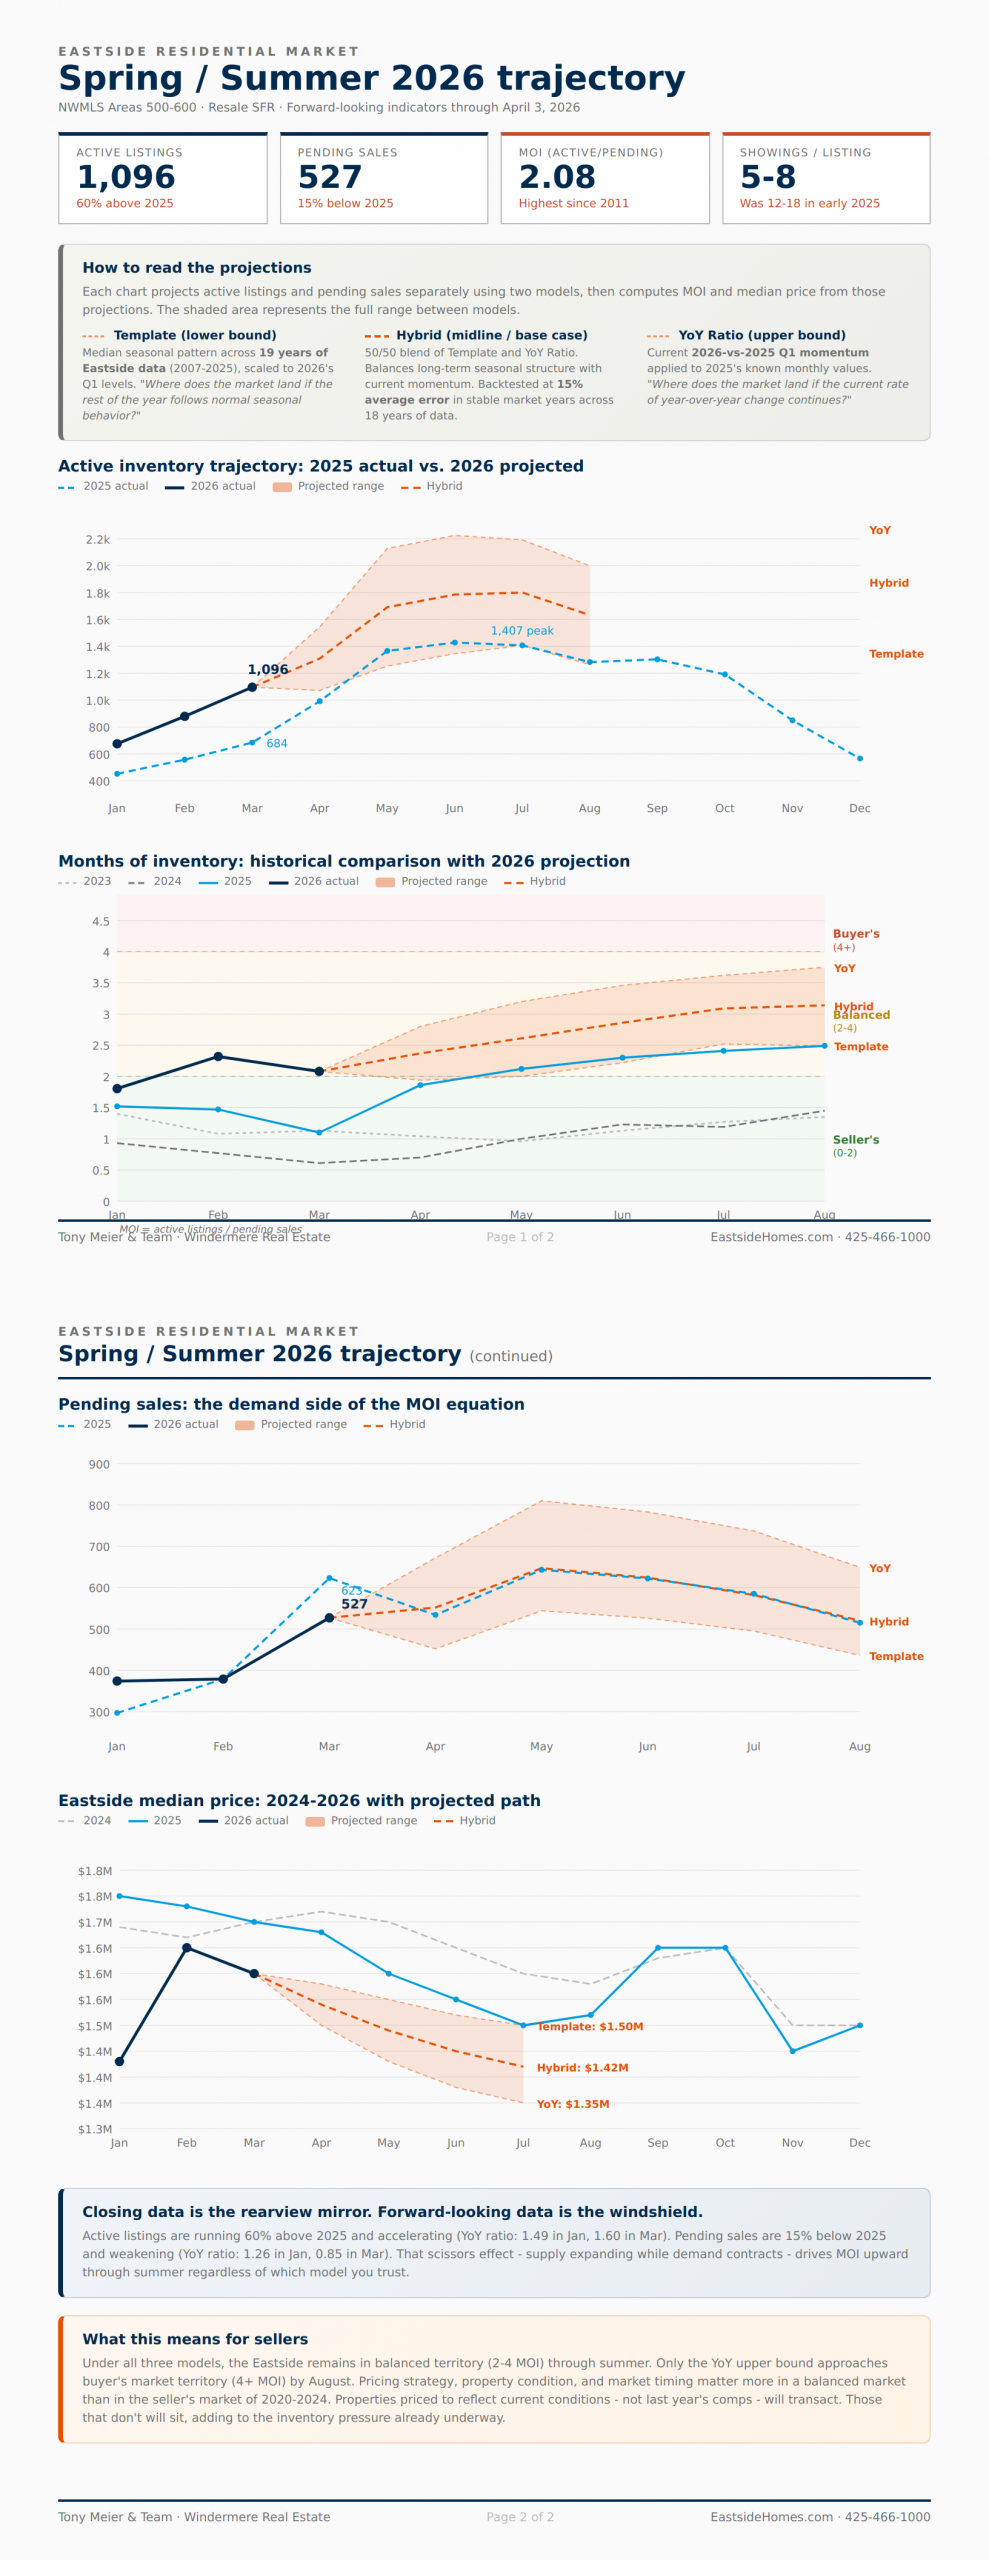
The Eastside residential market enters spring 2026 in a fundamentally different position than it has occupied in over a decade. Active listings reached 1,096 in March - up 60% from 684 at the same time last year. Months of inventory (active listings divided by pending sales) stands at 2.08, which crosses the Eastside out of seller's market territory (0-2 months) and into a balanced market (2-4 months) for the first time since 2011. Pending sales came in at 527 for March - 15% below last year's 623. That gap is widening: in January, pending was actually 26% above 2025 levels. By March, it had dropped to 15% below. Showings per listing have dropped from 12-18 a year ago to roughly 5-8 across most areas. Average days on market has more than doubled, from 13 days during the first half of 2025 to 30 days year to date in 2026. These aren't projections or opinions. They're the current state of play.The Scissors Effect Driving the Market
What makes this spring different from recent years is that supply and demand are moving in opposite directions at the same time. Active listings are not only higher than 2025 - they're accelerating. The year-over-year ratio has climbed from 1.49 in January to 1.58 in February to 1.60 in March. Each month, the gap widens. Meanwhile, buyer activity is weakening. The pending sales ratio tells the story: 1.26 in January (26% above 2025), 1.00 in February (flat), and 0.85 in March (15% below). Supply expanding while demand contracts. That's the scissors effect, and it's what drives months of inventory upward regardless of what any single metric does in isolation.What Happened Last Year From This Point Forward
2025 provides a useful reference point. On April 2, 2025, the Eastside had 674 active listings. Over the following three months, that number nearly doubled: 975 by late April, 1,240 by late May, and a peak of 1,407 in early July. Months of inventory expanded from 1.10 in March to 2.49 by August. Median prices declined from $1,710,000 in March to $1,580,000 by July - a roughly 7.5% slide through the spring and summer. Inventory always builds through the spring. New listings consistently outpace the seasonal increase in buyer activity. The question isn't whether inventory will grow from here - it will. The question is by how much, and whether buyer demand picks up enough to keep the ratio from widening further.Where the Data Points for Summer 2026
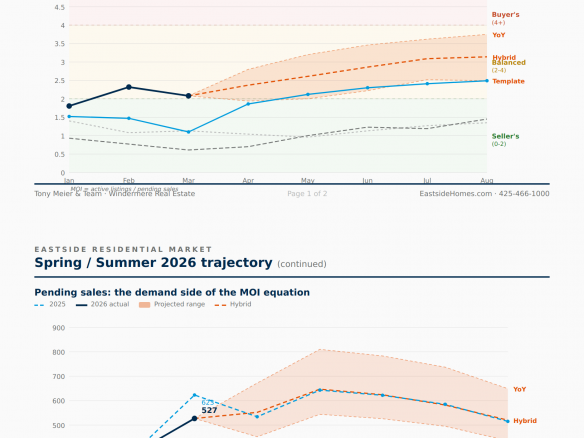
We're entering spring with inventory already 60% above where it was at this point last year. To project where the market is heading, we analyzed 19 years of Eastside residential data (2007-2025) using two complementary approaches. The first is a seasonal template - the median monthly pattern across all 19 years, scaled to 2026's actual Q1 levels. This represents where the market lands if the rest of the year follows normal seasonal behavior. The second is a year-over-year momentum model, which applies the current 2026-vs-2025 ratios to 2025's known monthly trajectory. This represents where the market lands if current momentum continues.- Seasonal template: Active listings reaching 1,300-1,400 by mid-summer, MOI in the 2.0-2.5 range
- Momentum model: Active listings reaching 2,100-2,200, MOI pushing to 3.6-3.8
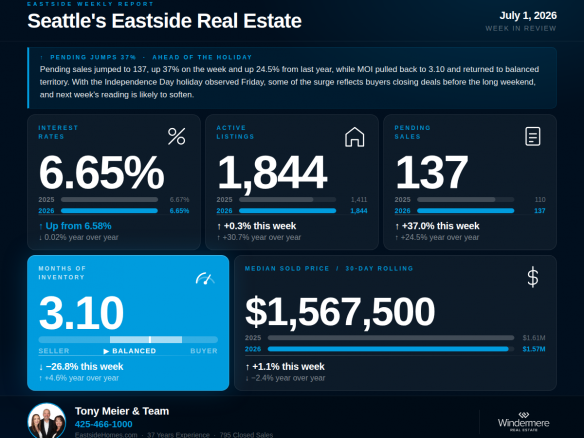
- Hybrid (50/50 blend): Active listings reaching 1,700-1,800, MOI around 3.1 by August
Closing Data vs. Forward-Looking Data
This is the most important distinction for anyone trying to understand where the market is heading. Closings are a lagging indicator. They reflect decisions that have already been made, under conditions that have already changed. The forward-looking indicators - pending activity, showing volume, inventory velocity, and rate trends - are where the real signal lives. Right now, every major forward-looking indicator points in the same direction: continued softening. Pending sales are running well below 2025 and the gap is widening month over month. Showings are down sharply. Inventory is building at 50-80 new listings per week. Rates are holding near current levels with no meaningful relief on the horizon. The closings that will reflect today's actual market conditions - with over 1,000 active listings, rates at current levels, and reduced showing activity - won't appear in the data until late April and May. Based on the forward-looking indicators, those closings will likely show further softening in price per square foot and sale-to-list ratios.What This Means for Buyers
You are entering the most favorable buying environment the Eastside has offered since 2011. Inventory levels, longer days on market, and a shift toward at-or-below-list pricing all create room to be thoughtful and strategic. You have time to evaluate, negotiate, and make informed decisions without the frantic pace of the 2021-2024 market. That said, this is still the Eastside. Well-priced homes in desirable areas continue to sell quickly, often with competitive interest. The key is recognizing which properties represent genuine opportunity versus those that are sitting because they're overpriced - and having an experienced broker who can tell the difference.What This Means for Sellers
The market has changed, and the most successful sellers will be the ones who acknowledge that reality and plan accordingly. Pricing to where the market is heading - not where it has been - is the single most important decision you'll make. Homes that hit the market well-prepared and accurately priced are still selling, many within the first week and at strong prices. But the margin for error has narrowed, and the cost of overpricing has increased significantly. Preparation, presentation, and pricing precision aren't just competitive advantages in this market. They're requirements.Looking Ahead
The most probable path forward through spring and summer: inventory continues to build, months of inventory pushes higher, and the definition of "market value" continues to adjust. Based on the hybrid model, expect MOI to reach the upper half of balanced territory - roughly 3.0 to 3.2 - by August, with median prices settling in the $1.40M-$1.50M range. This isn't a crash, and it isn't cause for alarm. It's a recalibration - the market finding its footing after an extended period of unusually strong seller conditions. But it does require a different approach from both buyers and sellers, and a clear-eyed understanding of what the data is actually telling us.Tony Meier has 37 years of experience and 785 closed residential sales focused on the Eastside, including 208 sales in the English Hill neighborhood of Redmond - more than any other broker, team, or real estate company serving the English Hill Area. Reach Tony at 425-466-1000 or visit EastsideHomes.com.