Tony Meier & Team's Weekly Market Update
If we can help you think through what this means for your move, we are here. Tony Meier & Team — Windermere Real Estate / NE, Kirkland, WA
Audio Version
🏡 May Is Tracking as the Weakest Demand Month Since 2008 — The Seasonal Turn Is Underway | Seattle's Eastside Real Estate Update 05-27-26
Tony Meier | Windermere Real Estate | 37 Years Experience | 792 Closed Eastside SalesMemorial Day week arrived this week — the same holiday that suppressed pending sales to 112 in the comparable week of 2025. This week's reading of 113 is essentially identical, making the year-over-year comparison one of the cleanest in the 2026 data set. What the holiday does not change is the broader story: May is drawing to a close, and its trajectory confirms what we signaled three weeks ago.
📌 WHAT'S COVERED THIS WEEK
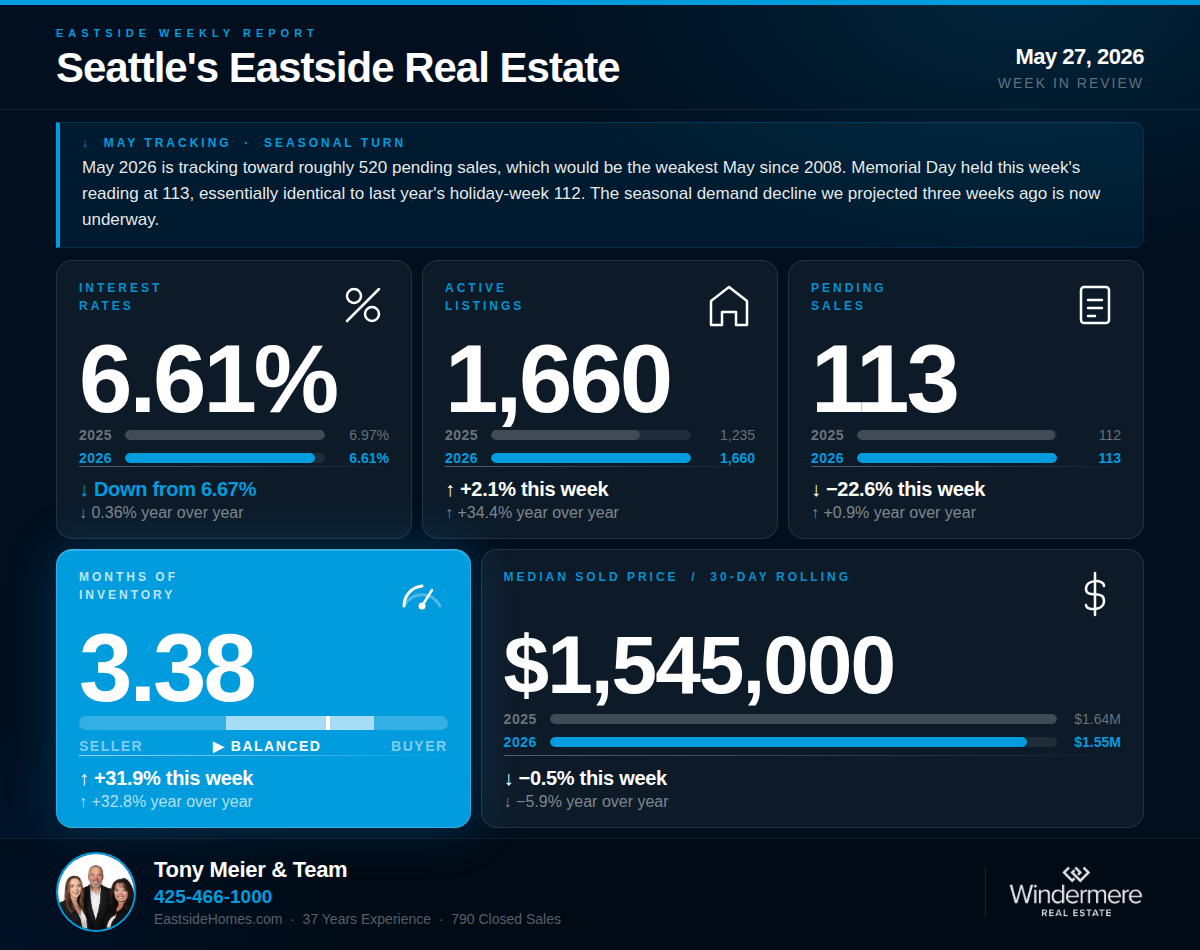
💰 INTEREST RATES — 6.61% | ↓ Slight dip from last week's 6.67% | ↓ Down 0.36% year over year
Rates eased slightly to 6.61% this week — down from last week's post-conflict high but still 0.62 points above the pre-conflict baseline of 5.99%. Year over year, rates remain down 0.36%. The modest improvement is welcome but does not materially change the affordability picture — on a $1.5M home, the rate spread still represents roughly $620 more per month than buyers faced in late February.🏡 ACTIVE LISTINGS — 1,660 | ↑ Up 2.1% from last week | ↑ Up 34.4% year over year
Active listings reached 1,660 this week — another 2026 high and up 34.4% from the 1,235 homes on the market during Memorial Day week in 2025. The inventory build has not paused. We are now approaching what historical data identifies as the seasonal July peak, and the weekly additions continue without interruption.📝 PENDING SALES — 113 | ↓ Down 22.6% from last week | ↑ Up 0.9% year over year
Pending sales came in at 113 this week — down 22.6% from last week's 146, but that decline is almost entirely explained by Memorial Day. Last year's comparable week produced 112 pending sales under the same holiday conditions. Year over year, this week is essentially flat at plus 0.9%. The more important number this week is the May trajectory: based on four weeks of weekly data, May 2026 is tracking toward approximately 520 pending sales for the month. For context, May 2008 — during the Great Recession — produced 522. Every May from 2009 through 2025 came in above that level. If the current tracking holds through month-end, May 2026 would be the weakest May in nearly two decades of data. Three weeks ago we noted that buyers are most active at the seasonal peak and that the decline begins in June. That decline is now underway.📦 MONTHS OF INVENTORY — 3.38 | ↑ Up 31.9% from last week's 2.56 | ↑ Up 32.8% year over year
MOI jumped to 3.38 this week — driven primarily by the Memorial Day pending suppression. Last year's Memorial Day week produced a MOI of 2.54. This year's 3.38 is 33% above that on a like-for-like holiday comparison — a meaningful gap that reflects the structural inventory build, not just the seasonal calendar. MOI remains in balanced market territory, defined locally as 2 to 4 months, though this week's reading is approaching the upper boundary. Next week's data, with buyers returning from the holiday, will provide a cleaner June baseline.🏠 MEDIAN SOLD PRICE (Rolling 30-Day) — $1,545,000 | ↓ Down 0.5% from last week | ↓ Down 5.9% year over year
The 30-day median held near recent levels at $1,545,000 — down 0.5% from last week and 5.9% below the $1,642,500 recorded at this same point in 2025. Closed sales came in at 100 — essentially flat year over year from the 101 recorded during the comparable week in 2025.🔍 THE BIG PICTURE — WHAT THIS ALL MEANS
May is tracking toward its weakest pending total since 2008. Active listings set another 2026 high. MOI — even adjusted for the Memorial Day distortion — sits meaningfully above last year on a like-for-like basis. The seasonal demand peak has passed. From here, historical patterns are clear: pending sales decline through summer while inventory continues building toward a July peak. The window for sellers who want to transact in the most favorable demand environment of 2026 has narrowed considerably. What remains is still a functioning market — accurately priced homes are still selling — but the conditions are measurably more challenging than they were four weeks ago.🏠 FOR SELLERS
With 34.4% more competition on the market than a year ago and May demand tracking toward a nearly two-decade low, pricing discipline is more critical now than at any point in 2026. The seasonal turn is underway. Inventory will continue building toward the July peak while pending sales decline from the May high. Sellers who are in the market now with accurate pricing are competing in a better environment than those who wait for summer. We have done extensive analysis on what this shift means for sellers in each Eastside sub-market and would welcome the opportunity to walk you through what the data shows for your specific area and home.🔑 FOR BUYERS
Buyers today have more negotiating leverage for this time of year than at any point since 2011. Active listings are still growing toward the historical July peak — meaning the widest selection window of 2026 remains ahead for prepared buyers. Well-priced homes are still moving, so arriving pre-approved remains essential. With rates still elevated at 6.61%, stress-testing your qualification at current levels before making a move is a sound first step.If we can help you think through what this means for your move, we are here. Tony Meier & Team — Windermere Real Estate / NE, Kirkland, WA