Brokers Say Home Buyers “Finally Get Some Relief” With Return to “More Traditional Market”
Brokers Say Home Buyers “Finally Get Some Relief” With Return to “More Traditional Market”
Tony Meier & Team. 37 years. 798 closed sales. $249M+ in closed volume since 2020.
KIRKLAND, Washington (October 6, 2022) – “The shift in the market isn’t a surprise,” said broker Mike Larson when commenting on the latest statistics from Northwest Multiple Listing Service. The report on September activity shows active listings are nearly doubled from a year ago, pending sales declined more than 31%, but prices in most counties are still rising.
“Buyers are finally getting some relief,” said Larson, a member of the Northwest MLS board of directors and the managing broker at Compass in Tacoma. “Getting back to a balanced, more normal market is almost a welcome change,” he added, but noted “inflation and rising rates aren’t helping.”
“Though technically still a seller’s market, it is more favorable to buyers than it has been in a decade,” noted John Deely, executive vice president of operations at Coldwell Banker Bain. He cited building inventory, lengthening market time, and a slowdown in price increases as factors.
NWMLS brokers reported 7,504 closed sales during September, down 27% from a year ago when they notched 10,289 completed transactions.
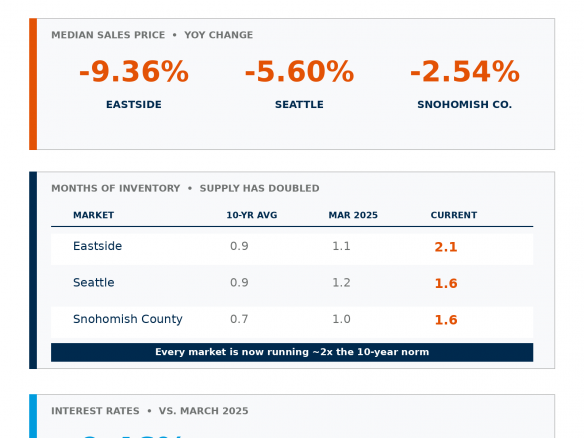
The median price on last month’s sales across the 26 counties in the report rose about 5.1% from a year ago, increasing from $570,000 to $599,000. Prices are down slightly from the August median of $600,000 and from the year’s peak of $660,000 that was reported in May.
“The ‘Great Reversion’ continues with the number of homes in the tri-county market of King, Pierce, and Snohomish counties up 106% from a year ago,” stated Matthew Gardner, chief economist at Windermere Real Estate. “It’s worth noting that current inventory levels in King and Snohomish counties are still around 13% lower than they were in September 2019 prior to the pandemic-induced market shift.”
County
Active Listings, Sept. 2019
Active Listings, Sept. 2022
% change
King
5,431
4,738
-12.8%
Snohomish
2,156
1,873
-13.1%
For the 26 counties in the MLS report there were 15,008 active listings at the end of September. That’s a jump of more than 93% from the year-ago total of 7,757 active listings. It is also a slight improvement (2.2%) from August when there were 14,683 active listings across the NWMLS market.
Measured by months of supply, there are only two months of inventory, an improvement from one year ago when there were only about three weeks (0.75 months) of supply, but still well below the four-to-six months of inventory real estate analysts use as a measure of a balanced market.
King County has 2.02 months of supply, but the other counties in the Puget Sound region have less than that. There is 1.61 months of supply in Kitsap County, 1.63 months in Snohomish County and 1.84 months in Pierce County.
Last month’s uptick in inventory included 9,422 new listings brokers added during September. Compared to the same month a year ago, that volume of new listings dropped 17%. Compared to August, new listings dipped about 5%.
The inventory of single family homes (excluding condominiums) nearly doubled from a year ago, jumping from 6,679 to 13,266 (up 98.6%). Condo listings jumped about 62% from the year-ago figure of 1,078 to 1,742.
Pending sales (mutually accepted offers) of single family homes and condos declined from a year ago, shrinking from 11,318 to 7,764, a drop of more than 31%. Last month’s pendings also fell from the August figure of 9,552 (down 18.7%).
Pending sales of single family homes, which accounted for nearly 88% of last month’s pendings, dropped around 31%, while condo sales slipped nearly 35%.
“Overall, September showed signs of a more traditional market with a natural slowdown of pending sales during this time of year,” observed Deely.
“Although the housing market experienced a major intensity adjustment from the spring, the percentage of homes going under contract within the first 30 days is strong and resilient,” stated J. Lennox Scott, chairman and CEO of John L. Scott Real Estate. “We are seeing approximately 80 percent of sales activity take place in the more affordable, mid-price range, and upper end price points,” he added.
Scott also cautioned against comparisons to the pandemic years. “We can’t compare today’s housing market to the low mortgage rates of the COVID housing stimulus years (2020 to spring 2022).” He suggests pre-pandemic data provides a more realistic comparison, noting “In September, we experienced about the same number of new listings as we did pre-pandemic, but with less intensity and a lower percentage of homes going under contract.”
A comparison of counties in the MLS report shows wide variation in year-over-year price (YOY) changes. Prices dropped in six counties (Clallam, Columbia, Lewis, Okanogan, Pacific and San Juan), while five counties registered double-digit increases (Adams, Douglas, Ferry, Skagit, and Walla Walla). The remaining 15 counties had single-digit YOY price gains.
In Kirkland, which Money magazine just ranked third-best place to live in the U.S., the median price of a single family home that sold during September was $1,355,000. That marked a jump of about 8.6% from the year-ago sales price of $1,247,500.
Area-wide, the median price on last month’s single family homes (excluding condos) rose 4.75%, from $589,000 to $617,000. King County, where the median price on last month’s single family home sales was $875,000, had the most expensive homes. Within King County, single family homes on the Eastside fetched the highest price last month at $1.2 million. Homes in the southwest segment of the county sold for about half that amount ($590,000), but they had the highest YOY increase when comparing the six sub-areas tracked by the MLS. Countywide, single family home prices increased nearly 6%.
Condo prices surged 9.2% from a year ago, rising from $435,000 to $475,000.
“We are in a new market and proper pricing is most important,” emphasized Dean Rebhuhn, owner at Village Homes and Properties in Woodinville. “We are still experiencing pent-up buyer demand in King, Snohomish and Pierce counties,” he added, pointing to low supply in those areas.
Commenting on prices, Deely said, “From January through June, we had double-digit median price increases every month, which ceased in July. All this gives buyers more selection and the time to be more selective.”
In general, “sellers are still realizing nice gains,” Larson commented.
Gardner pointed out home prices “remain positive compared to a year ago,” adding, “I don’t expect that to change through the end of 2022.” By spring, however, he believes “it’s likely that year-over-year prices will start to trend negative. That said, I firmly believe that this will only be a short period of correction, so homeowners in the Puget Sound area shouldn’t be too concerned, especially given that 64% of them are sitting on over 50% of home equity.”
Uncertainty about the direction of mortgage rates is prompting buyer hesitancy, according to some market watchers.
“With uncertainty over interest rate increases, some buyers are still holding off,” stated Deely. “For sellers, correct pricing remains critical if they want to capture buyers who are currently in the marketplace.” Continuing, Deely said, “Sellers need to be hyper-local in their pricing strategy based on what is happening in their local market now versus ‘what could have been’ earlier in the year.”
Rebhuhn agreed, saying motivated sellers are reducing prices to attract showings as increasing mortgage rates are reducing purchasing power.
Larson suggested waning consumer confidence may be having an impact on activity. “When consumer confidence in the economy is low, the instinctive response is to hunker down and do nothing.”
Allison Schrager, a Bloomberg Opinion columnist who covers economics, recently commented about buyers “sitting on the sidelines until rates or prices or both decline.” She faults the Fed’s interference, writing “don’t count on rates falling to those pandemic lows. They were the result of extraordinary market manipulation from the Fed,” suggesting there will be a “hangover from the very low rates in 2020 and 2021.”
On a brighter note, The Conference Board said its Consumer Confidence Index® increased in September for the second consecutive month. Acknowledging recession risks “nonetheless persist,” Lynn Franco, senior director of economic indicators at The Conference Board, stated, “Concerns about inflation dissipated further in September – prompted largely by declining prices at the gas pump. . .”
Commenting on inflation, veteran broker Rebhuhn said, “Smart purchasers understand home ownership is a good hedge against inflation.”
About Northwest Multiple Listing Service
As the leading resource for the region’s residential real estate industry, NWMLS provides valuable products and services, superior member support, and the most trusted, current listing data and industry information for real estate professionals. NWMLS is a member-owned, not-for-profit organization with more than 2,500 member offices and 32,000 real estate brokers throughout Washington state. With extensive knowledge of the region, NWMLS operates 20 service centers and serves 26 counties, providing dedicated support to its members and fostering a robust, cooperative brokerage environment. nwmls.com.
Single Fam. Homes + Condos
LISTINGS
PENDING SALES
CLOSED SALES
MONTHS OF INVENTORY
New Listings
Total Active
# Pending Sales
# Closings
Avg. Price
Median Price
This month
Same mo., year ago
King
3,504
4,738
2,314
2,348
$987,616
$799,000
2.02
0.68
Snohomish
1,300
1,873
1,153
1,146
$763,543
$700,000
1.63
0.48
Pierce
1,425
2,247
1,331
1,218
$592,423
$526,000
1.84
0.67
Kitsap
440
713
410
443
$644,857
$535,500
1.61
0.69
Mason
159
287
134
111
$478,607
$410,000
2.59
0.76
Skagit
211
369
183
180
$644,644
$552,250
2.05
1.21
Grays Harbor
160
405
170
137
$354,868
$345,000
2.96
1.43
Lewis
142
348
142
116
$403,927
$378,475
3.00
1.66
Cowlitz
138
256
123
118
$415,853
$399,950
2.17
0.89
Grant
112
211
95
104
$368,676
$350,000
2.03
1.24
Thurston
419
641
432
423
$526,711
$480,000
1.52
0.56
San Juan
28
117
28
24
$1,085,104
$773,750
4.88
2.96
Island
188
296
162
136
$604,771
$542,500
2.18
0.69
Kittitas
98
207
78
88
$702,269
$516,500
2.35
1.34
Jefferson
48
115
61
51
$649,947
$598,000
2.25
0.83
Okanogan
59
186
54
46
$381,085
$327,000
4.04
5.07
Whatcom
415
720
344
331
$611,260
$545,000
2.18
0.92
Clark
79
145
82
65
$570,065
$495,000
2.23
0.70
Pacific
62
162
63
51
$384,195
$340,000
3.18
1.66
Ferry
9
29
5
4
$255,046
$262,591
7.25
3.25
Clallam
87
189
88
99
$500,940
$439,000
1.91
0.95
Chelan
118
267
118
93
$689,162
$550,000
2.87
1.74
Douglas
54
95
49
50
$553,200
$497,500
1.90
1.00
Adams
14
61
12
10
$358,409
$358,859
6.10
1.05
Walla Walla
80
112
63
60
$468,352
$411,000
1.87
1.41
Columbia
6
26
6
3
$613,667
$201,000
8.67
10.00
Others
67
193
64
49
$384,615
$360,000
3.94
1.26
Total
9,422
15,008
7,764
7,504
$726,348
$599,000
2.00
0.75
4-county Puget Sound Region Pending Sales (SFH + Condo combined)
(totals include King, Snohomish, Pierce & Kitsap counties)
Jan
Feb
Mar
Apr
May
Jun
Jul
Aug
Sep
Oct
Nov
Dec
2003
4746
5290
6889
6837
7148
7202
7673
7135
6698
6552
4904
4454
2004
4521
6284
8073
7910
7888
8186
7583
7464
6984
6761
6228
5195
2005
5426
6833
8801
8420
8610
8896
8207
8784
7561
7157
6188
4837
2006
5275
6032
8174
7651
8411
8094
7121
7692
6216
6403
5292
4346
2007
4869
6239
7192
6974
7311
6876
6371
5580
4153
4447
3896
2975
2008
3291
4167
4520
4624
4526
4765
4580
4584
4445
3346
2841
2432
2009
3250
3407
4262
5372
5498
5963
5551
5764
5825
5702
3829
3440
2010
4381
5211
6821
7368
4058
4239
4306
4520
4350
4376
3938
3474
2011
4272
4767
6049
5732
5963
5868
5657
5944
5299
5384
4814
4197
2012
4921
6069
7386
7015
7295
6733
6489
6341
5871
6453
5188
4181
2013
5548
6095
7400
7462
7743
7374
7264
6916
5951
6222
5083
3957
2014
5406
5587
7099
7325
8055
7546
7169
6959
6661
6469
5220
4410
2015
5791
6541
8648
8671
8620
8608
8248
7792
7179
6977
5703
4475
2016
5420
6703
8130
8332
9153
8869
8545
8628
7729
7487
6115
4727
2017
5710
6024
7592
7621
9188
9042
8514
8637
7441
7740
6094
4460
2018
5484
5725
7373
7565
8742
8052
7612
6893
6235
6367
5328
4037
2019
5472
4910
7588
8090
8597
8231
7773
7345
6896
6797
5788
4183
2020
5352
6078
6477
5066
7297
8335
8817
9179
8606
7934
6122
4851
2021
5216
5600
8002
7716
8674
8824
8049
8586
7880
7405
6022
3943
2022
4405
5560
7312
6908
7482
6031
5934
6581
5208
Thinking about a move on the Eastside?
Tony Meier & Team has closed 798 residential transactions with $249M+ in volume since 2020. Whether you are six months out or just curious about your home’s value, we would be glad to help you think it through.
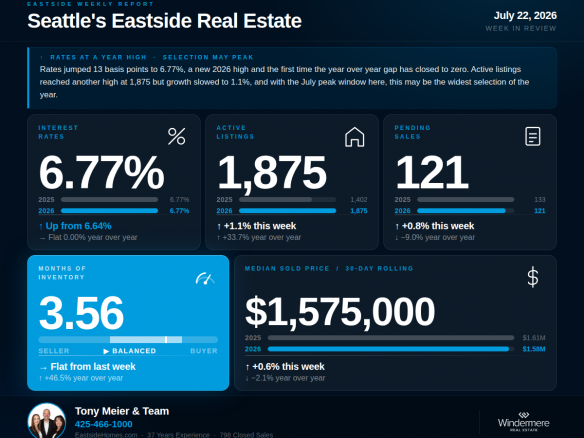
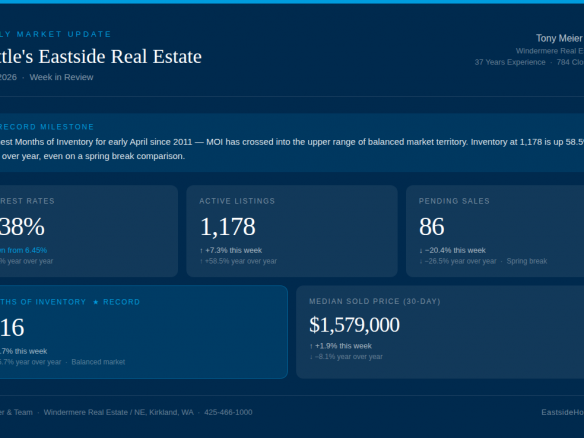
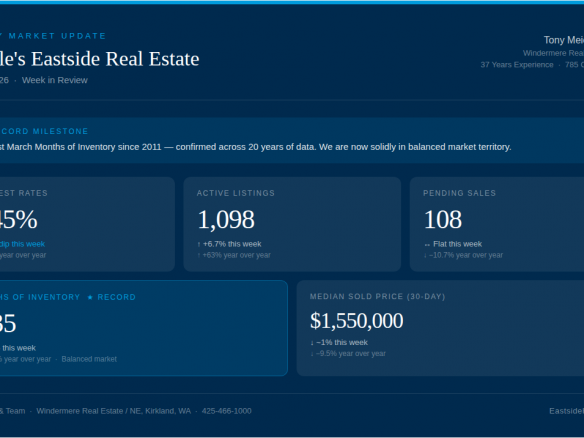
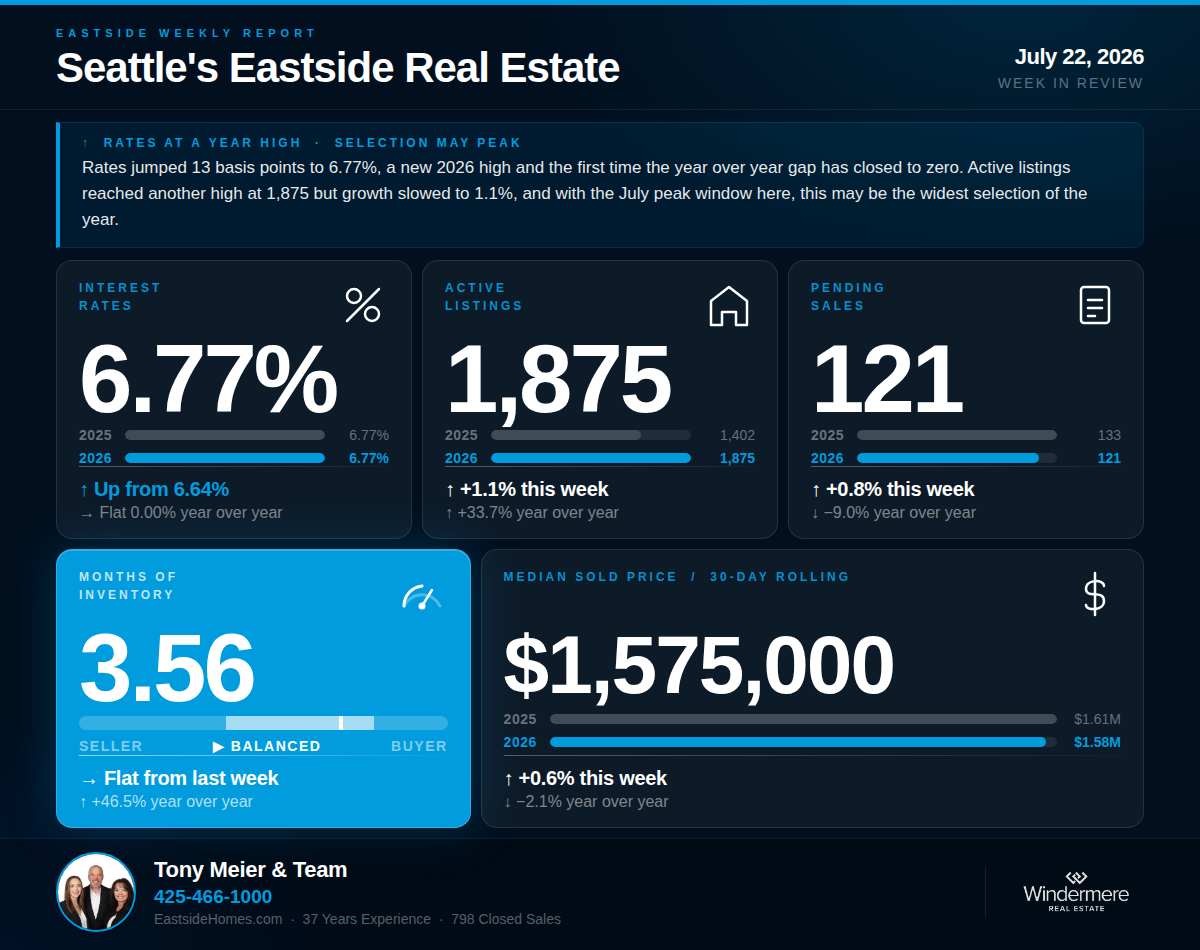
Rates jumped to 6.77%, a new 2026 high and the highest in nearly a year — the last time they were higher was July 28, 2025. The buyer's year-over-year rate advantage has closed to zero. Meanwhile inventory growth slowed sharply as the July peak window arrives, meaning selection may be peaking too.
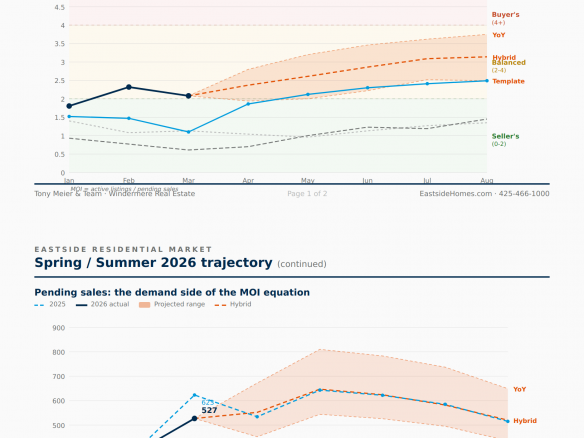
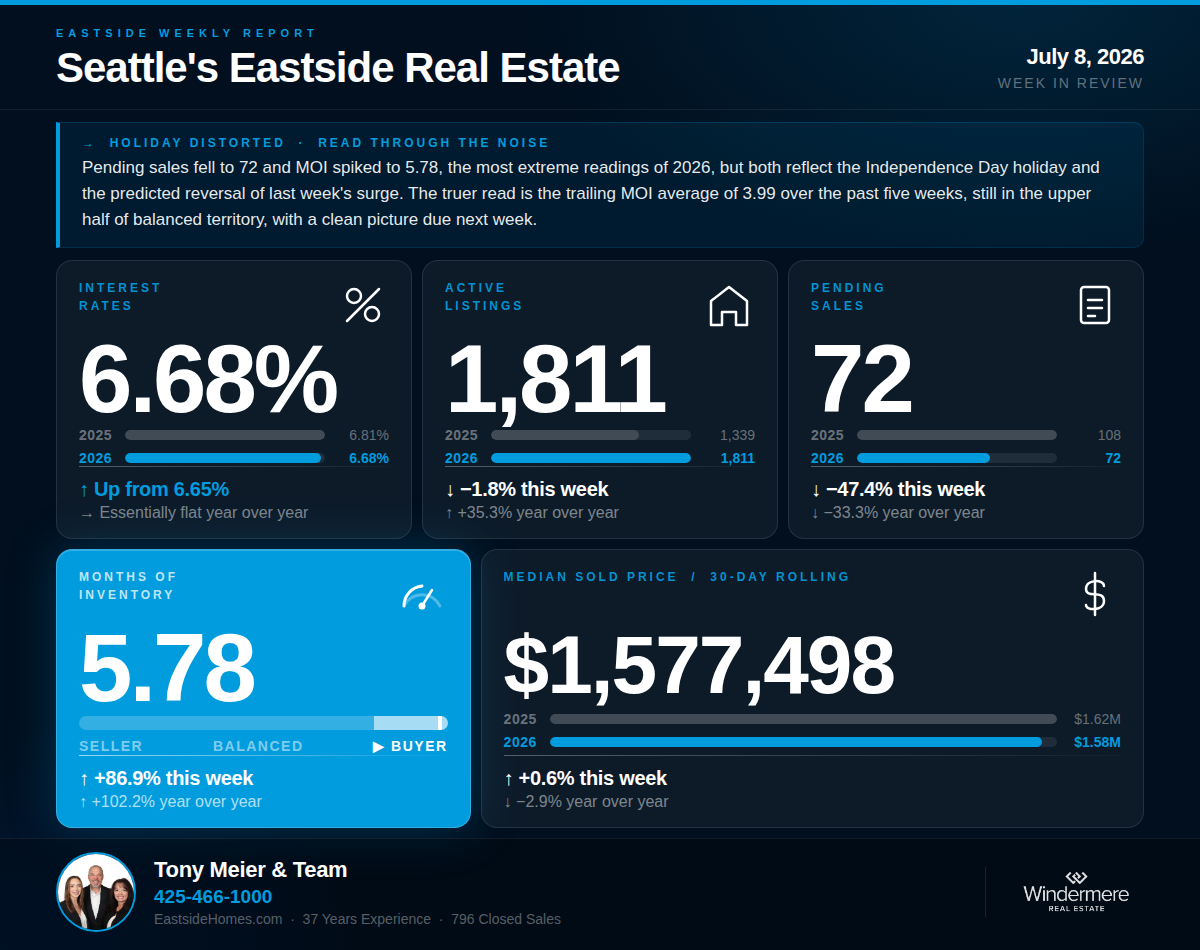
This week's headline numbers are the most extreme readings of 2026, but they arrive with the Independence Day holiday firmly stamped on them. Pending fell to 72, MOI jumped to 5.78, and active listings declined for the first time all year. A clean read of underlying market conditions will not be available until next week.
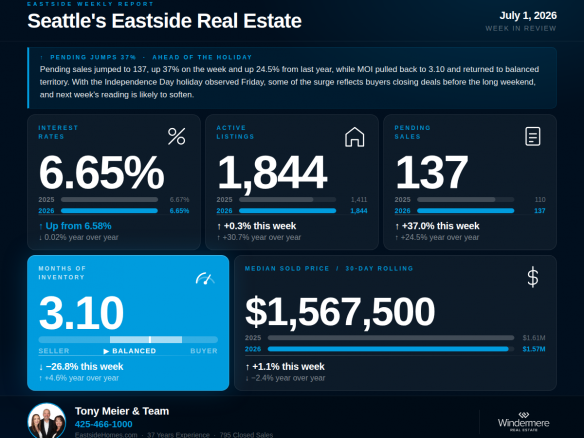
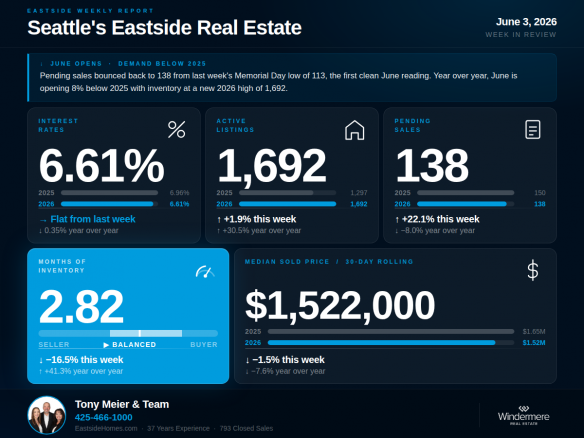
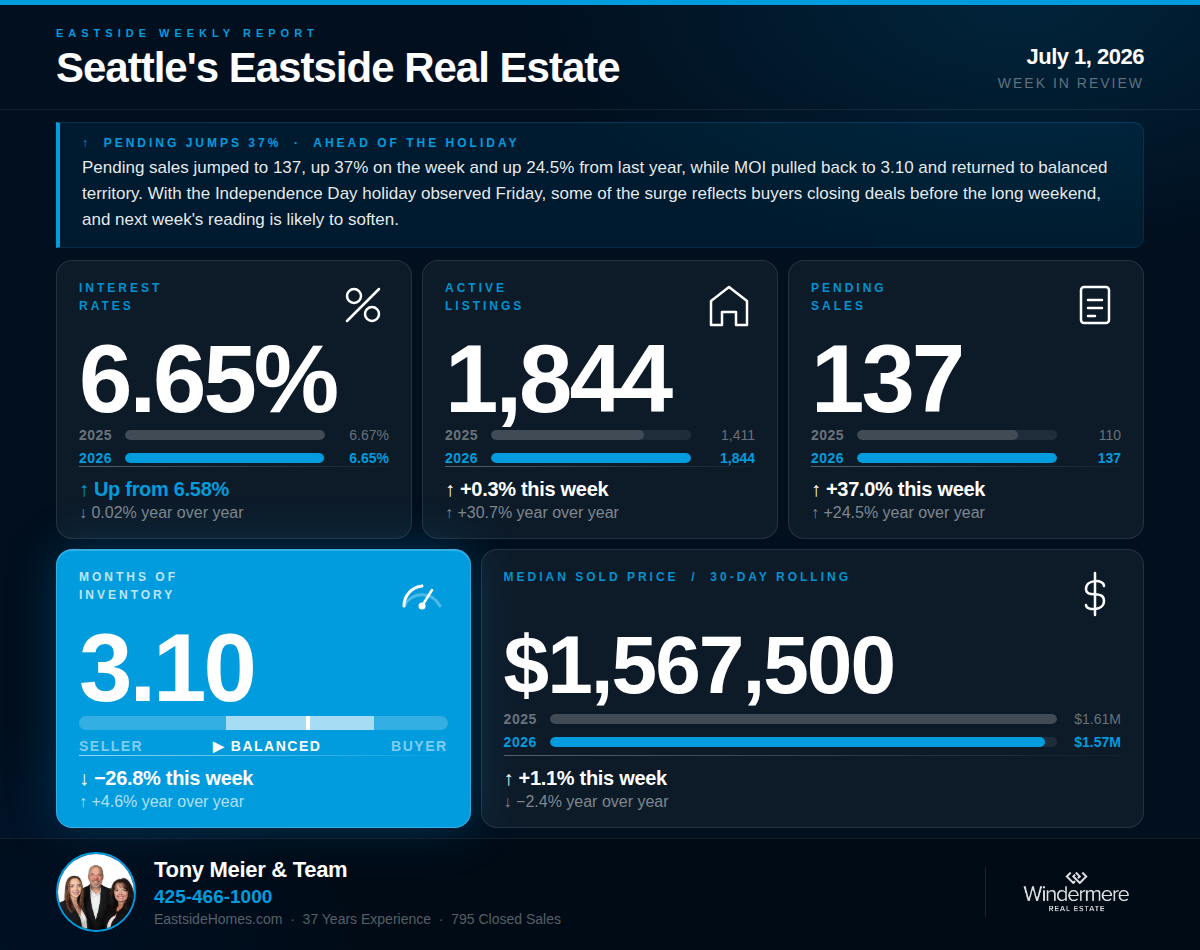
Pending sales jumped 37% this week to 137, MOI pulled back to 3.10 returning to balanced territory, and active listings barely grew for the first time all year. But pre-holiday timing complicates the read, and next week's Independence Day suppression is likely to reverse the pending signal.
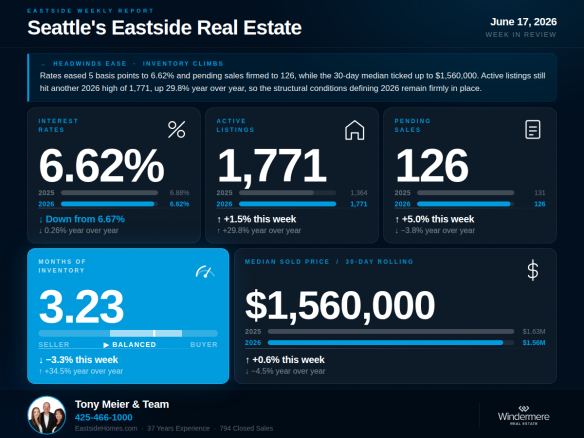
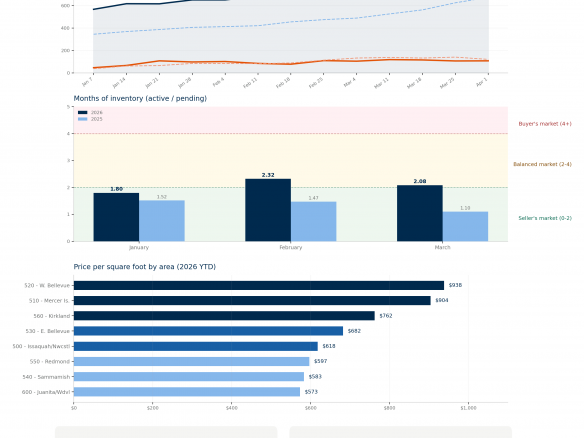
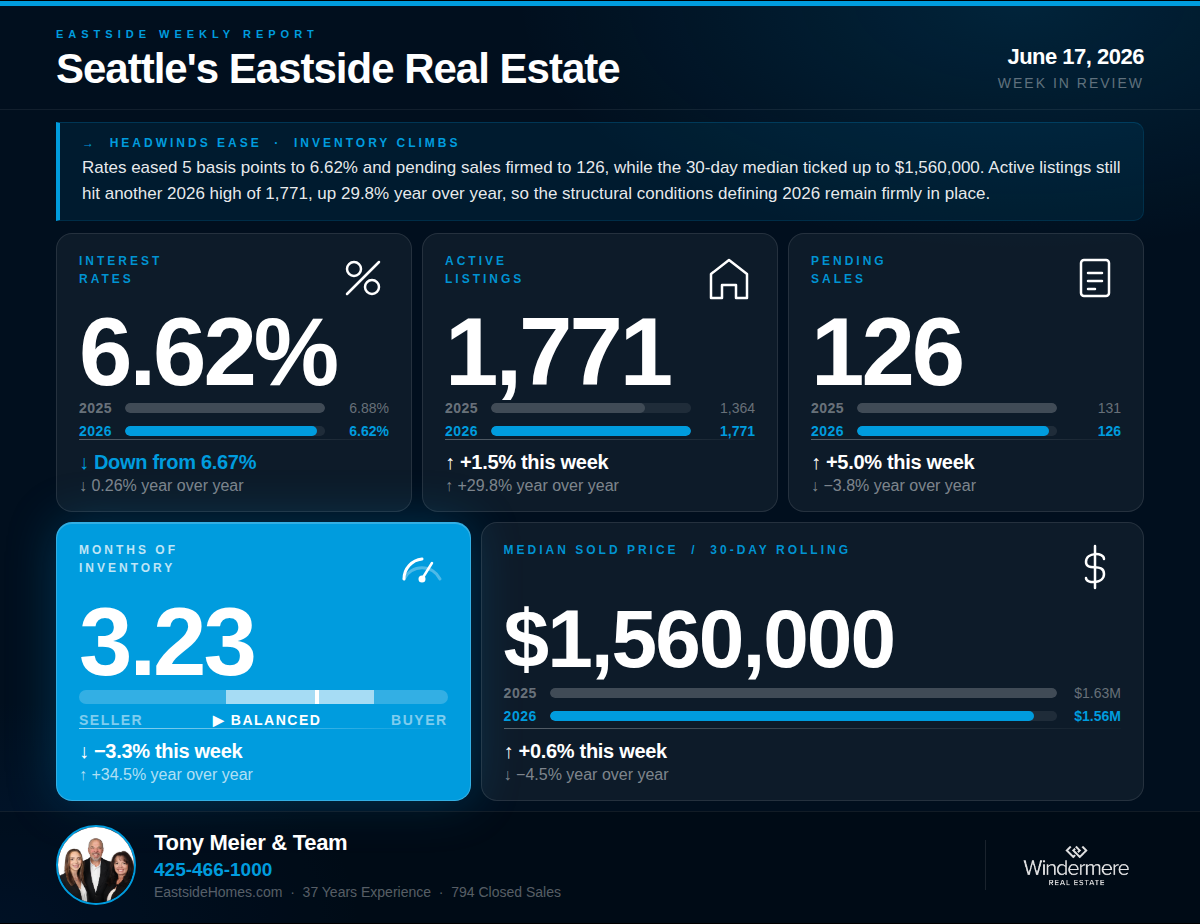
The data this week reads in mixed directions: rates eased to 6.62%, pending sales firmed modestly to 126, and active listings climbed to 1,771 — another 2026 high. Four short-term signals moved in sellers' favor this week, but the structural conditions defining 2026 remain in place.
Three signals converged this week: pending sales fell sharply with the YOY gap widening to -17.2%, rates returned to the post-conflict high of 6.67%, and Months of Inventory jumped to 3.34 — the second-highest weekly reading of 2026, this time without holiday distortion to explain it.
 KIRKLAND, Washington (October 6, 2022) – “The shift in the market isn’t a surprise,” said broker Mike Larson when commenting on the latest statistics from Northwest Multiple Listing Service. The report on September activity shows active listings are nearly doubled from a year ago, pending sales declined more than 31%, but prices in most counties are still rising.
“Buyers are finally getting some relief,” said Larson, a member of the Northwest MLS board of directors and the managing broker at Compass in Tacoma. “Getting back to a balanced, more normal market is almost a welcome change,” he added, but noted “inflation and rising rates aren’t helping.”
“Though technically still a seller’s market, it is more favorable to buyers than it has been in a decade,” noted John Deely, executive vice president of operations at Coldwell Banker Bain. He cited building inventory, lengthening market time, and a slowdown in price increases as factors.
NWMLS brokers reported 7,504 closed sales during September, down 27% from a year ago when they notched 10,289 completed transactions.
The median price on last month’s sales across the 26 counties in the report rose about 5.1% from a year ago, increasing from $570,000 to $599,000. Prices are down slightly from the August median of $600,000 and from the year’s peak of $660,000 that was reported in May.
“The ‘Great Reversion’ continues with the number of homes in the tri-county market of King, Pierce, and Snohomish counties up 106% from a year ago,” stated Matthew Gardner, chief economist at Windermere Real Estate. “It’s worth noting that current inventory levels in King and Snohomish counties are still around 13% lower than they were in September 2019 prior to the pandemic-induced market shift.”
KIRKLAND, Washington (October 6, 2022) – “The shift in the market isn’t a surprise,” said broker Mike Larson when commenting on the latest statistics from Northwest Multiple Listing Service. The report on September activity shows active listings are nearly doubled from a year ago, pending sales declined more than 31%, but prices in most counties are still rising.
“Buyers are finally getting some relief,” said Larson, a member of the Northwest MLS board of directors and the managing broker at Compass in Tacoma. “Getting back to a balanced, more normal market is almost a welcome change,” he added, but noted “inflation and rising rates aren’t helping.”
“Though technically still a seller’s market, it is more favorable to buyers than it has been in a decade,” noted John Deely, executive vice president of operations at Coldwell Banker Bain. He cited building inventory, lengthening market time, and a slowdown in price increases as factors.
NWMLS brokers reported 7,504 closed sales during September, down 27% from a year ago when they notched 10,289 completed transactions.
The median price on last month’s sales across the 26 counties in the report rose about 5.1% from a year ago, increasing from $570,000 to $599,000. Prices are down slightly from the August median of $600,000 and from the year’s peak of $660,000 that was reported in May.
“The ‘Great Reversion’ continues with the number of homes in the tri-county market of King, Pierce, and Snohomish counties up 106% from a year ago,” stated Matthew Gardner, chief economist at Windermere Real Estate. “It’s worth noting that current inventory levels in King and Snohomish counties are still around 13% lower than they were in September 2019 prior to the pandemic-induced market shift.”