Audio Version
Tony Meier | Windermere Real Estate | 37 Years Experience | 796 Closed Eastside Sales
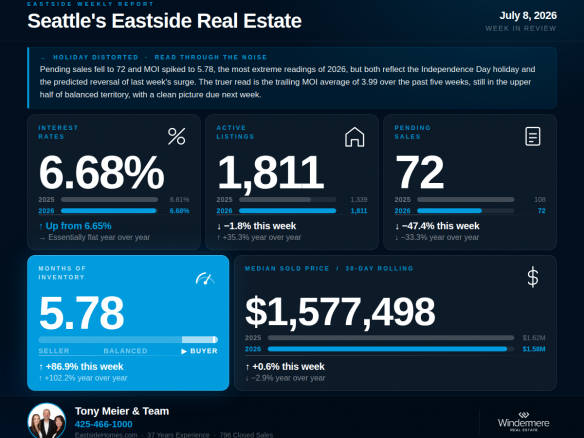
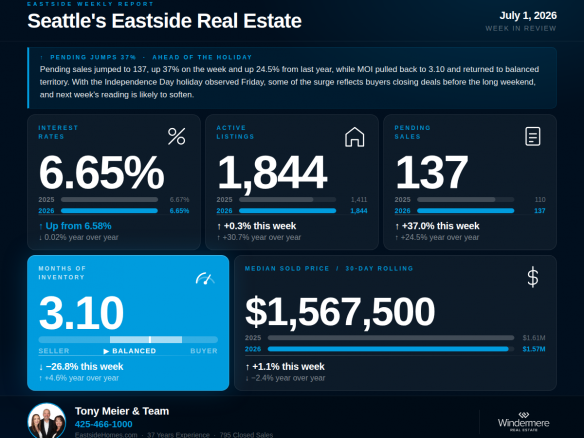
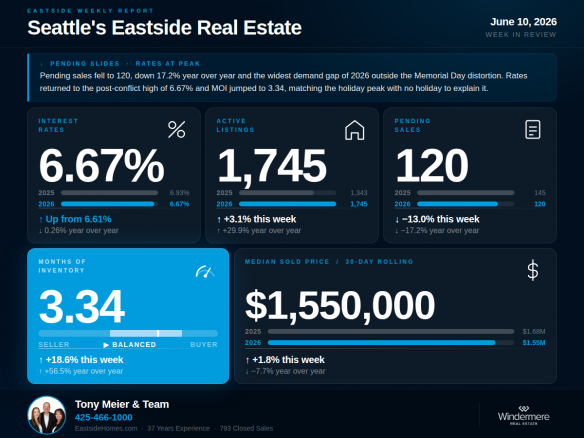
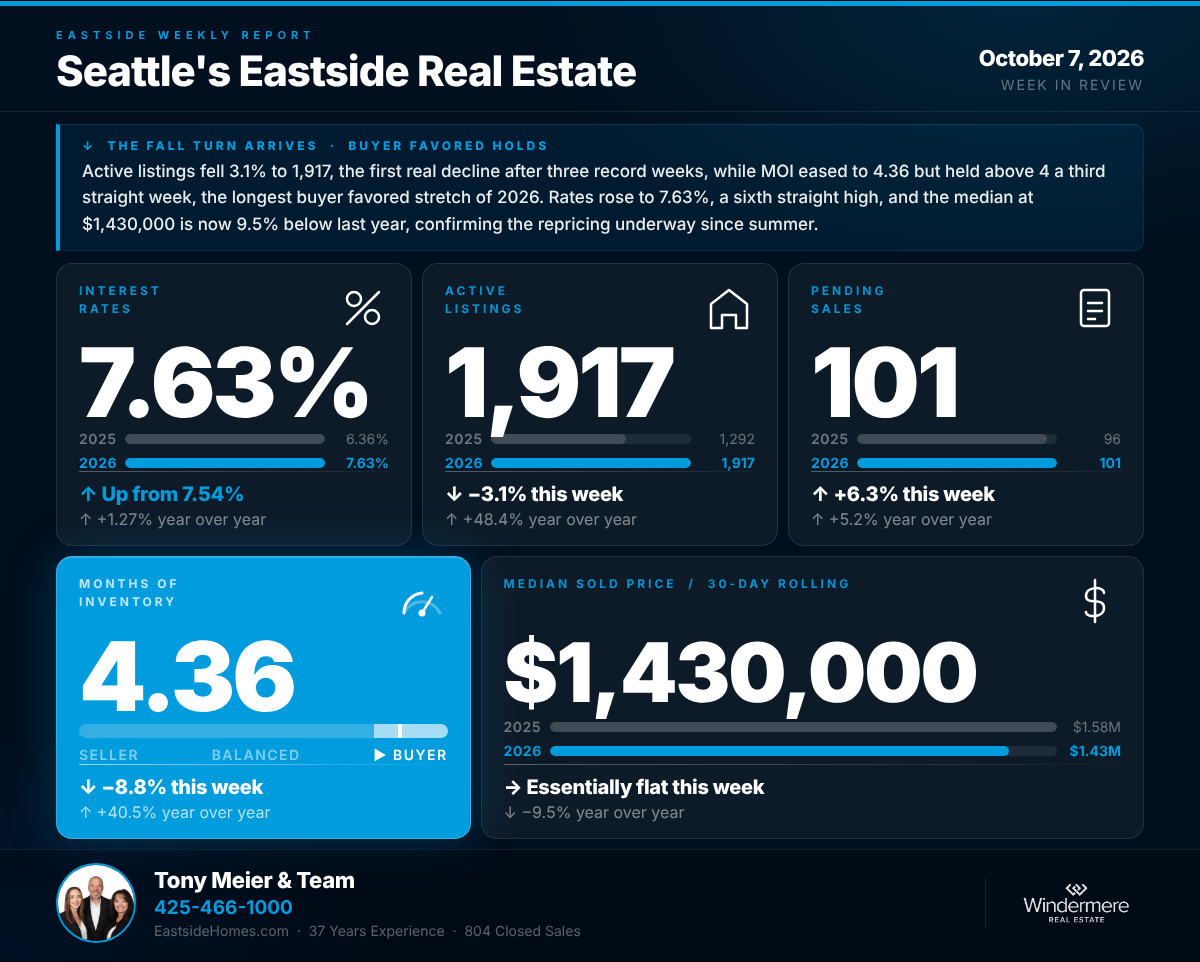
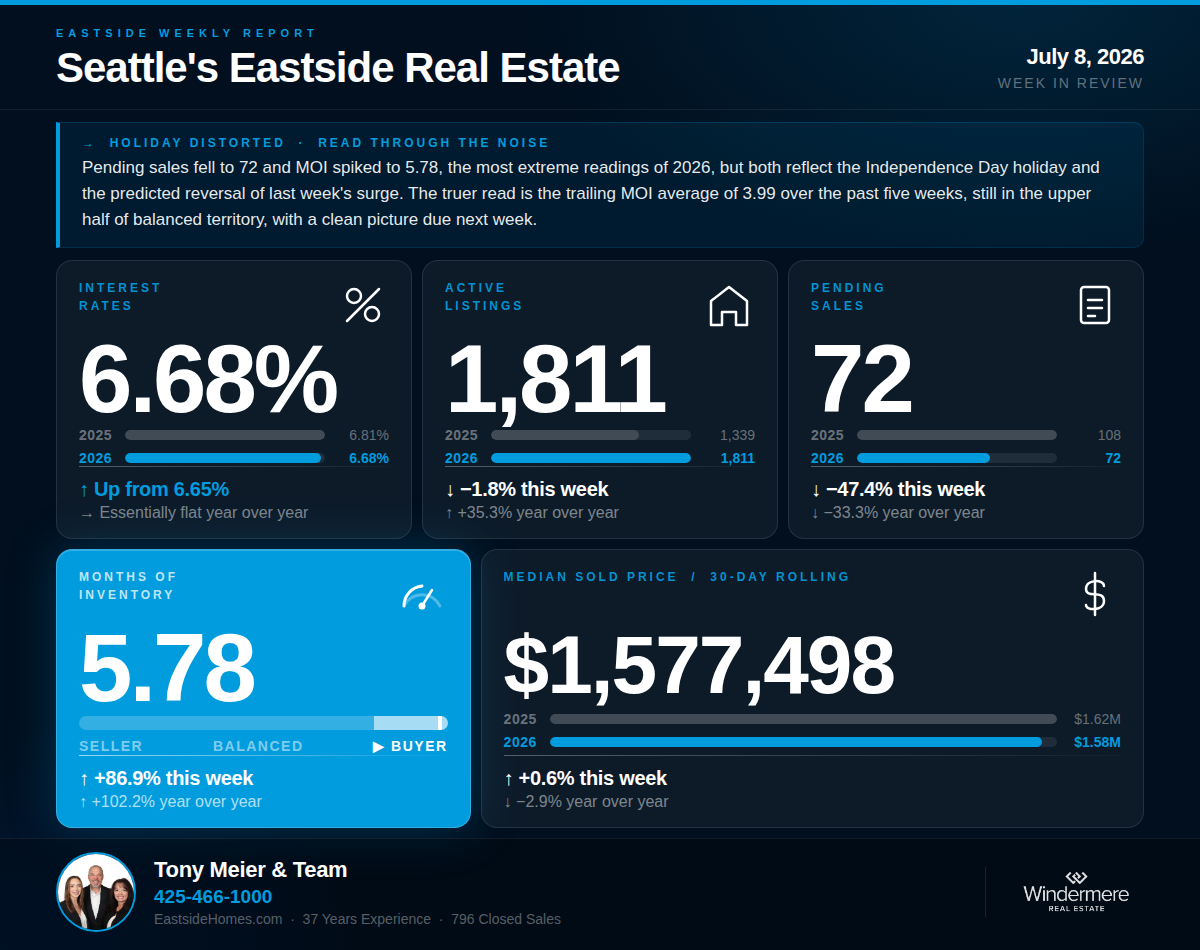
This week's headline numbers are the most extreme readings of 2026, but they arrive with the Independence Day holiday firmly stamped on them and must be read accordingly. Pending sales dropped to 72, Months of Inventory jumped to 5.78, and active listings declined for the first time all year. Before drawing structural conclusions, holiday context is essential. Last week we noted that the pre-holiday pending surge to 137 would likely reverse this week, similar to what we saw around Memorial Day when pending fell to 113. This week's 72 is that reversal, and then some. A clean read of underlying market conditions will not be available until next week's data arrives.
💰 Interest Rates — 6.68%
↑ Up 3 bp from last week's 6.65% | → Essentially flat year over year Rates ticked up slightly to 6.68% this week, up 3 basis points from last week. The pre-conflict baseline of 5.99% sits 0.69 points below where rates are today. Year over year, rates are essentially flat. On a $1.5M home, this week's rate represents roughly $680 more per month in carrying costs than buyers faced in late February.🏡 Active Listings — 1,811
↓ Down 1.8% from last week | ↑ Up 35.3% year over year Active listings came in at 1,811 this week, down 1.8% from last week's 1,844. This is the first week-over-week decline in active listings in 2026. Historically, active listings peak in July in 8 of the last 20 years, so a seasonal peak in this window would be consistent with pattern. However, holiday weeks typically produce fewer new listings, which may account for part of this decline. Confirmation of a seasonal peak requires seeing whether next week continues the pullback or resumes the growth. Year over year, active listings still sit 35.3% above the 1,339 recorded during the comparable week in 2025.📝 Pending Sales — 72
↓ Down 47.4% from last week | ↓ Down 33.3% year over year Pending sales dropped to 72 this week, down 47.4% from last week's 137 and down 33.3% from the 108 recorded during the comparable week in 2025. This is the lowest weekly pending reading of 2026 and the most severe drop of the year. The primary driver is the Independence Day holiday. Buyers travel, contracts pause, and the week including July 4 consistently produces suppressed readings. Two contextual points matter. First, we predicted this drop last week based on the pre-holiday pending surge and the Memorial Day pattern. Second, last year's comparable week was itself holiday-suppressed at 108, which is why the year-over-year comparison of negative 33.3% is more meaningful than the week-over-week drop. Adjusted for the holiday, this year's demand is running below last year, but the exact magnitude will not be clear until next week when travel-related contract pauses resolve.📦 Months of Inventory — 5.78
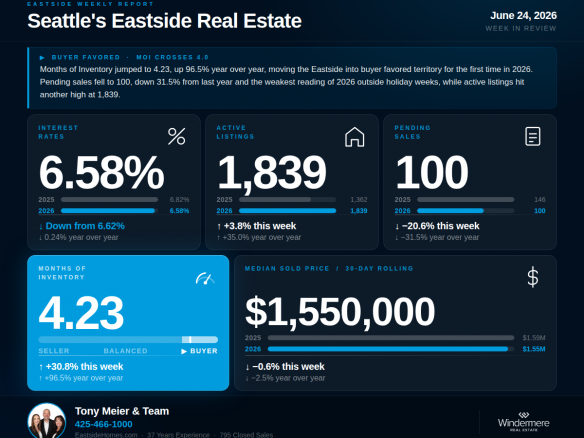
↑ Up 86.9% from last week's 3.10 | ↑ Up 102.2% year over year MOI jumped to 5.78 this week, up 86.9% from last week's 3.10 and 102.2% above the 2.86 recorded during the comparable week in 2025. This places the Eastside deep into buyer-favored territory, defined locally as anything above 4 months. However, this reading is heavily distorted by the holiday-suppressed pending number. The MOI calculation divides active listings by pending sales, so any temporary drop in pending produces an amplified spike in MOI. A more useful measure is the trailing five-week average, which sits at 3.99, still in the upper half of balanced territory but nowhere near the 5.78 headline. Next week's data will be critical for reading the underlying trend.🏠 Median Sold Price (Rolling 30-Day) — $1,577,498
↑ Up 0.6% from last week | ↓ Down 2.9% year over year The 30-day median ticked up to $1,577,498, up 0.6% from last week and 2.9% below the $1,624,995 recorded at this same point in 2025. Closed sales came in at 82, down 21.9% year over year from the 105 recorded during the comparable week in 2025. The closed sales drop reflects transactions written in early June when pending sales were softening.🔍 The Big Picture — What This All Means
This week's data is holiday-distorted and should not be read as a snapshot of underlying market conditions. Pending sales at 72 and MOI at 5.78 are extreme readings driven primarily by the Independence Day holiday, exactly as we predicted last week. The Memorial Day precedent provides useful guidance. In late May, pending fell to 113 during Memorial Day week and MOI jumped to 3.38, then normalized the following week. We should expect a similar pattern here, with next week's data providing a much cleaner read on the underlying market. What is worth noting despite the distortion is that active listings declined week over week for the first time in 2026, which may or may not signal the seasonal peak. The two weeks following the holiday will clarify both the demand picture and whether the July inventory peak has arrived.🏠 For Sellers
Pricing discipline remains the most critical decision you will make this summer. This week's data is holiday-distorted and does not on its own change the picture we have been building. Inventory is still 35.3% above year-ago levels, MOI on a trailing five-week average is 3.99, and the seasonal peak may be arriving. What matters for sellers is not any single week's reading but the trend that develops over the next two to three weeks as holiday effects clear. Sellers who are accurately priced and in the market now continue to have the best opportunity of the summer. Sellers waiting for structural improvement should not read this week's distorted data as a signal in either direction. We have done extensive analysis on what this shift means for sellers in each Eastside sub-market and would welcome the opportunity to walk you through what the data shows for your specific area and home.🔑 For Buyers
Buyers today continue to have more negotiating leverage for this time of year than at any point since 2011. This week's data reflects the holiday pause more than any underlying shift in the buyer pool. Active listings at 1,811 continue to offer the widest selection of any point in 2026, and the first WoW inventory decline this week may hint that the seasonal peak is arriving. With rates back at 6.68%, updating your pre-approval at current levels remains an essential first step. Well-priced homes continue to move, and buyers who are prepared to act on the right property remain positioned to benefit from the current inventory environment.
If we can help you think through what this means for your move, we are here.
Tony Meier & Team — Windermere Real Estate / NE, Kirkland, WA