Audio Version
Tony Meier | Windermere Real Estate | 37 Years Experience | 798 Closed Eastside Sales
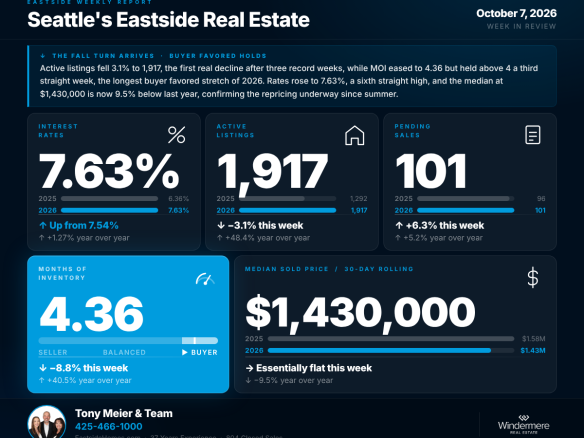
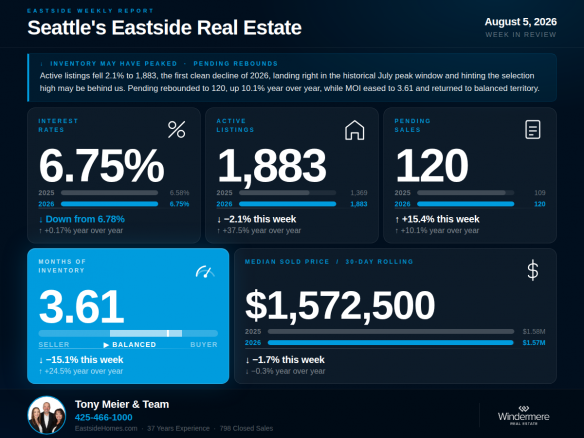
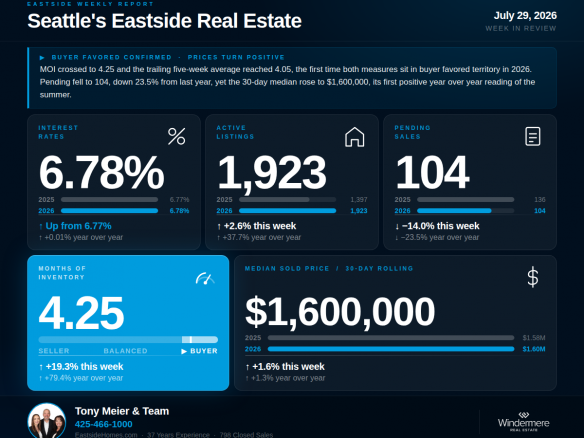
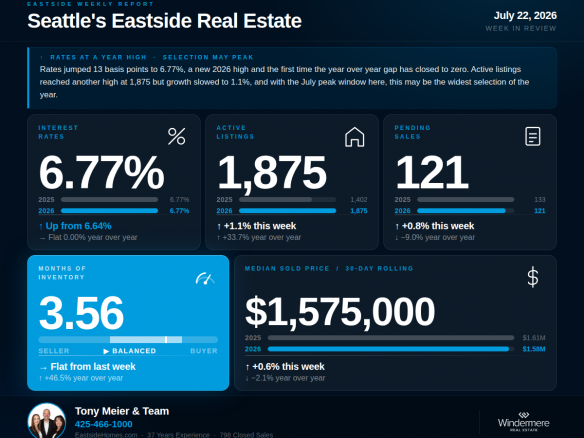
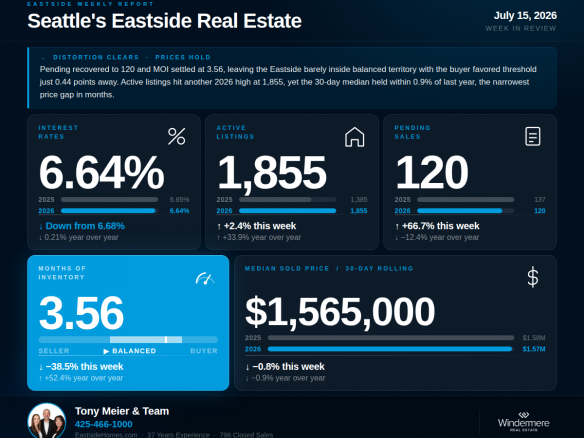
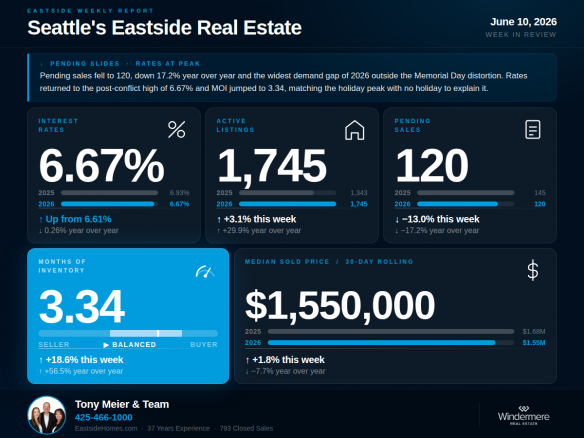
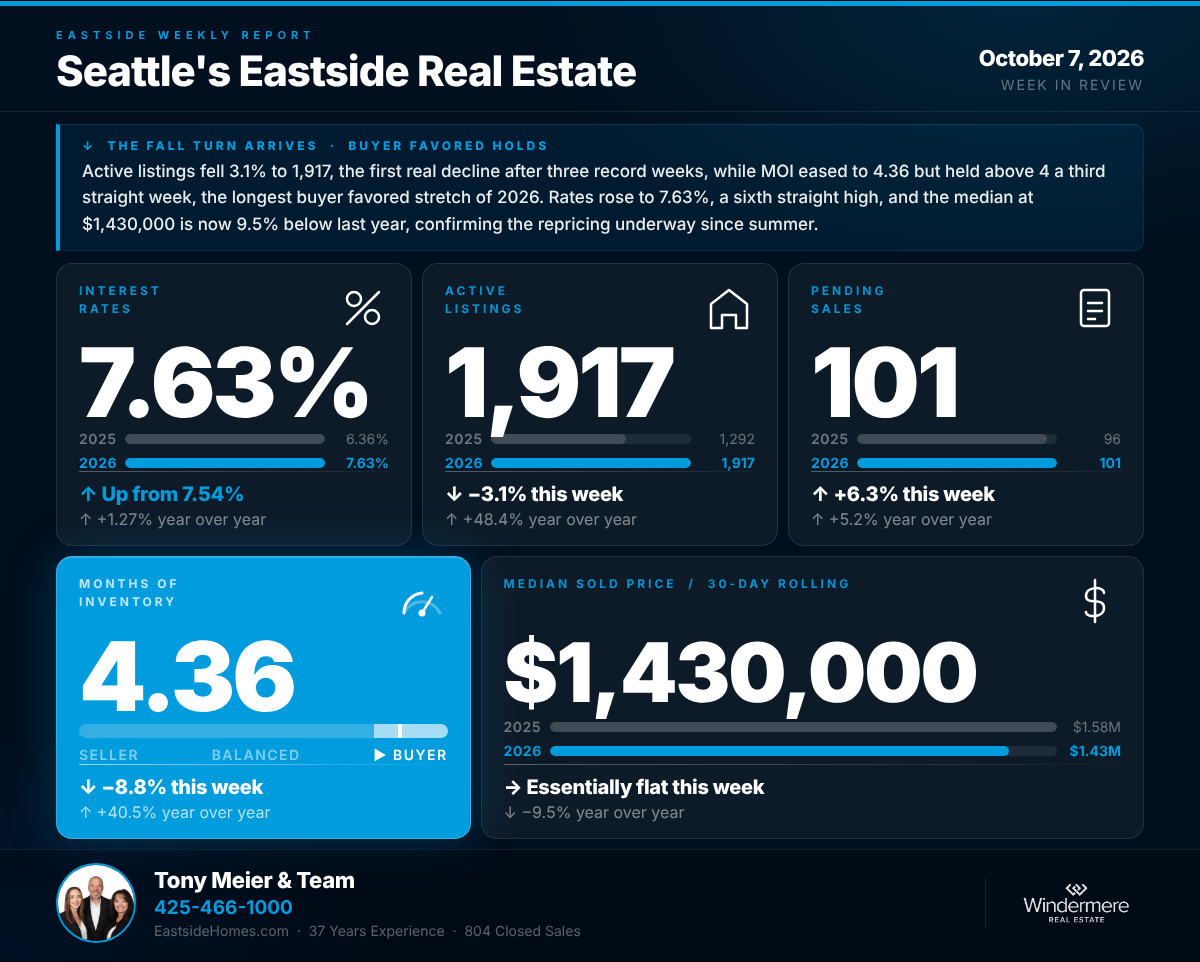
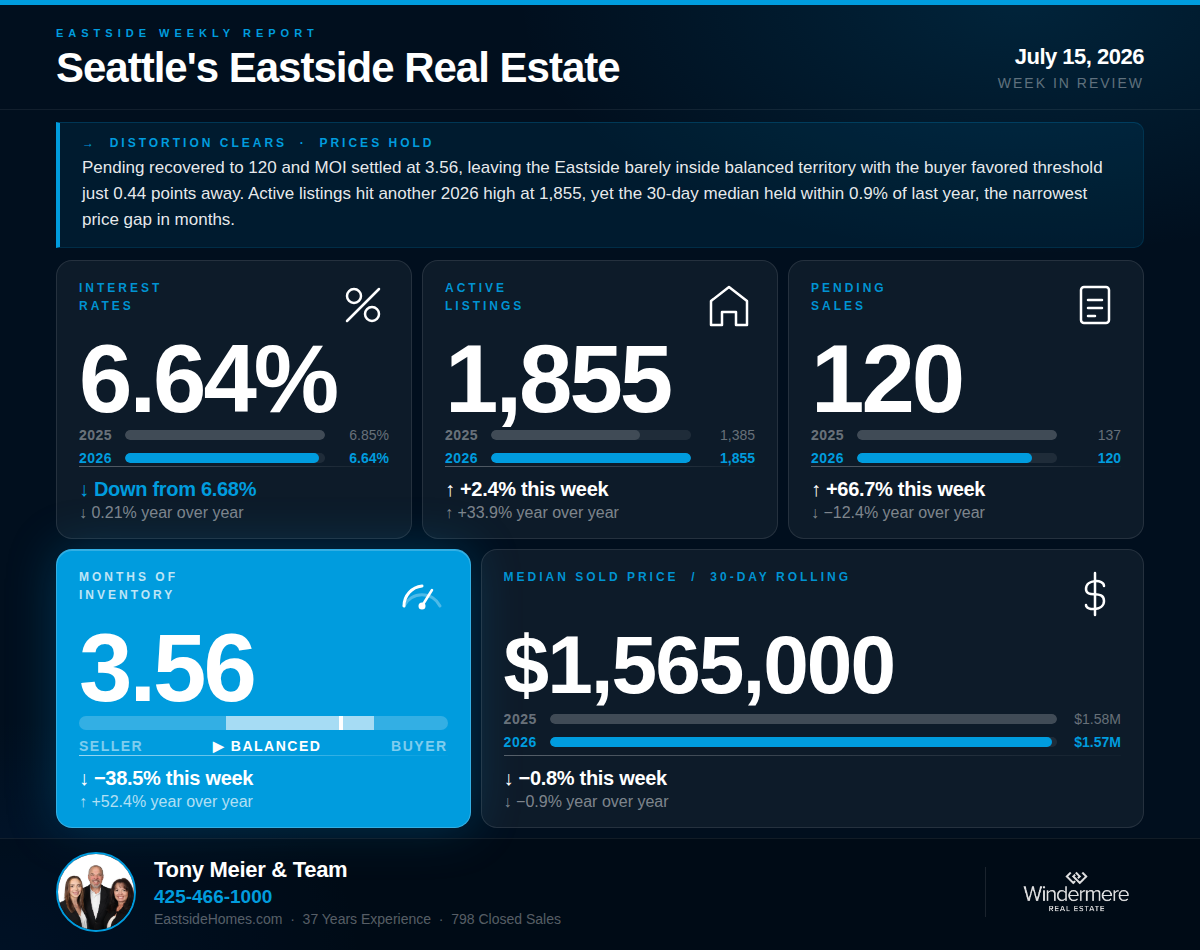
The post-holiday distortion has cleared, and this week's data delivers the clean underlying read we have been waiting for. Pending sales recovered to 120, up 66.7% from last week's holiday-suppressed 72 but still down 12.4% year over year. Active listings climbed to another 2026 high at 1,855, confirming that last week's dip was holiday-related rather than a seasonal peak. MOI settled at 3.56, just barely back inside balanced territory with the buyer-favored threshold sitting only 0.44 points away. The 30-day median showed remarkable resilience, with the year-over-year price gap narrowing to just negative 0.9%. Rates held essentially flat at 6.64%.
💰 Interest Rates — 6.64%
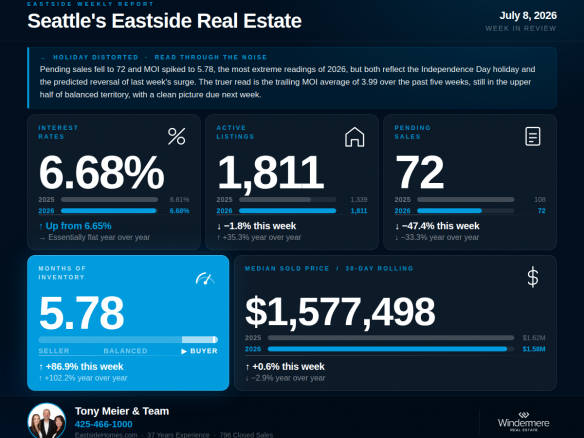
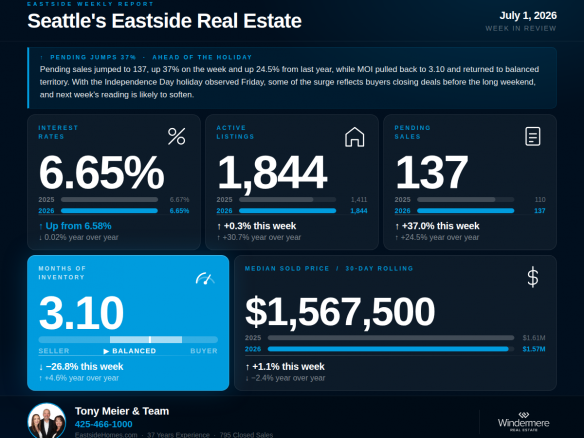
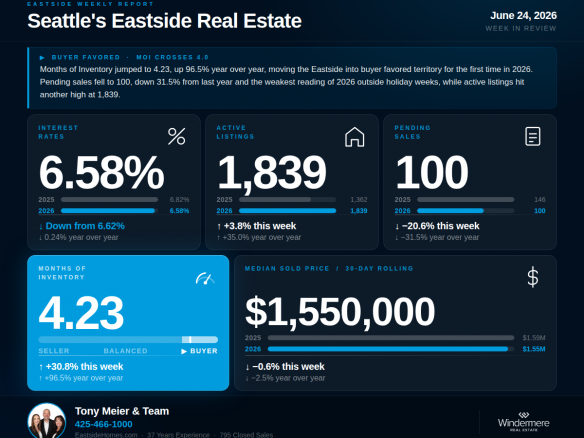
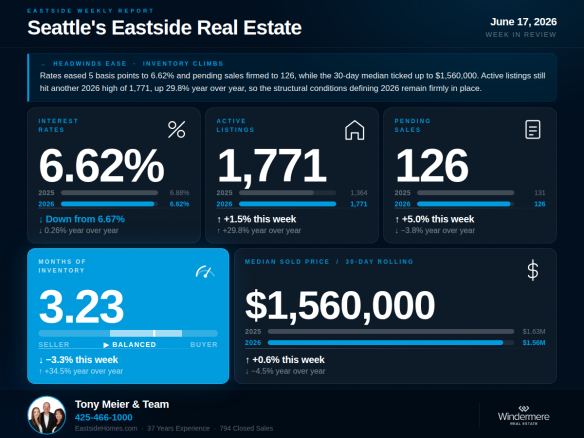
↓ Down 4 bp from last week's 6.68% | ↓ Down 0.21% year over yearRates eased slightly to 6.64% this week, down 4 basis points from last week. The pre-conflict baseline of 5.99% sits 0.65 points below where rates are today. Year over year, rates are down 0.21%. On a $1.5M home, this week's rate represents roughly $640 more per month in carrying costs than buyers faced in late February.
🏡 Active Listings — 1,855
↑ Up 2.4% from last week | ↑ Up 33.9% year over yearActive listings reached 1,855 this week, another 2026 high and up 33.9% from the 1,385 homes on the market during the comparable week in 2025. This is a significant data point. Last week we noted that active listings had declined week over week for the first time in 2026 and questioned whether that signaled the seasonal peak. This week answers that question: not yet. Active listings resumed climbing at 2.4% week over week, and 1,855 is a new 2026 high. Historically the July peak arrives sometime in the second half of the month in most years, so we may still be one to three weeks away from the actual top.
📝 Pending Sales — 120
↑ Up 66.7% from last week | ↓ Down 12.4% year over yearPending sales recovered to 120 this week, up 66.7% from last week's holiday-suppressed 72 but still down 12.4% from the 137 recorded during the comparable week in 2025. With holiday distortion behind us, this reading provides the cleanest year-over-year demand comparison in a month. The trailing five-week average of 111 pending sales tells the more stable story. Demand has settled into a range that is meaningfully below year-ago levels but has not deteriorated further from where we entered June. What the last five weeks of data confirm is that the market has active buyers, but the pool is measurably smaller than a year ago.
📦 Months of Inventory — 3.56
↓ Down 38.5% from last week's 5.78 | ↑ Up 52.4% year over yearMOI settled at 3.56 this week, down 38.5% from last week's distortion and 52.4% above the 2.33 recorded during the comparable week in 2025. The trailing five-week MOI average is now 3.98, essentially at the boundary between balanced and buyer-favored territory. This is the honest reading of underlying supply and demand conditions on the Eastside: technically balanced, but only just. Buyer-favored conditions defined locally as 4 or above sit just 0.44 points from this week's reading and essentially at the trailing five-week average. Any further softening in pending sales or continued inventory growth would push the market over that threshold.
🏠 Median Sold Price (Rolling 30-Day) — $1,565,000
↓ Down 0.8% from last week | ↓ Down 0.9% year over yearThe 30-day median came in at $1,565,000, down 0.8% from last week and just 0.9% below the $1,580,000 recorded at this same point in 2025. This is the narrowest year-over-year price gap in months. In early June the gap was negative 7.7%, and it has steadily narrowed through the summer. Prices are holding meaningfully better than the volume data alone would suggest. Closed sales came in at 98, down 3.0% year over year from the 101 recorded during the comparable week in 2025.
🔍 The Big Picture — What This All Means
With the holiday noise behind us, the underlying picture is clearer. Inventory continues to grow, hitting another 2026 high this week and confirming that the seasonal peak has not yet arrived. Pending sales sit meaningfully below year-ago levels but not in freefall. MOI on a trailing five-week basis is essentially at the boundary between balanced and buyer-favored. And notably, prices have held better than the volume data would suggest, with the year-over-year median gap narrowing to less than one percent. What this all means is that the market has retained real activity and pricing discipline throughout an environment of elevated inventory and softer demand, but is sitting on a knife edge between balanced and buyer-favored territory. Sellers who price accurately are still transacting. Buyers who are prepared and pre-approved have the widest selection of the year. The next two to three weeks will show whether inventory finally peaks and how pending sales trend as we move deeper into summer.🏠 For Sellers
Pricing discipline remains the most critical decision you will make this summer. This week's data confirms what we have been building toward all season: inventory is at a new 2026 high, demand is running 12 to 15 percent below last year, and MOI is sitting at the edge of the boundary between balanced and buyer-favored territory. The one positive signal for sellers is the resilience of pricing itself. The 30-day median is only 0.9 percent below where it stood a year ago, meaningfully better than the volume picture would suggest. That price resilience depends on discipline. Homes priced accurately against today's comparable sales are still selling. Homes priced against last spring are not. Sellers who are accurately priced and in the market now continue to have the best opportunity of the summer. We have done extensive analysis on what this shift means for sellers in each Eastside sub-market and would welcome the opportunity to walk you through what the data shows for your specific area and home.🔑 For Buyers
Buyers today continue to have more negotiating leverage for this time of year than at any point since 2011. This week's data confirms the buyer opportunity: active listings at a new 2026 high of 1,855, meaning the widest selection window of the year is here now. Pending sales at 120 confirm that qualified buyers are transacting, and price resilience shows that the best homes are still holding their value. With rates at 6.64%, updating your pre-approval at current levels remains an essential first step. The market has real activity, so being prepared to move quickly on the right property matters.
If we can help you think through what this means for your move, we are here.
Tony Meier & Team — Windermere Real Estate / NE, Kirkland, WA