WESTERN WASHINGTON ECONOMIC OVERVIEW
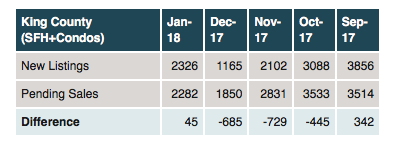
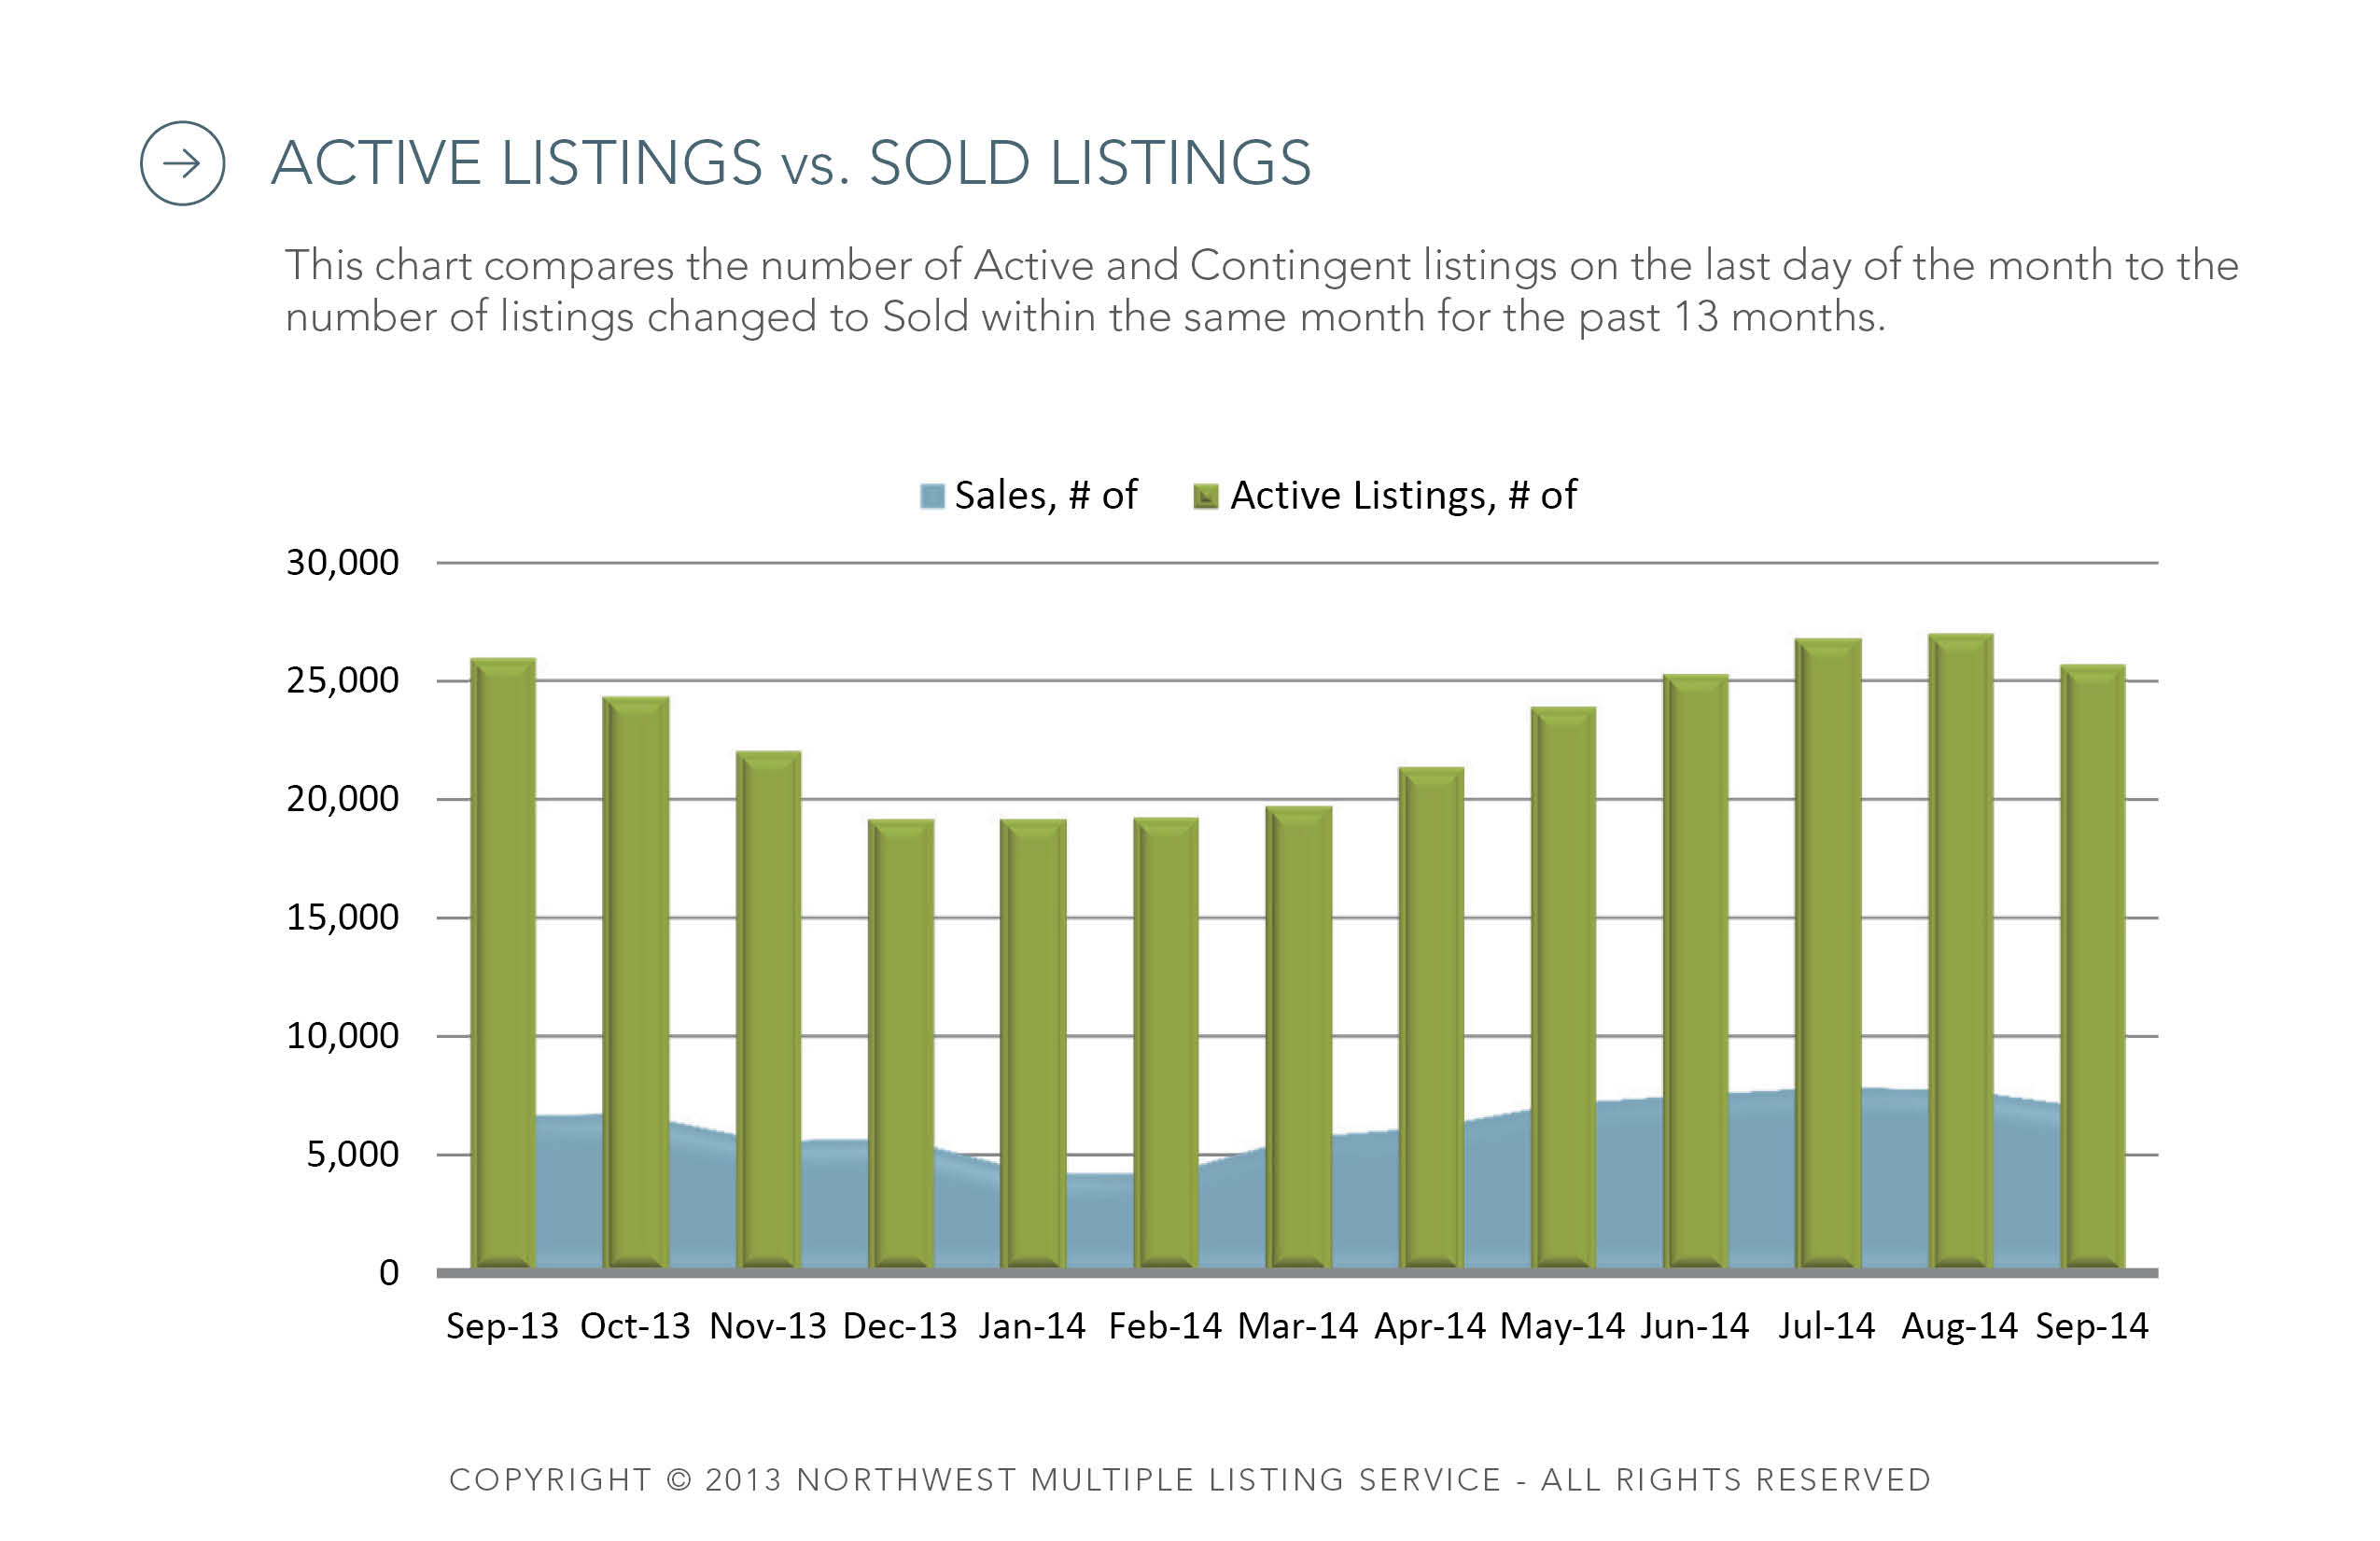
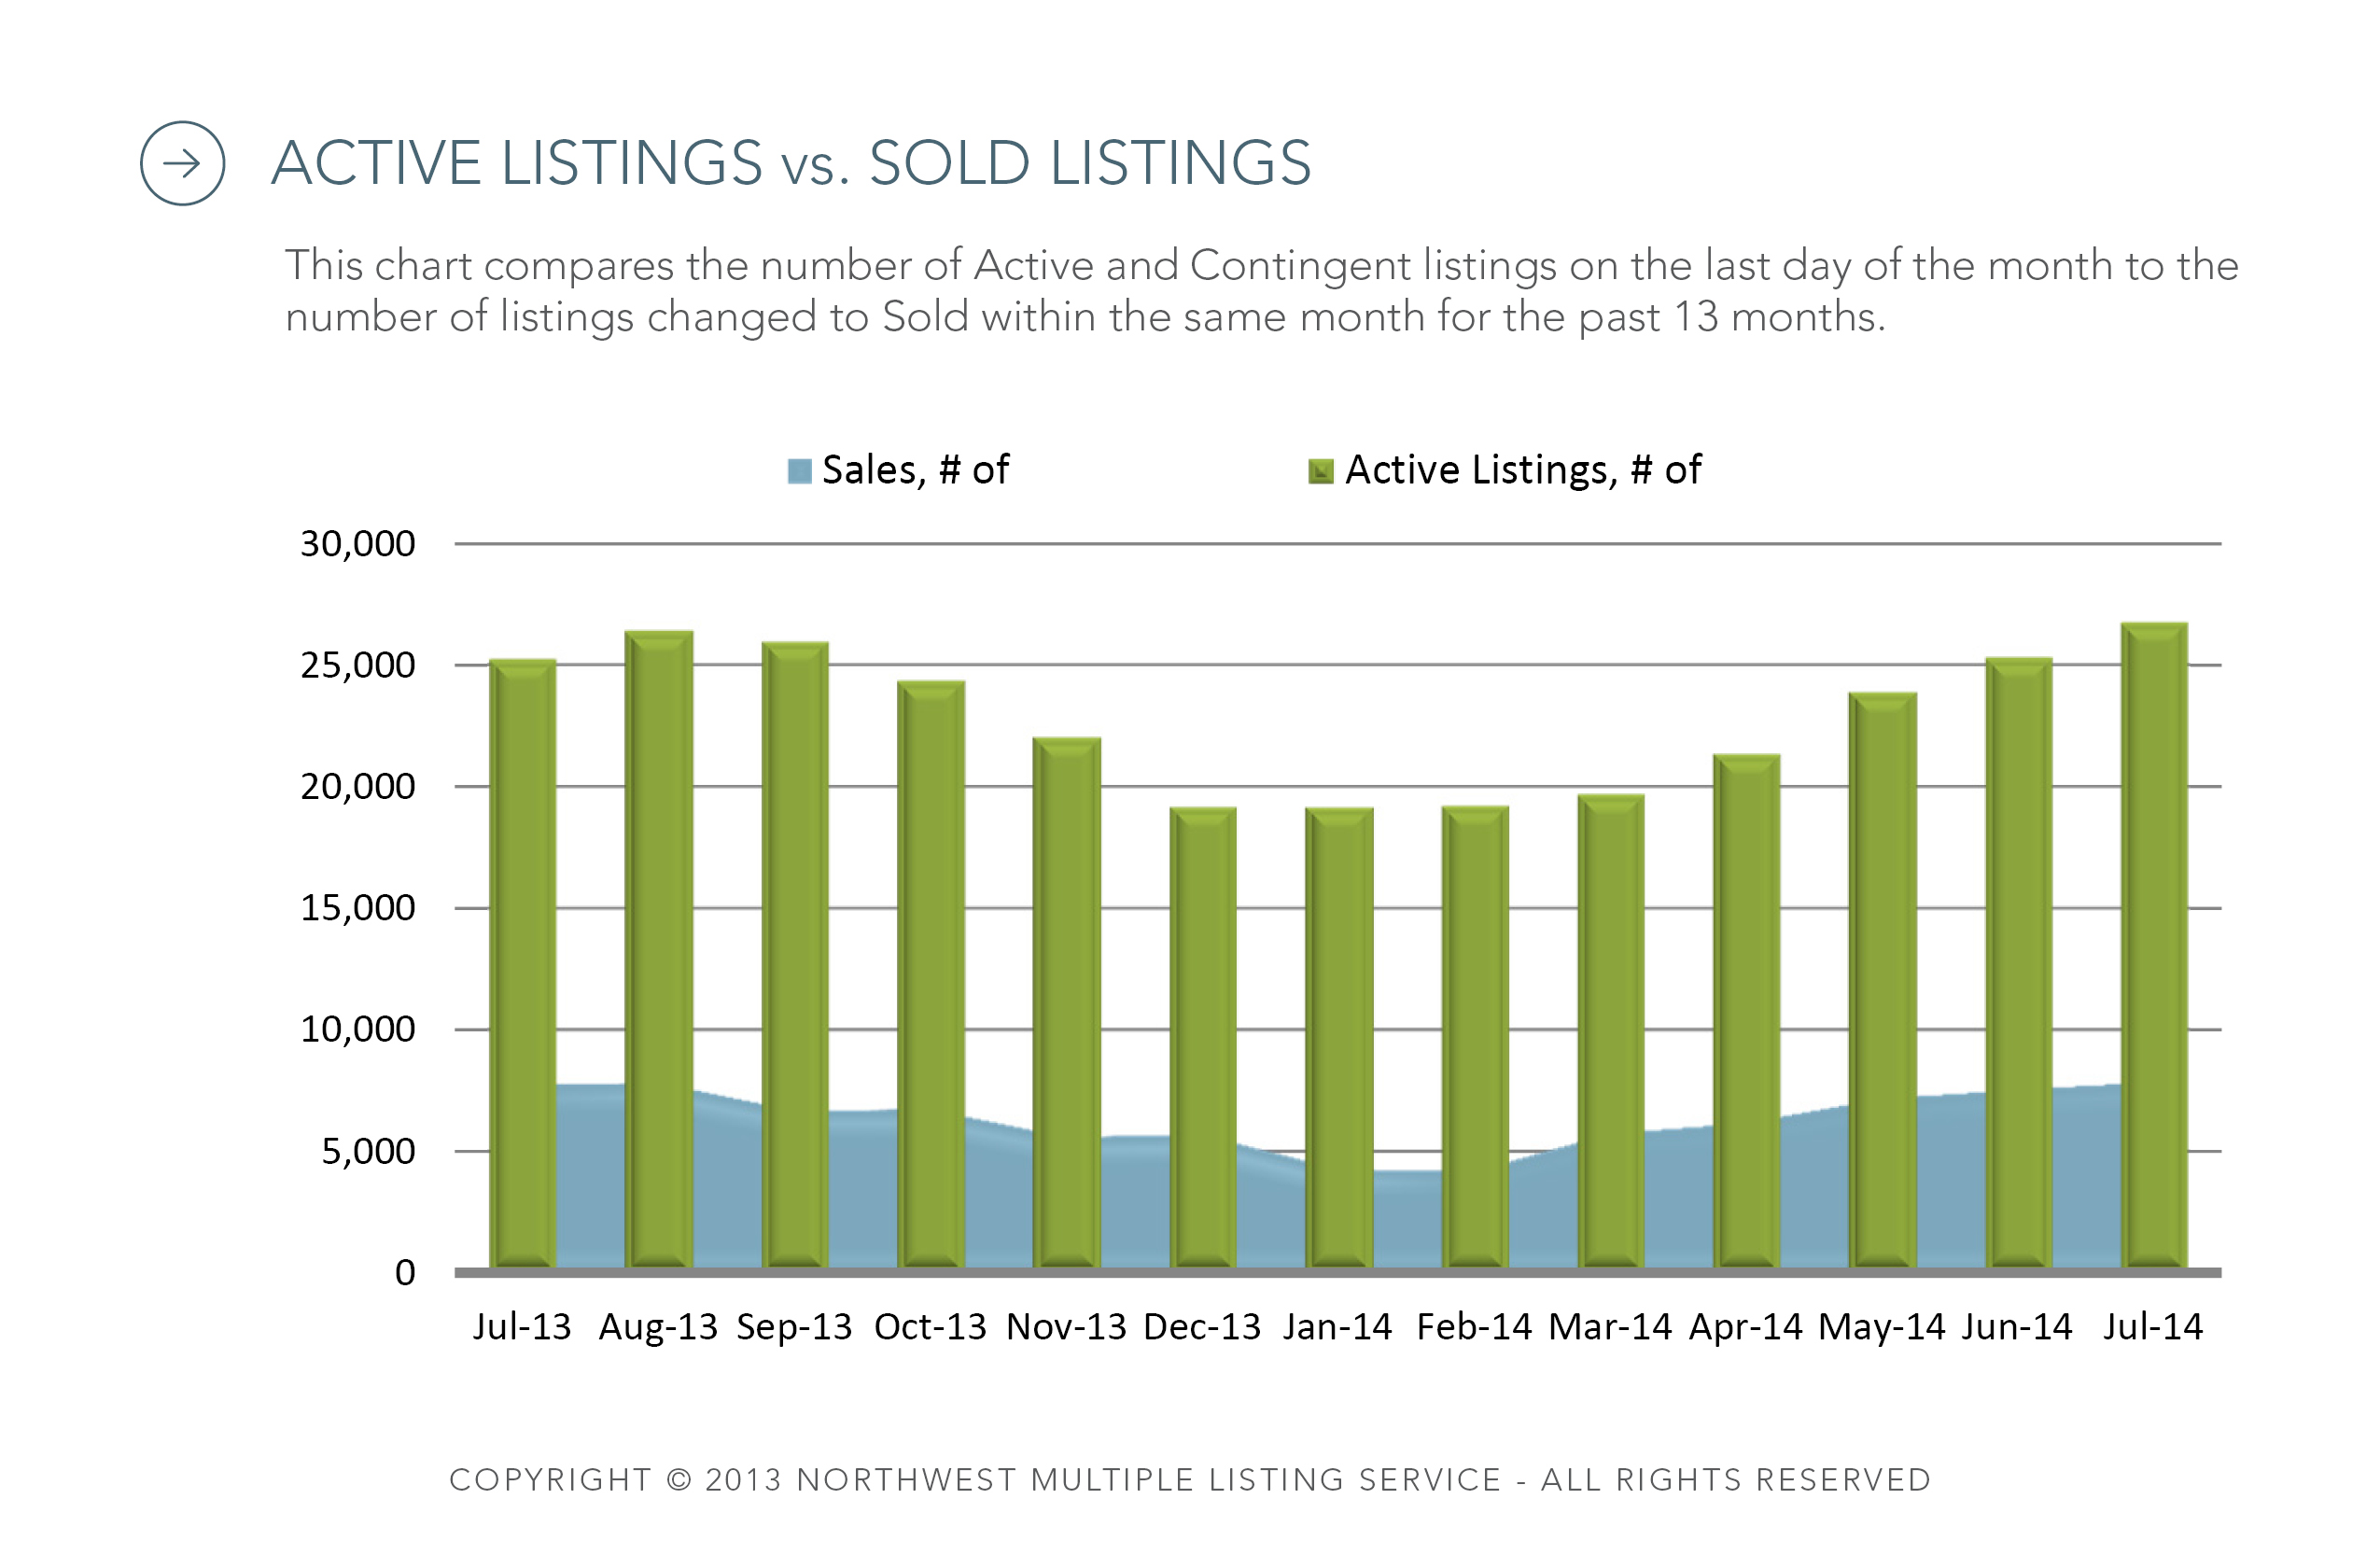
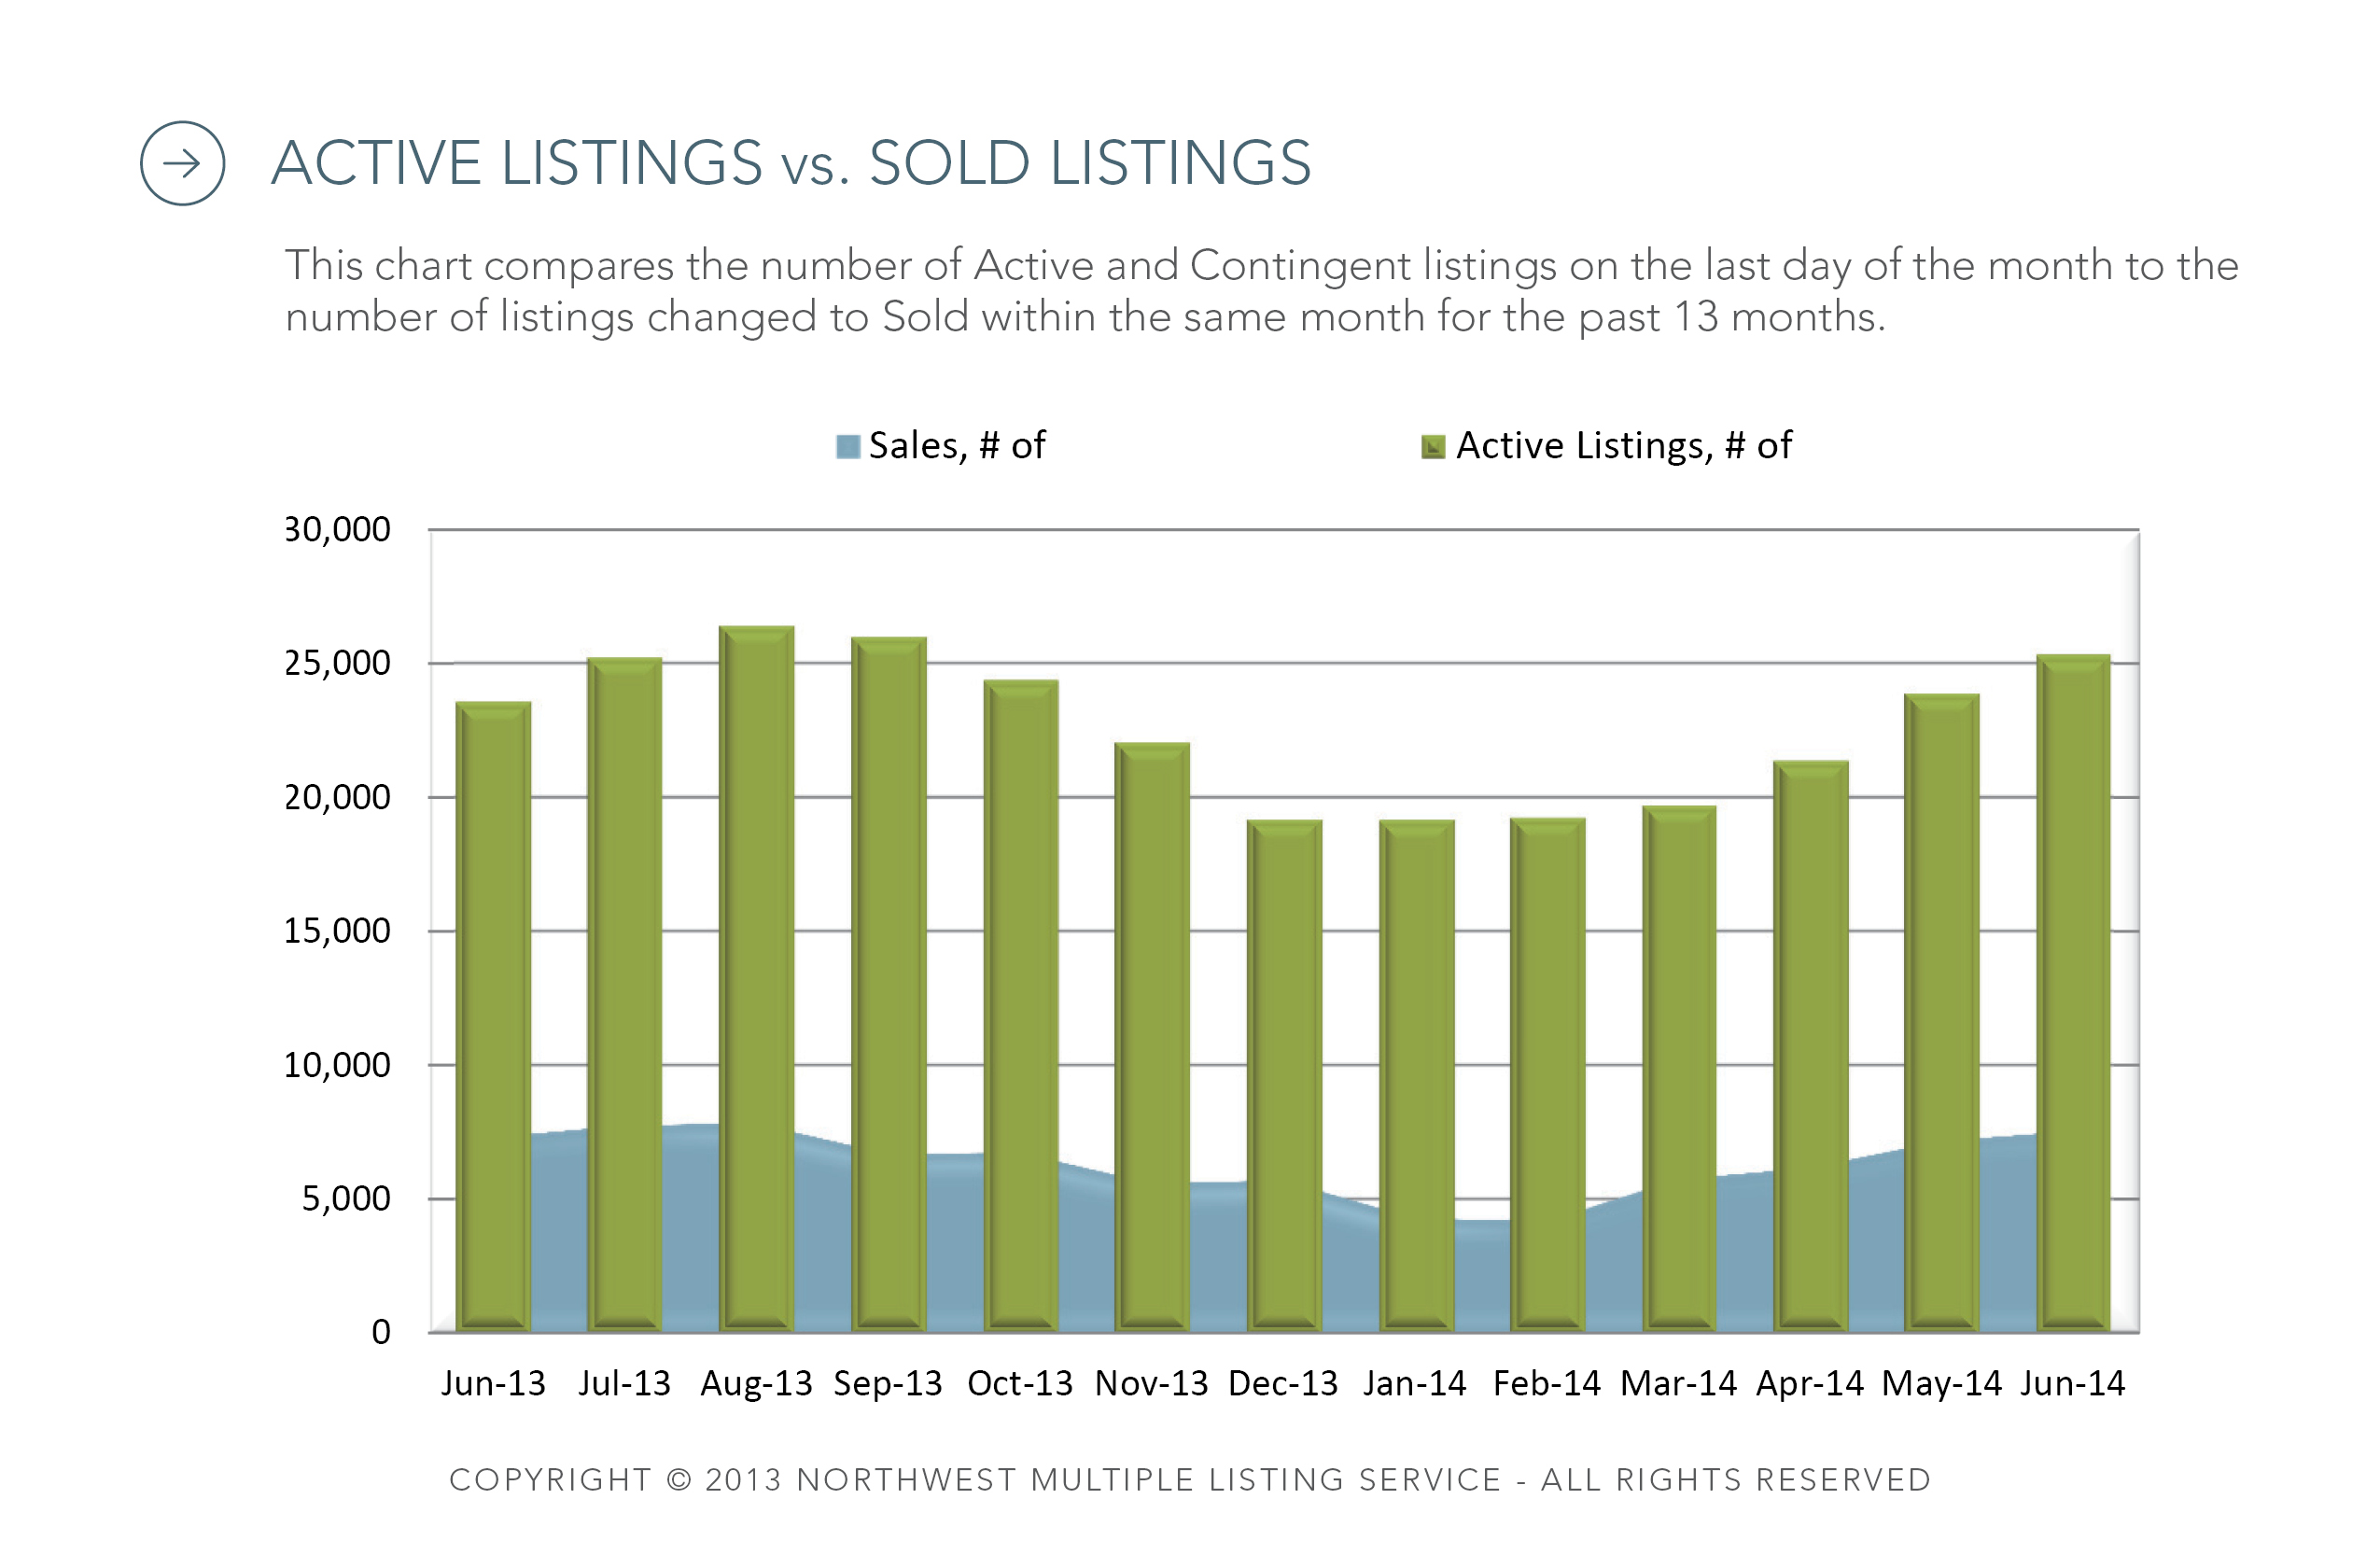
WESTERN WASHINGTON HOME SALES
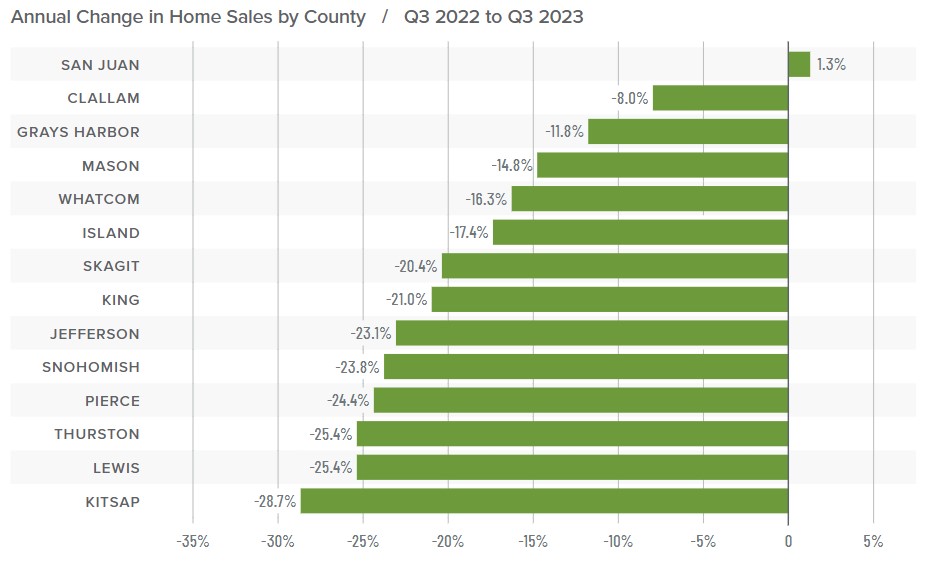
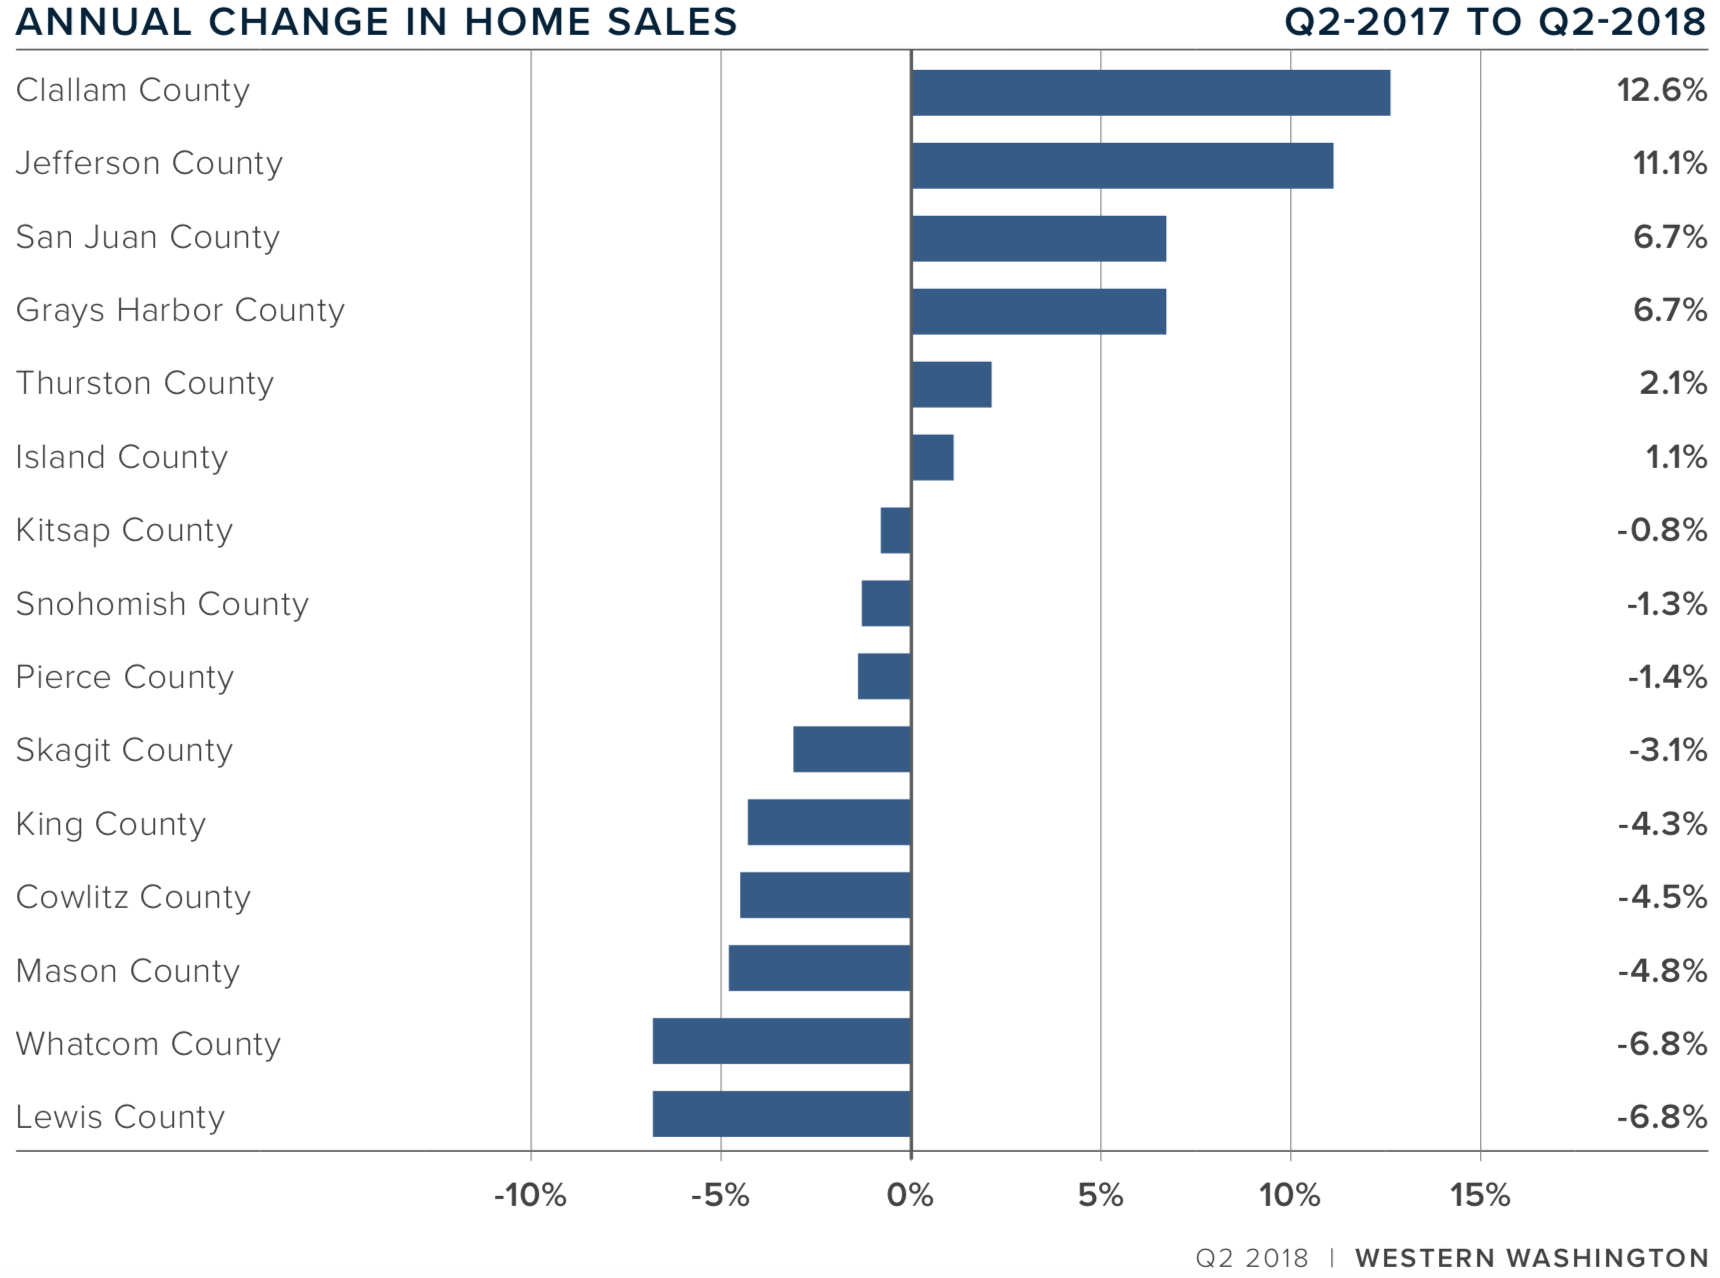
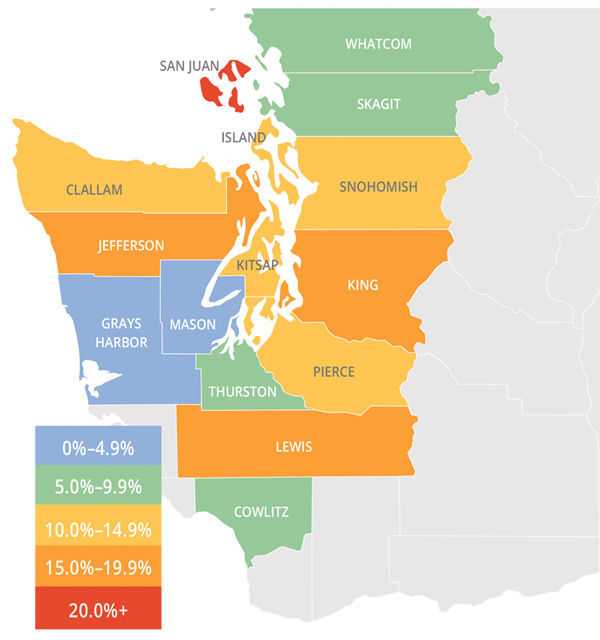
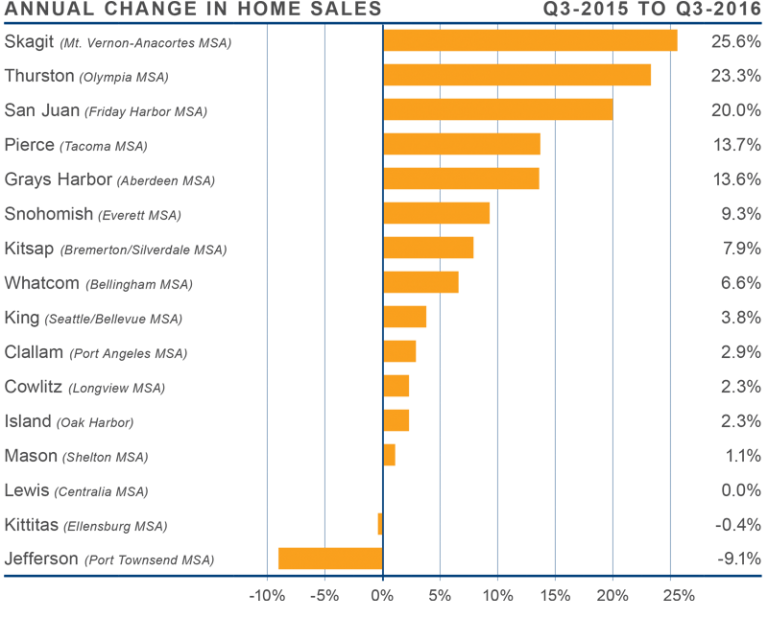
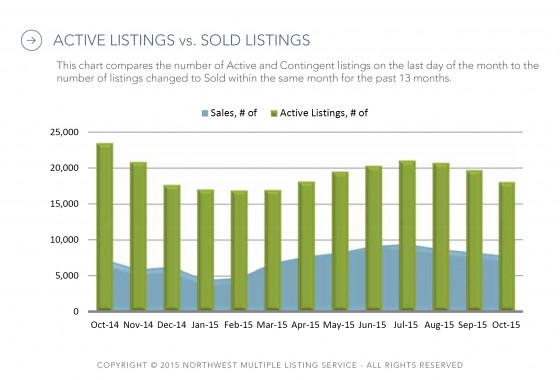
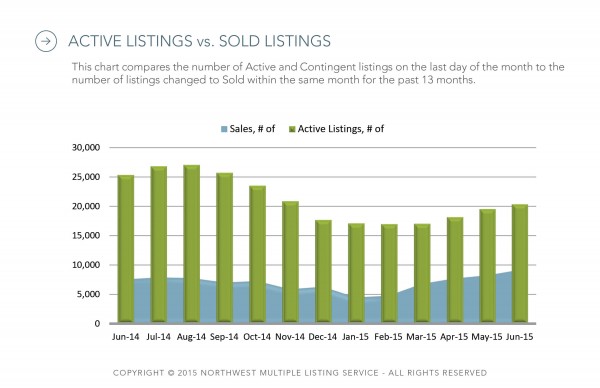
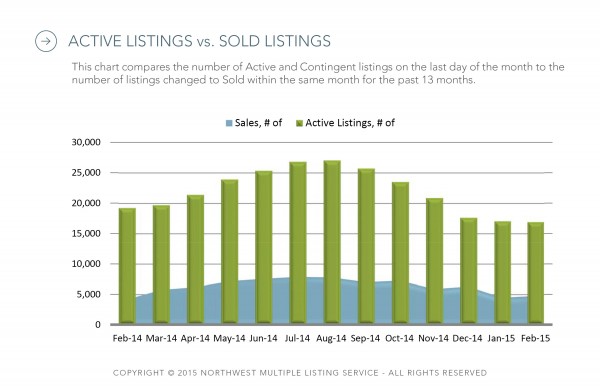
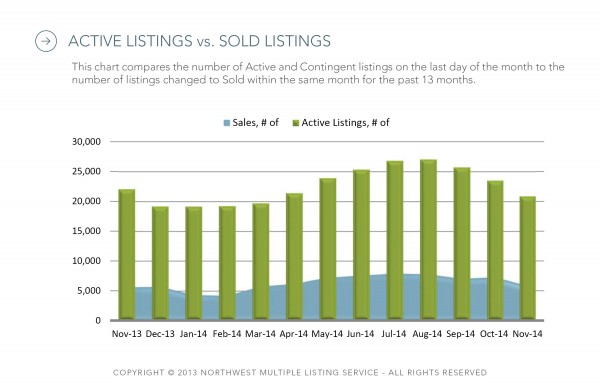
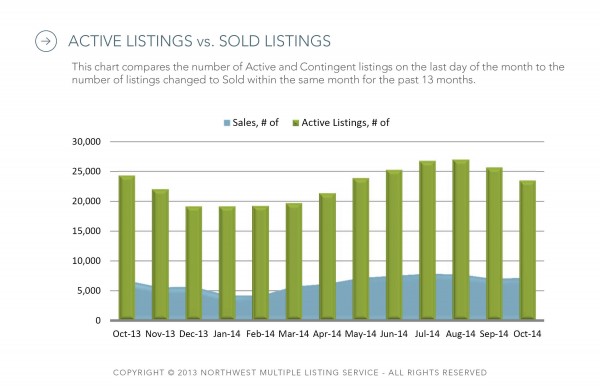
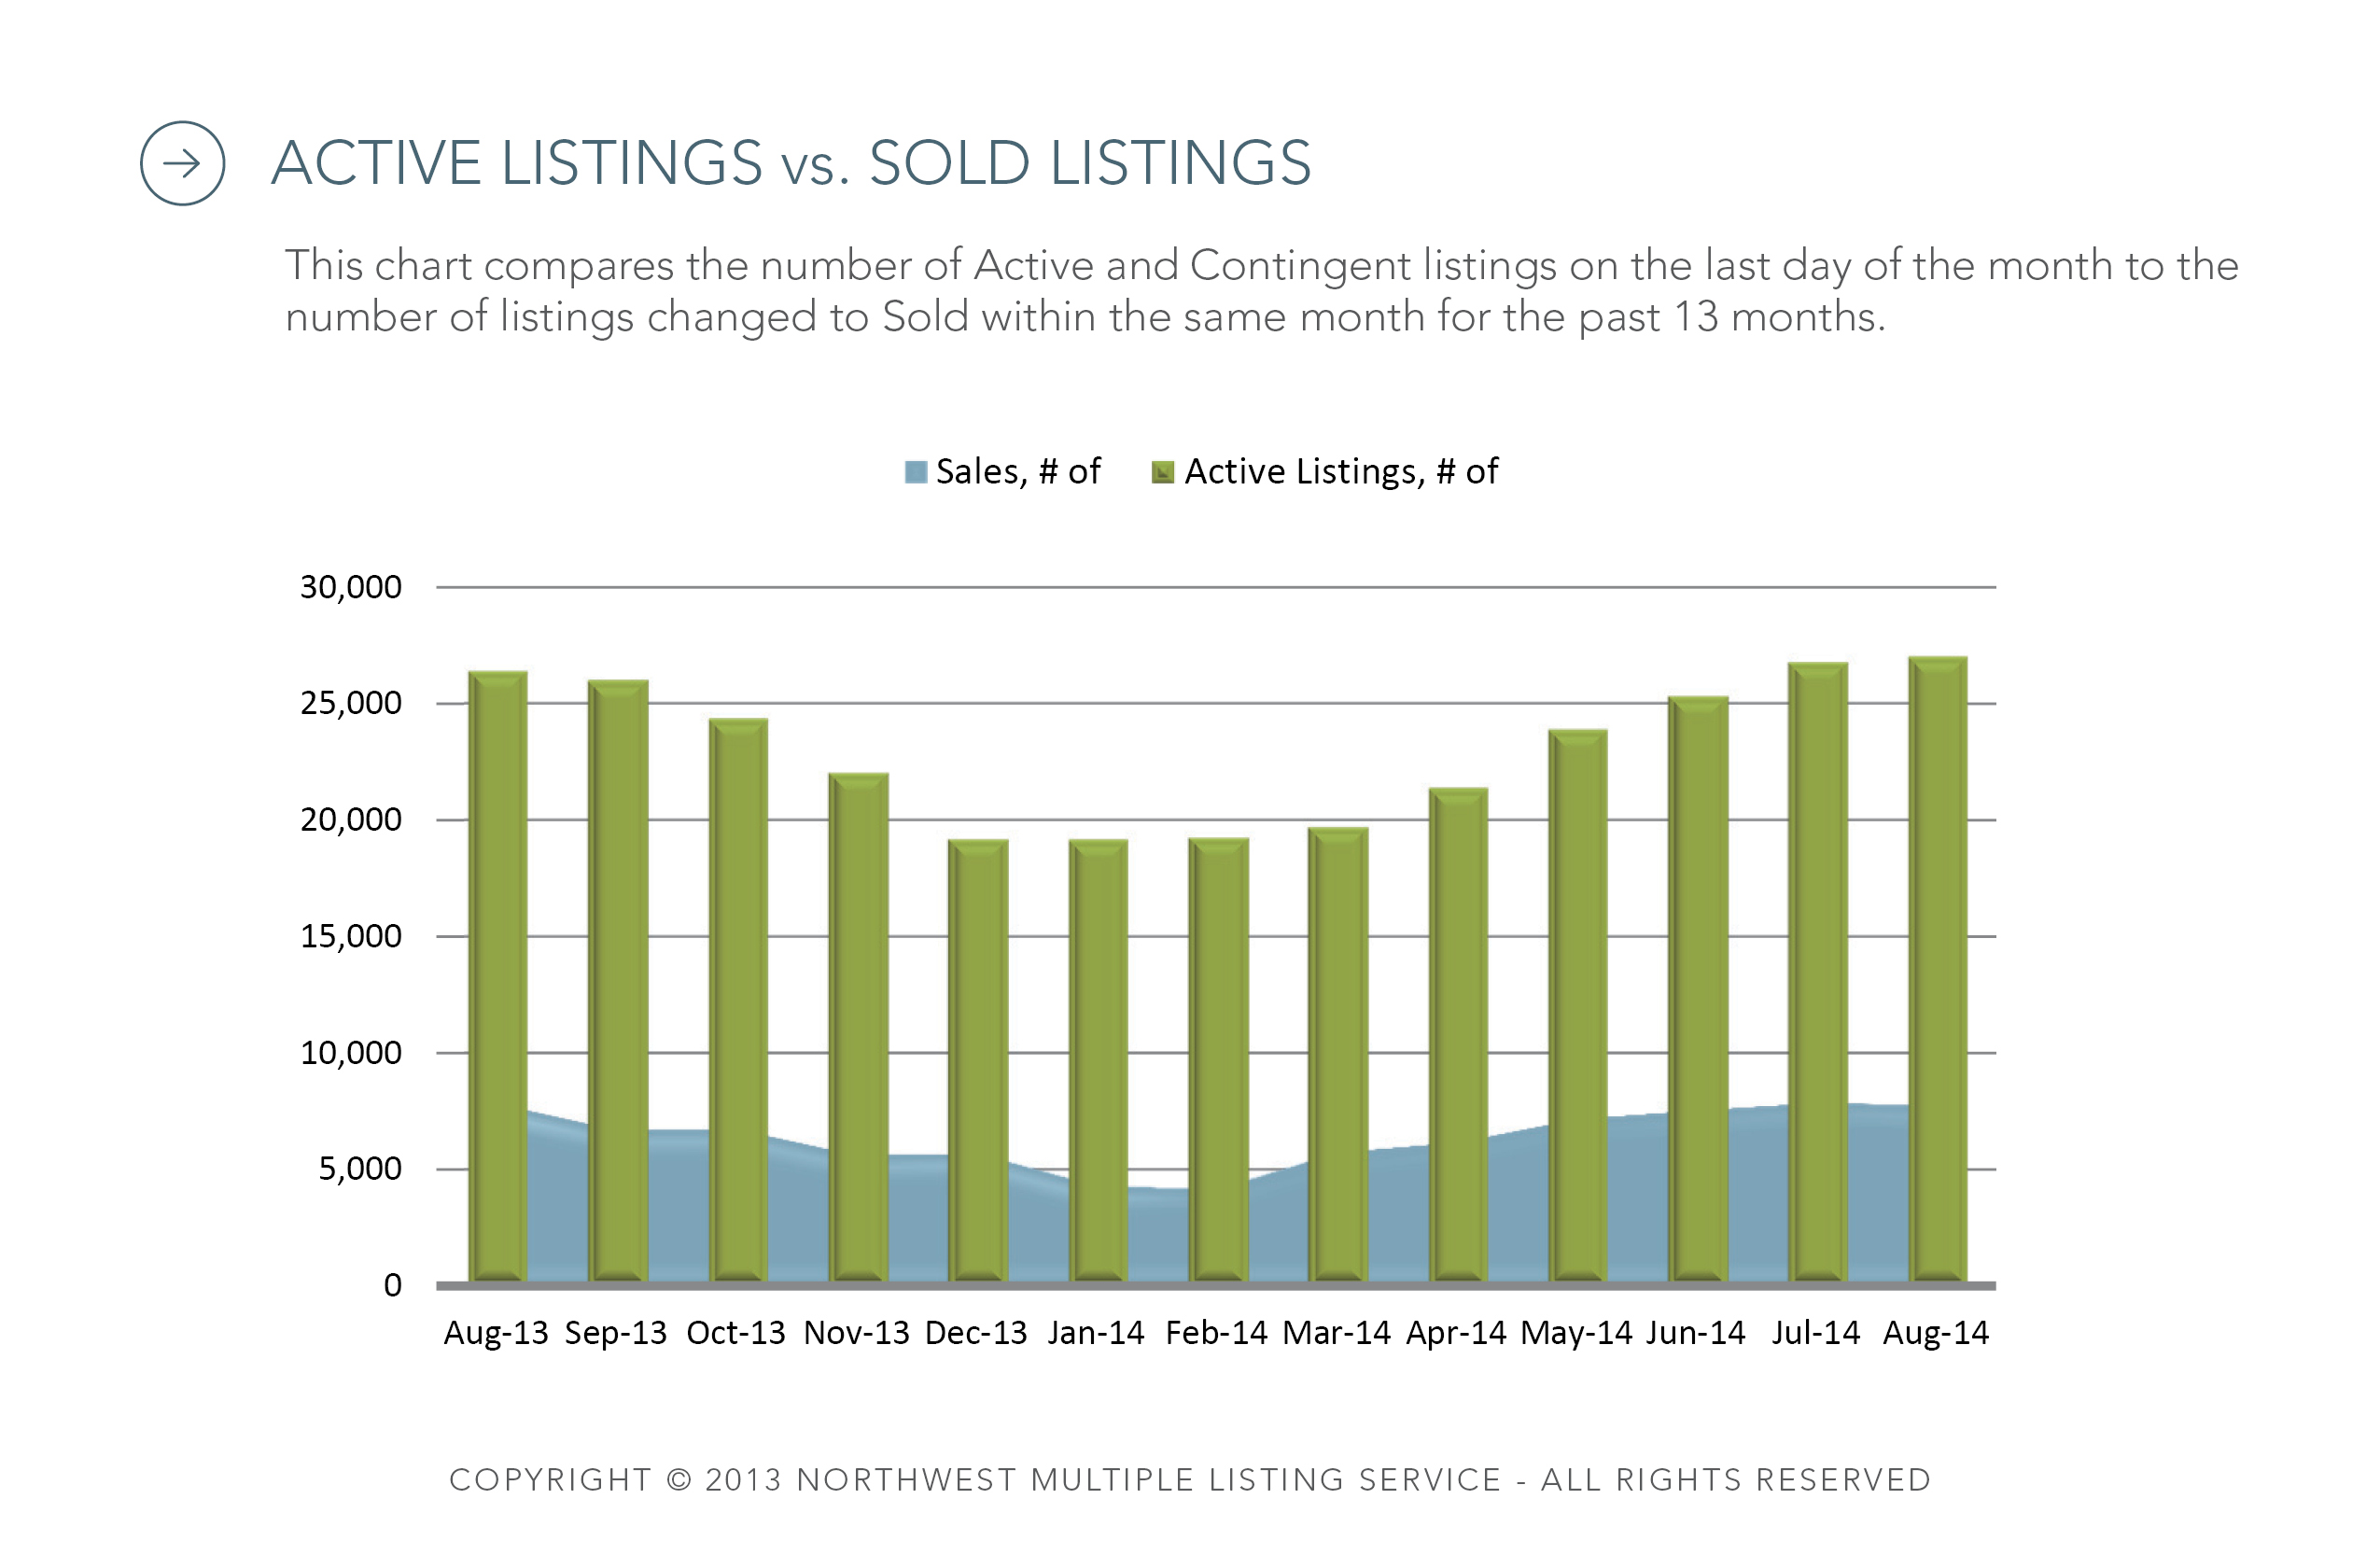
❱ Sales fell even as the average number of homes for sale increased 29.5% from the second quarter. This is clearly a sign that significantly higher mortgage rates are having an impact on the market.
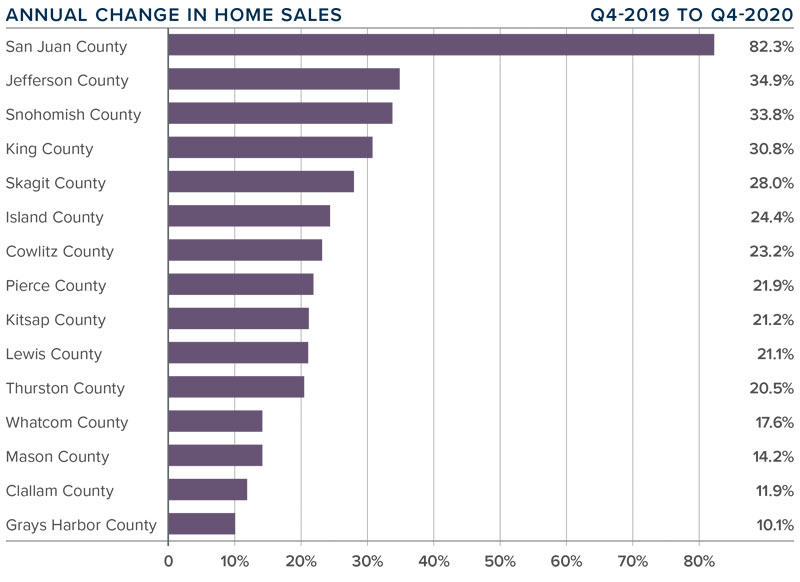
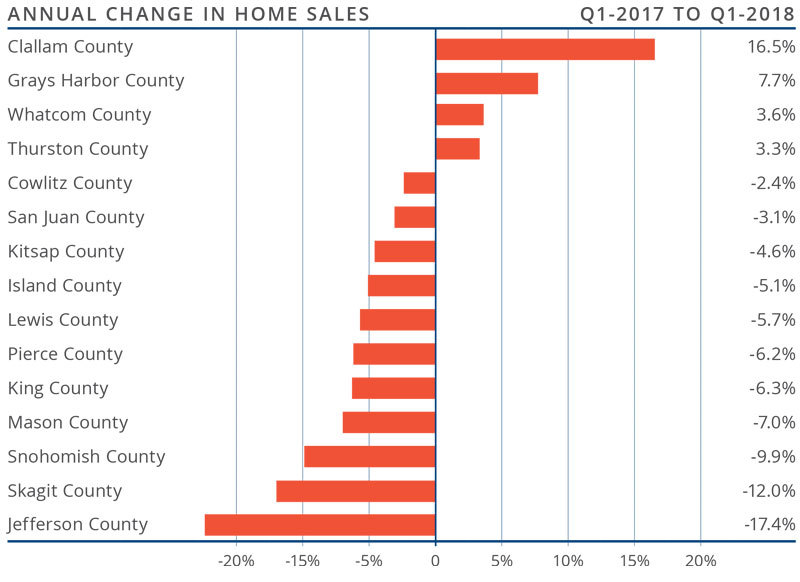
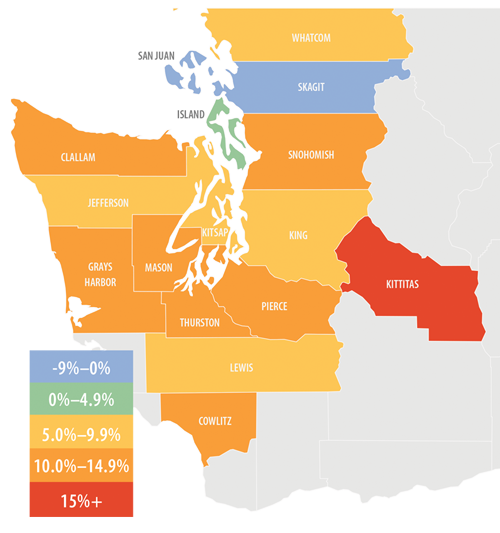
❱ Sales fell in all counties except San Juan compared to the third quarter of 2022. They were up in 9 of the 14 counties covered in this report compared to the second quarter of 2023. San Juan, Mason, Grays Harbor, and Whatcom counties saw significant increases.
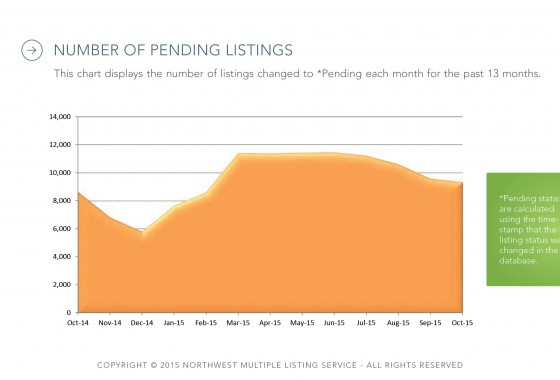
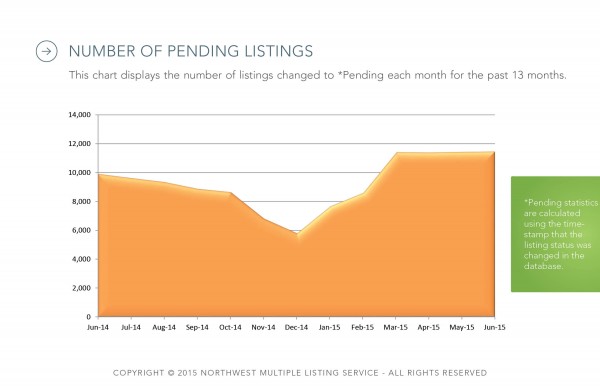
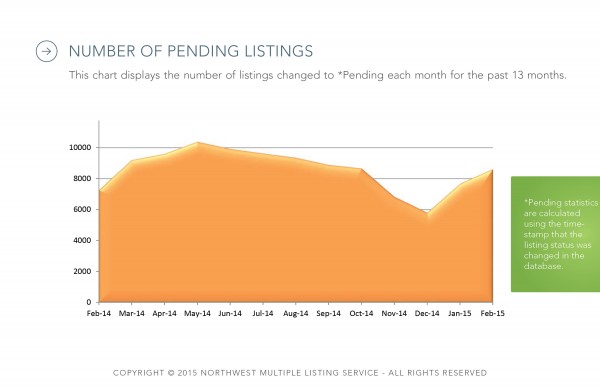
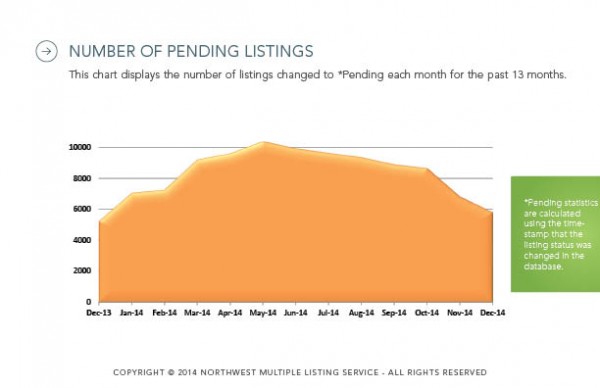
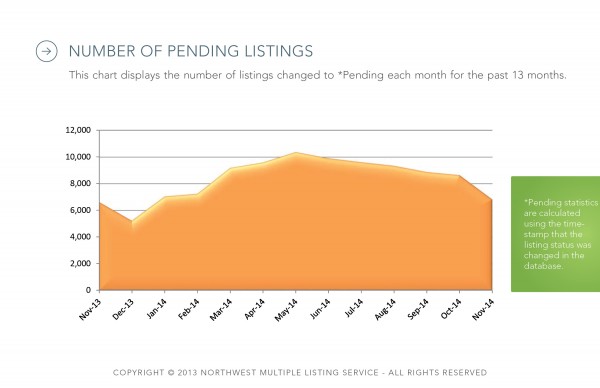
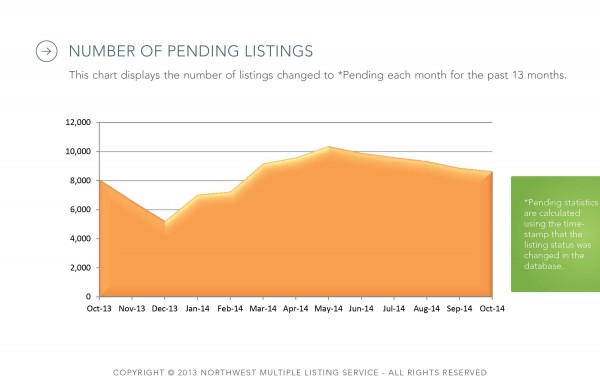
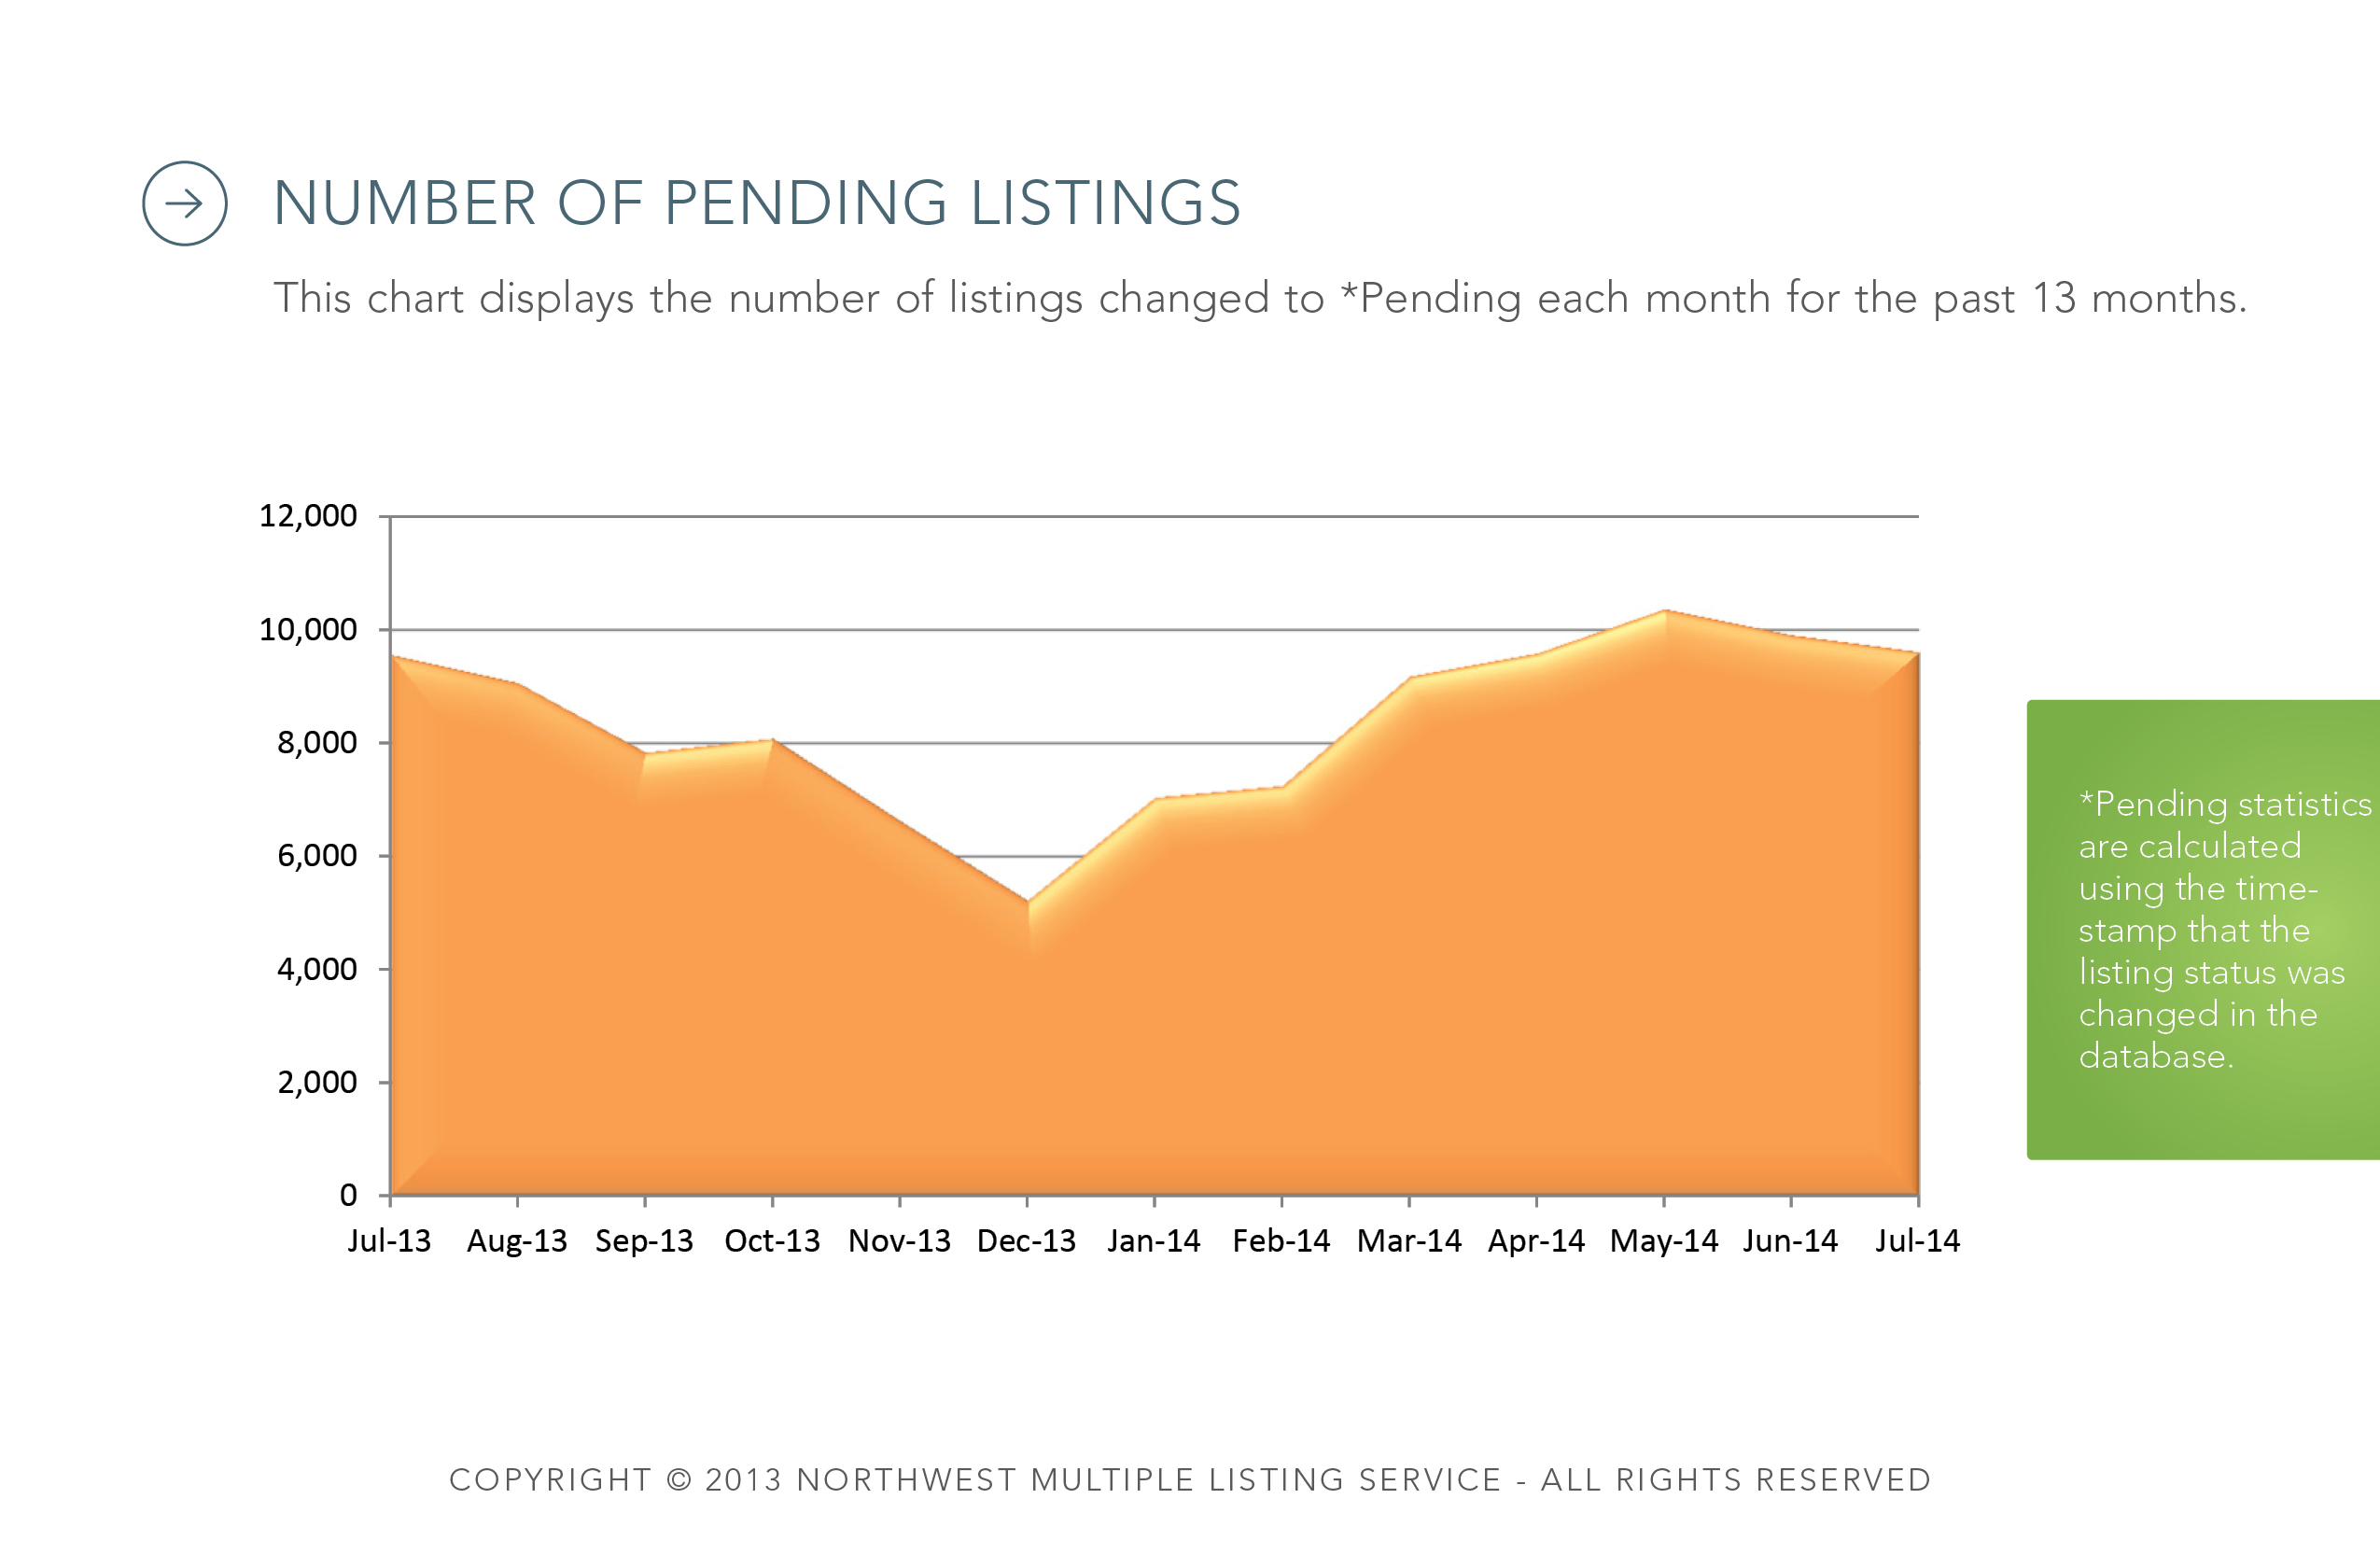
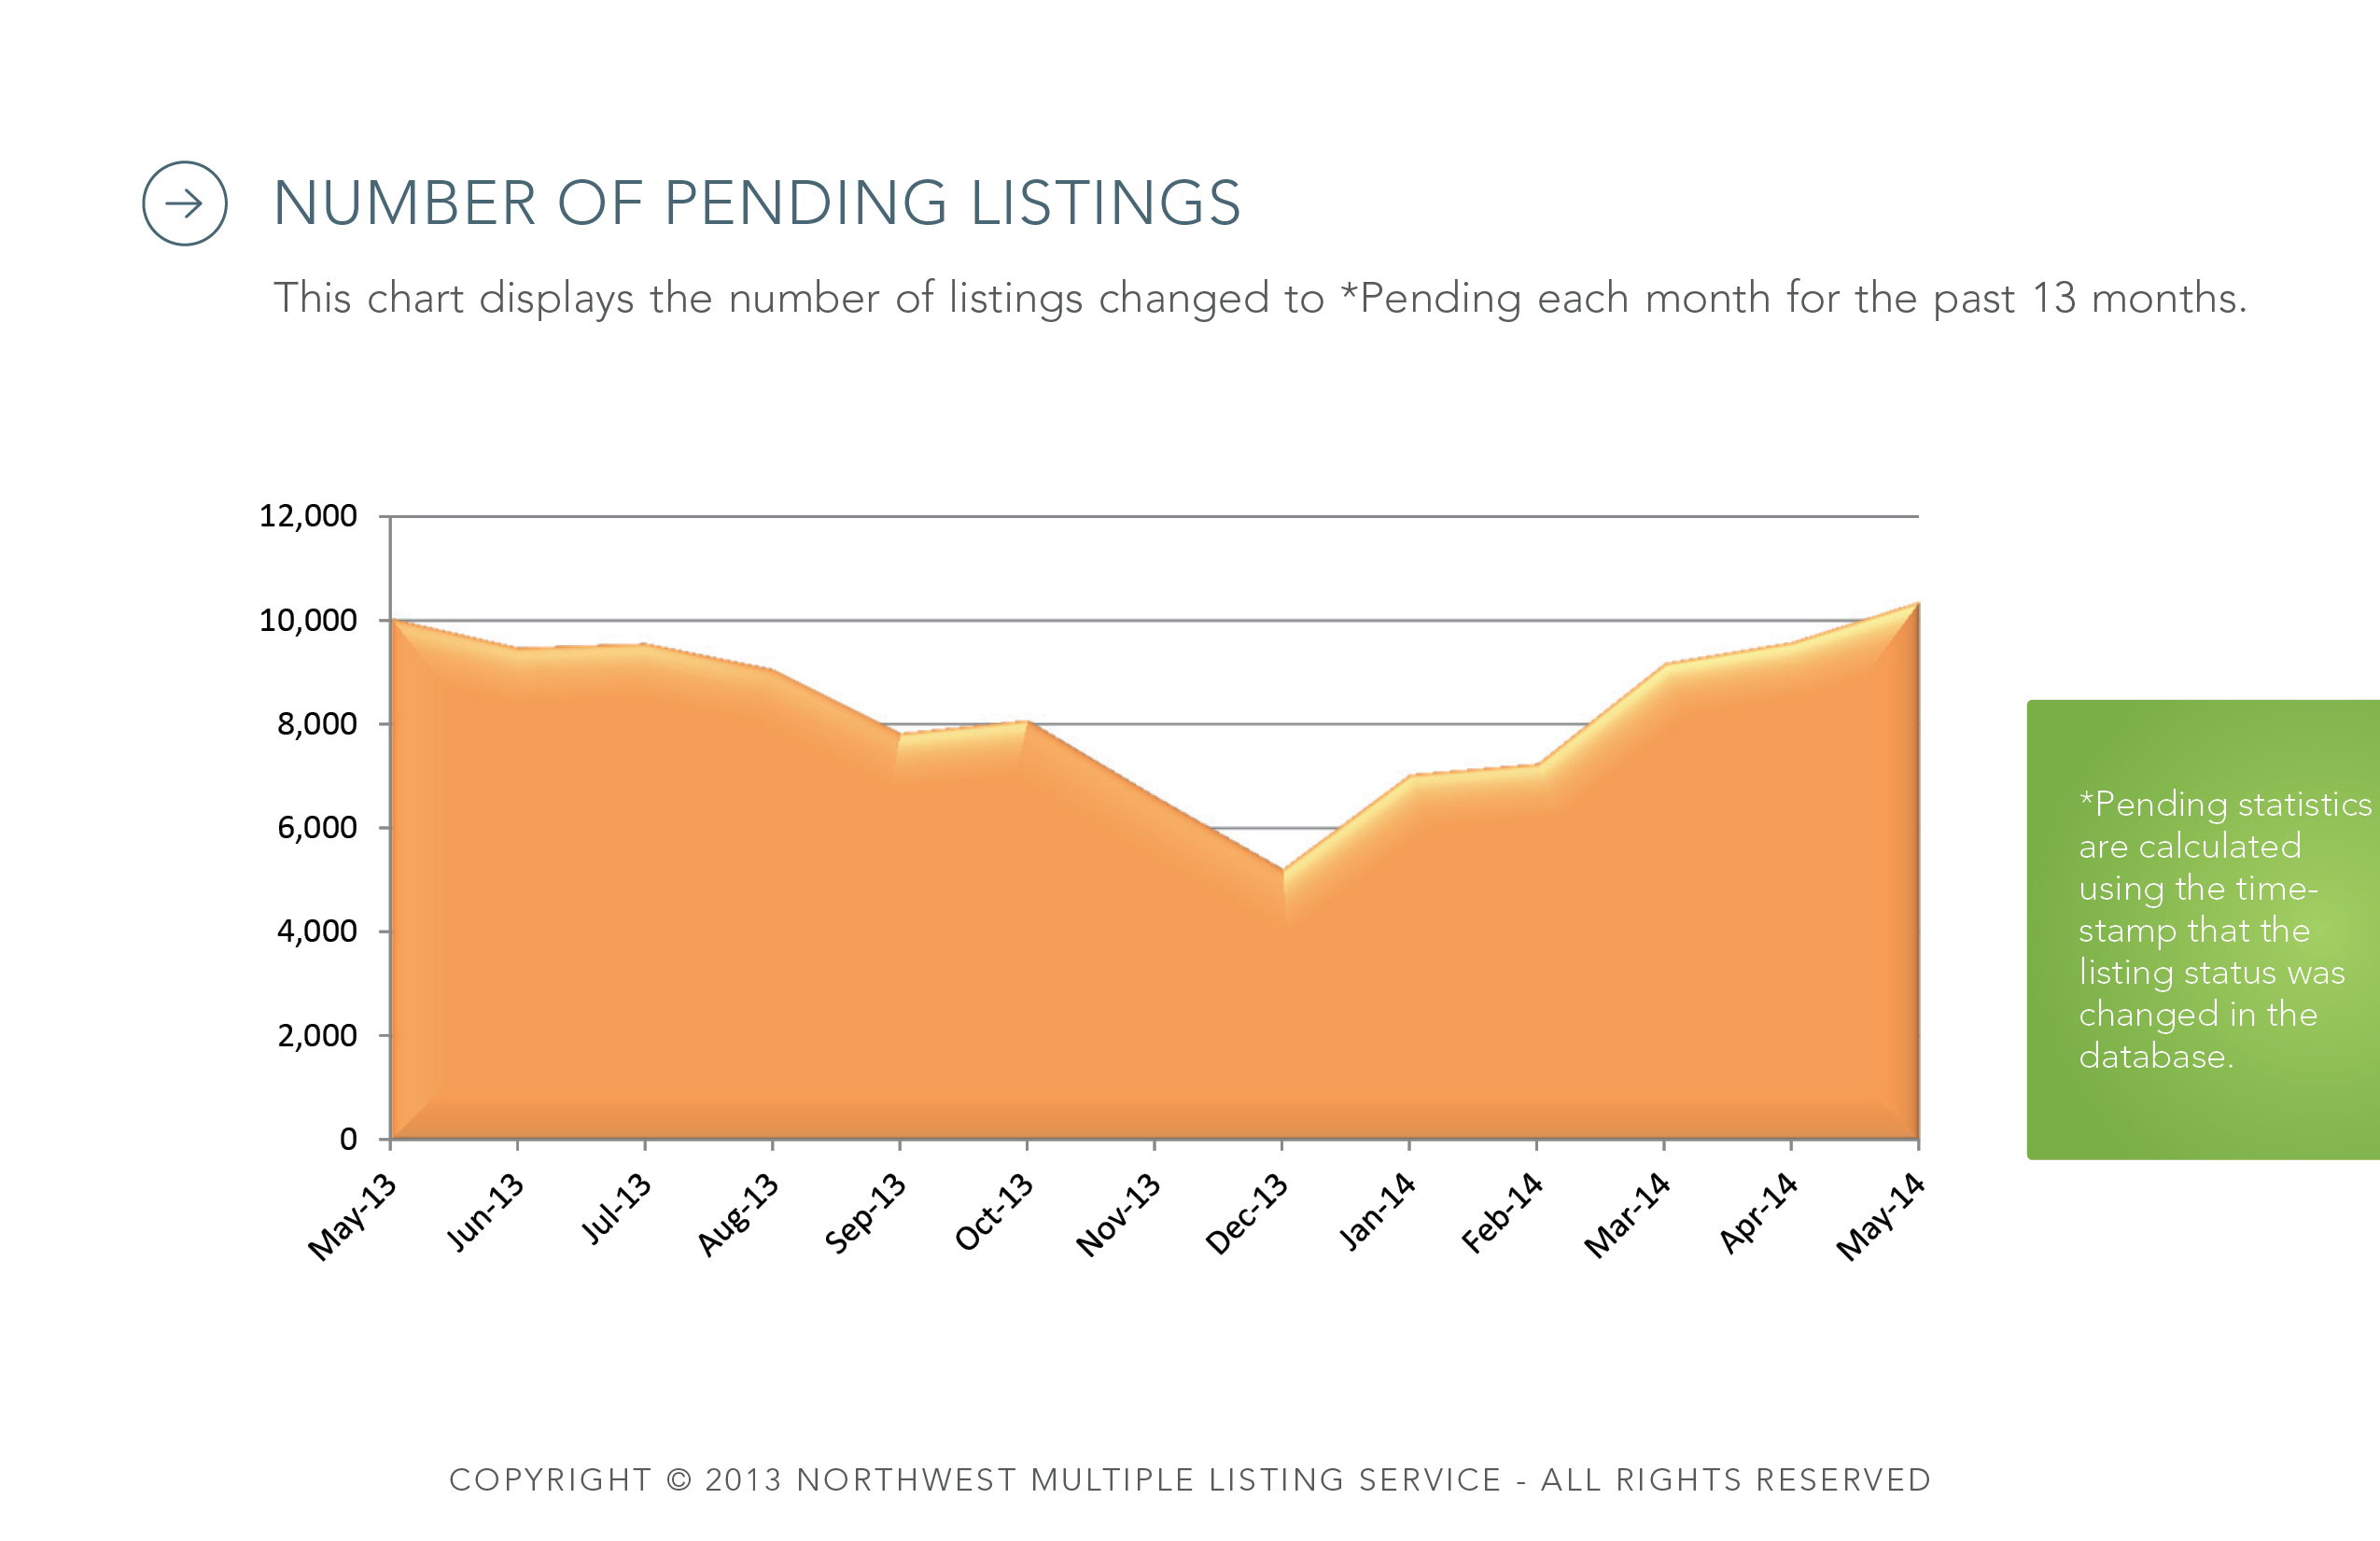
❱ Pending sales fell 6% compared to the second quarter of this year, suggesting that closings in the upcoming quarter may be lackluster unless mortgage rates fall, which I think is highly unlikely.
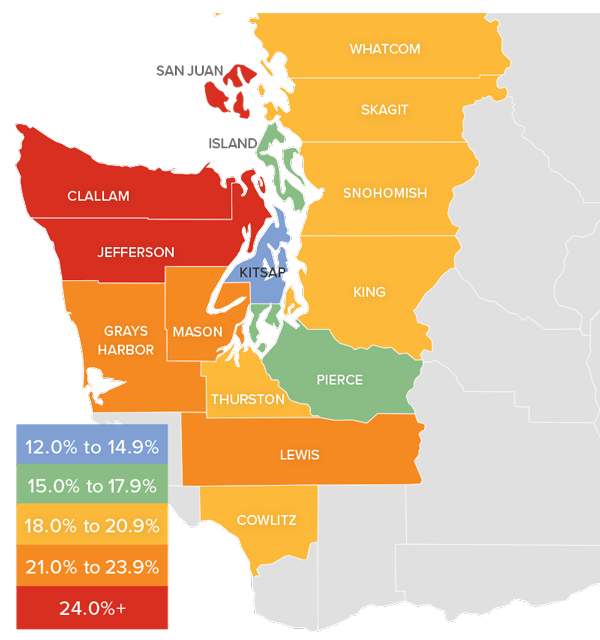
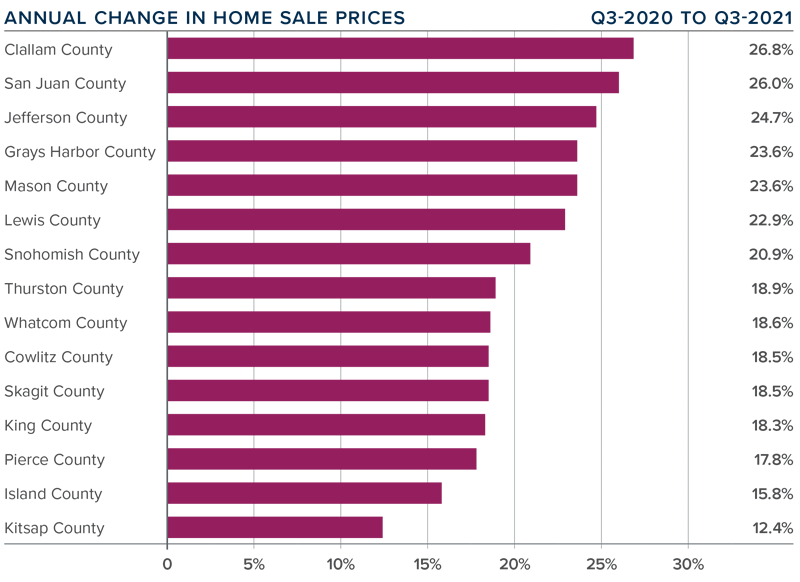
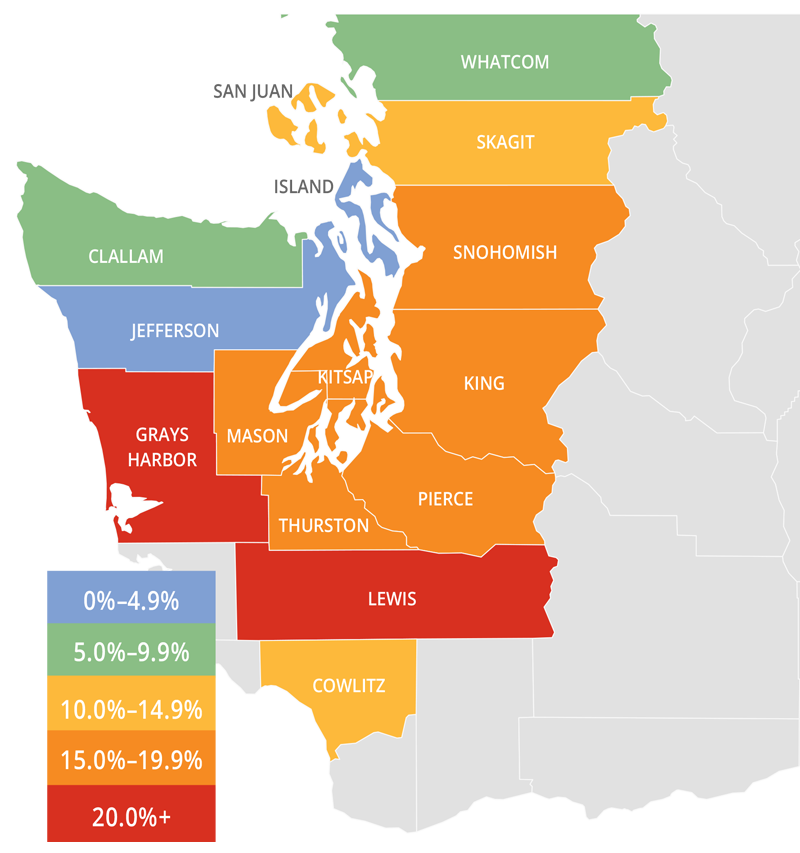
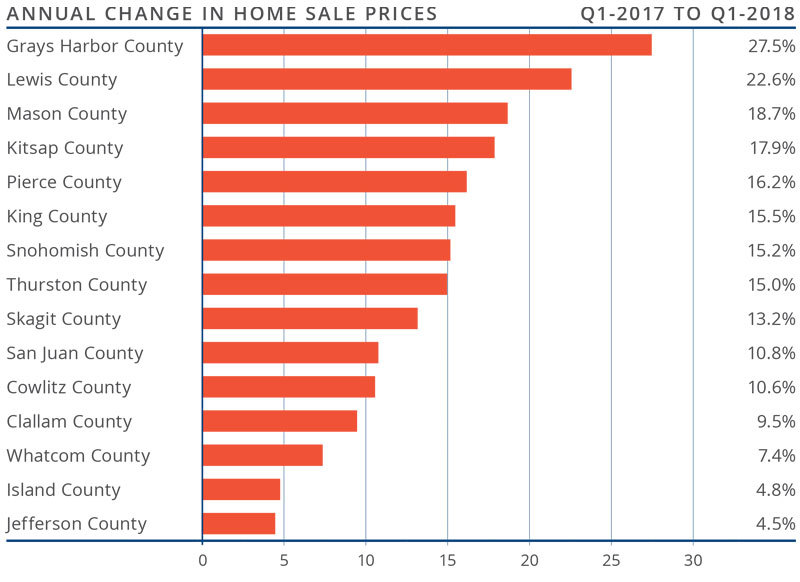
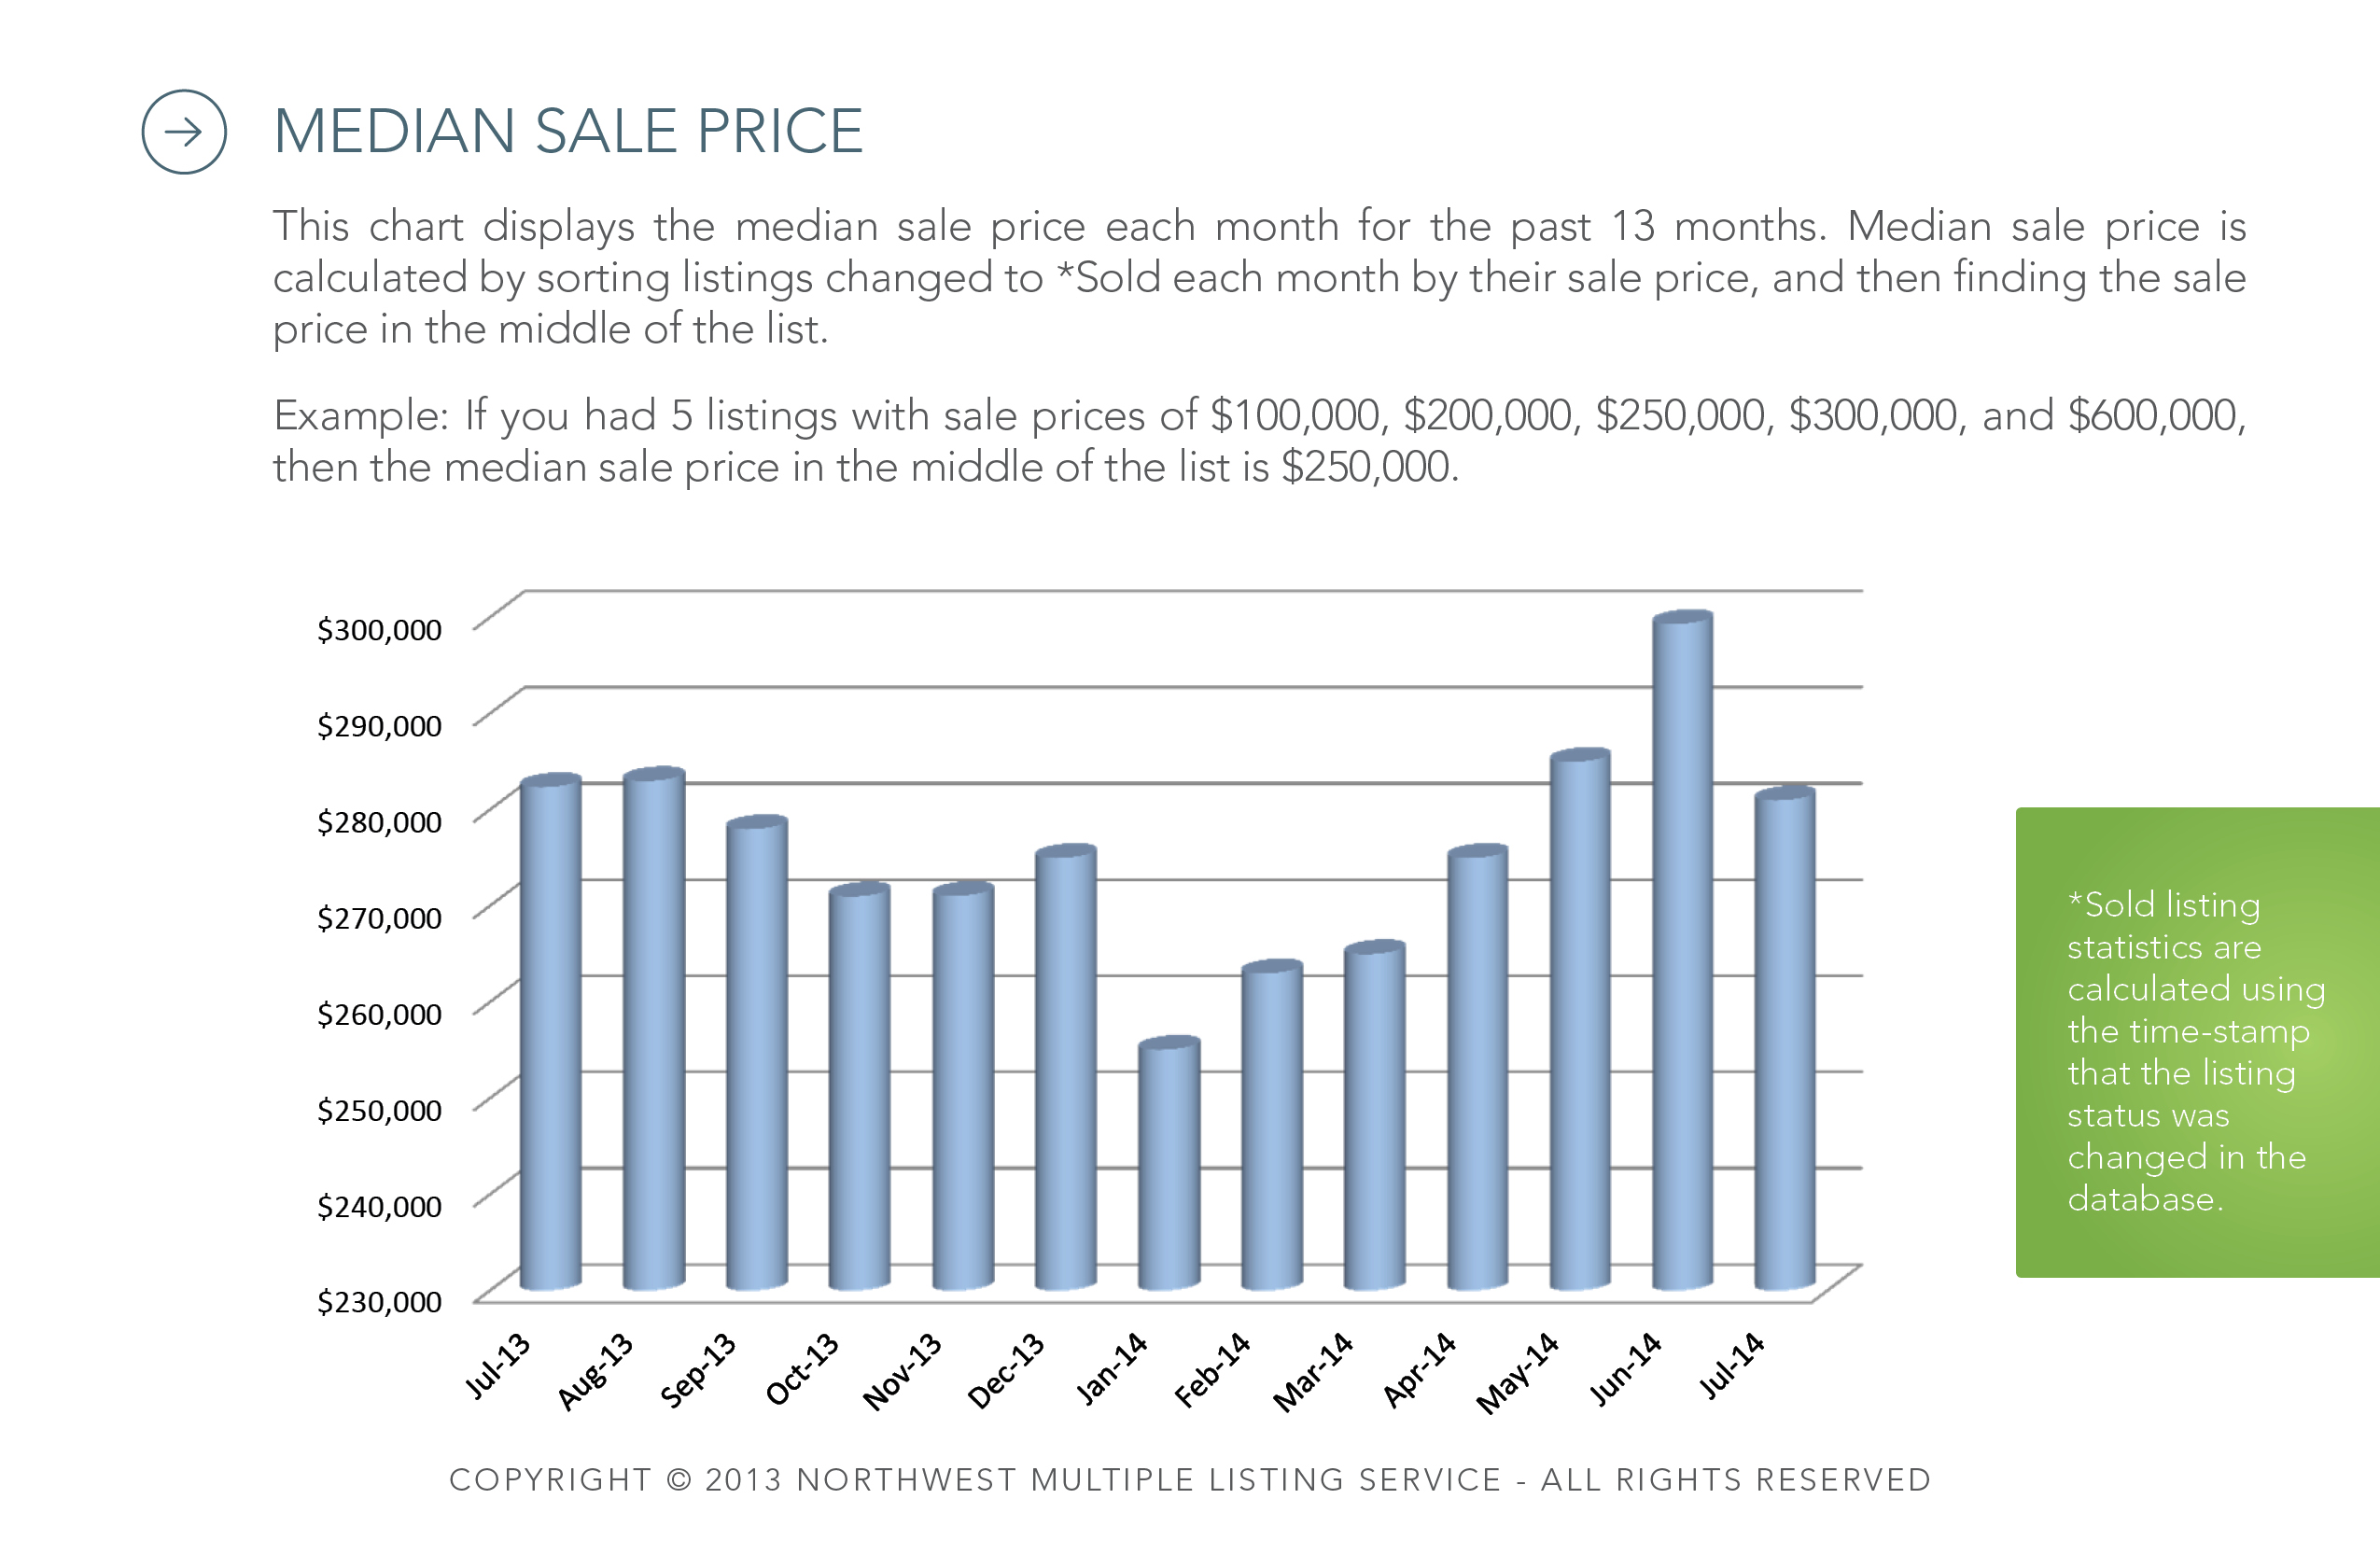
HOME PRICES
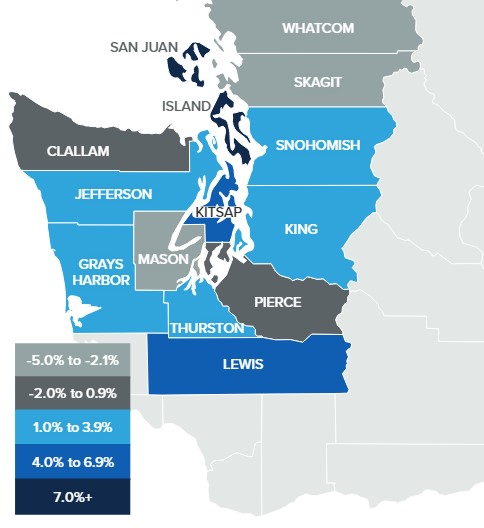
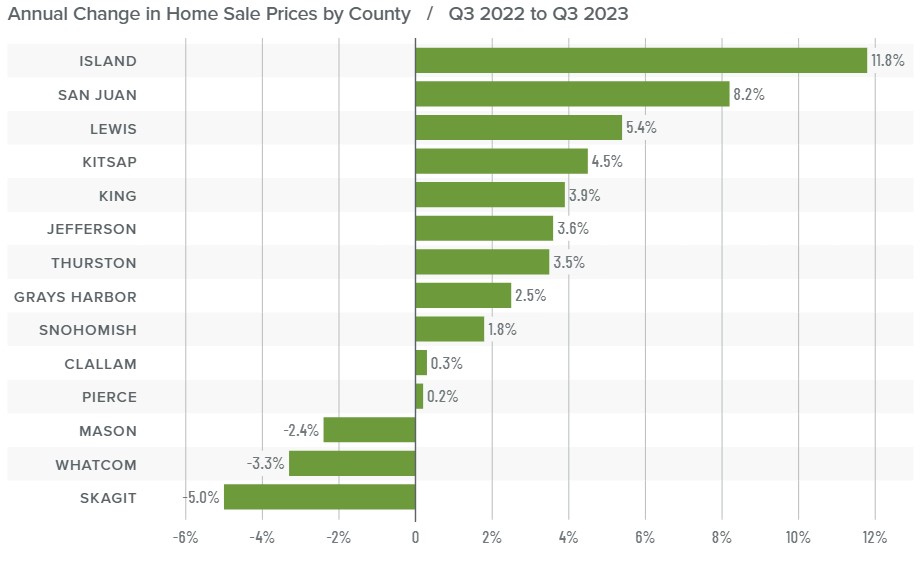
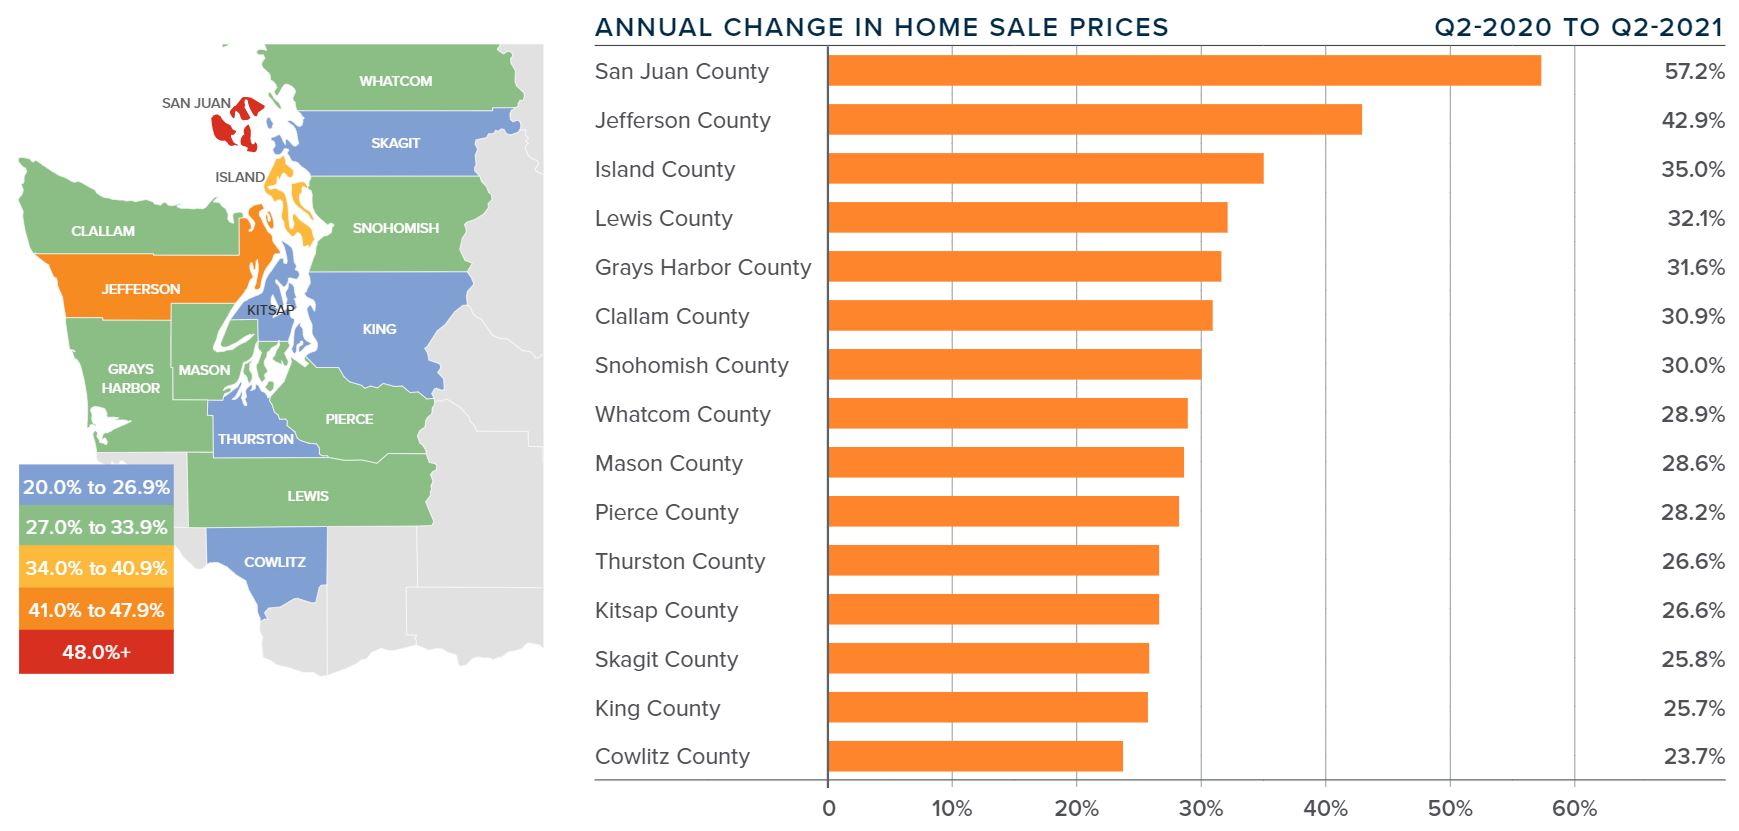
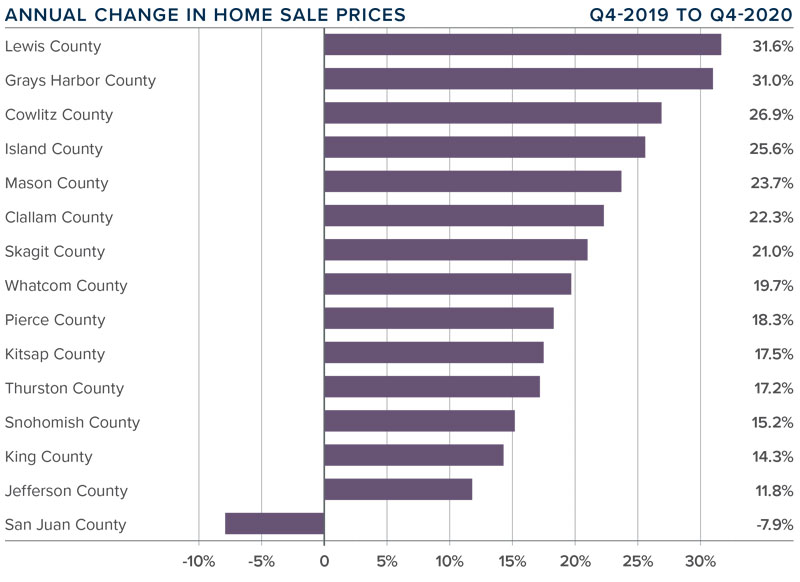
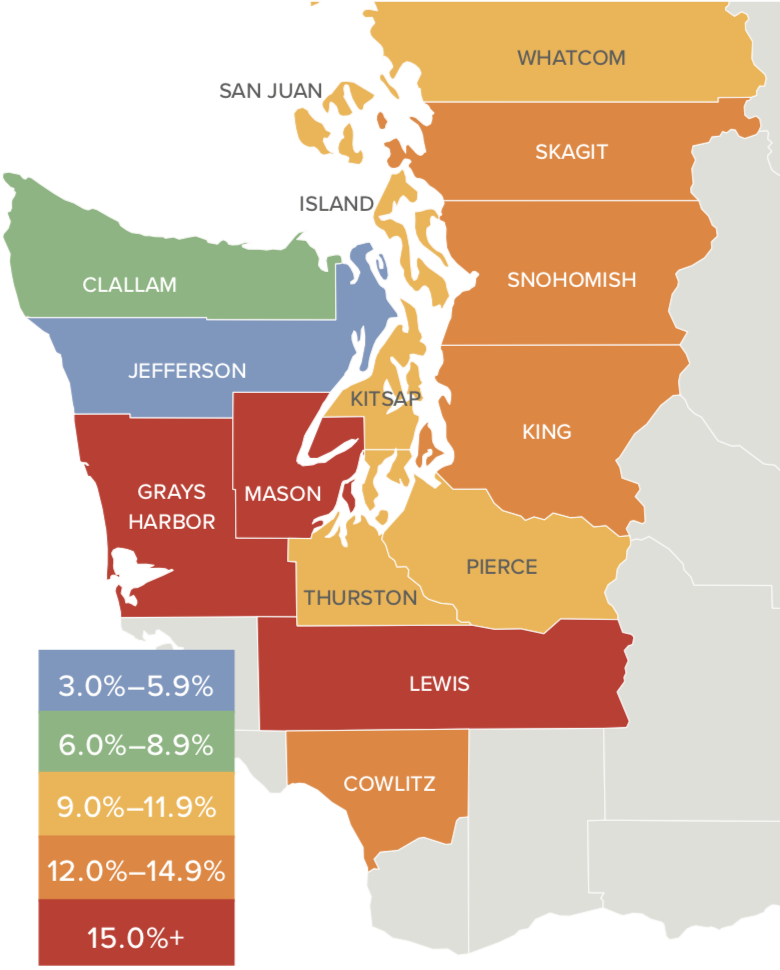
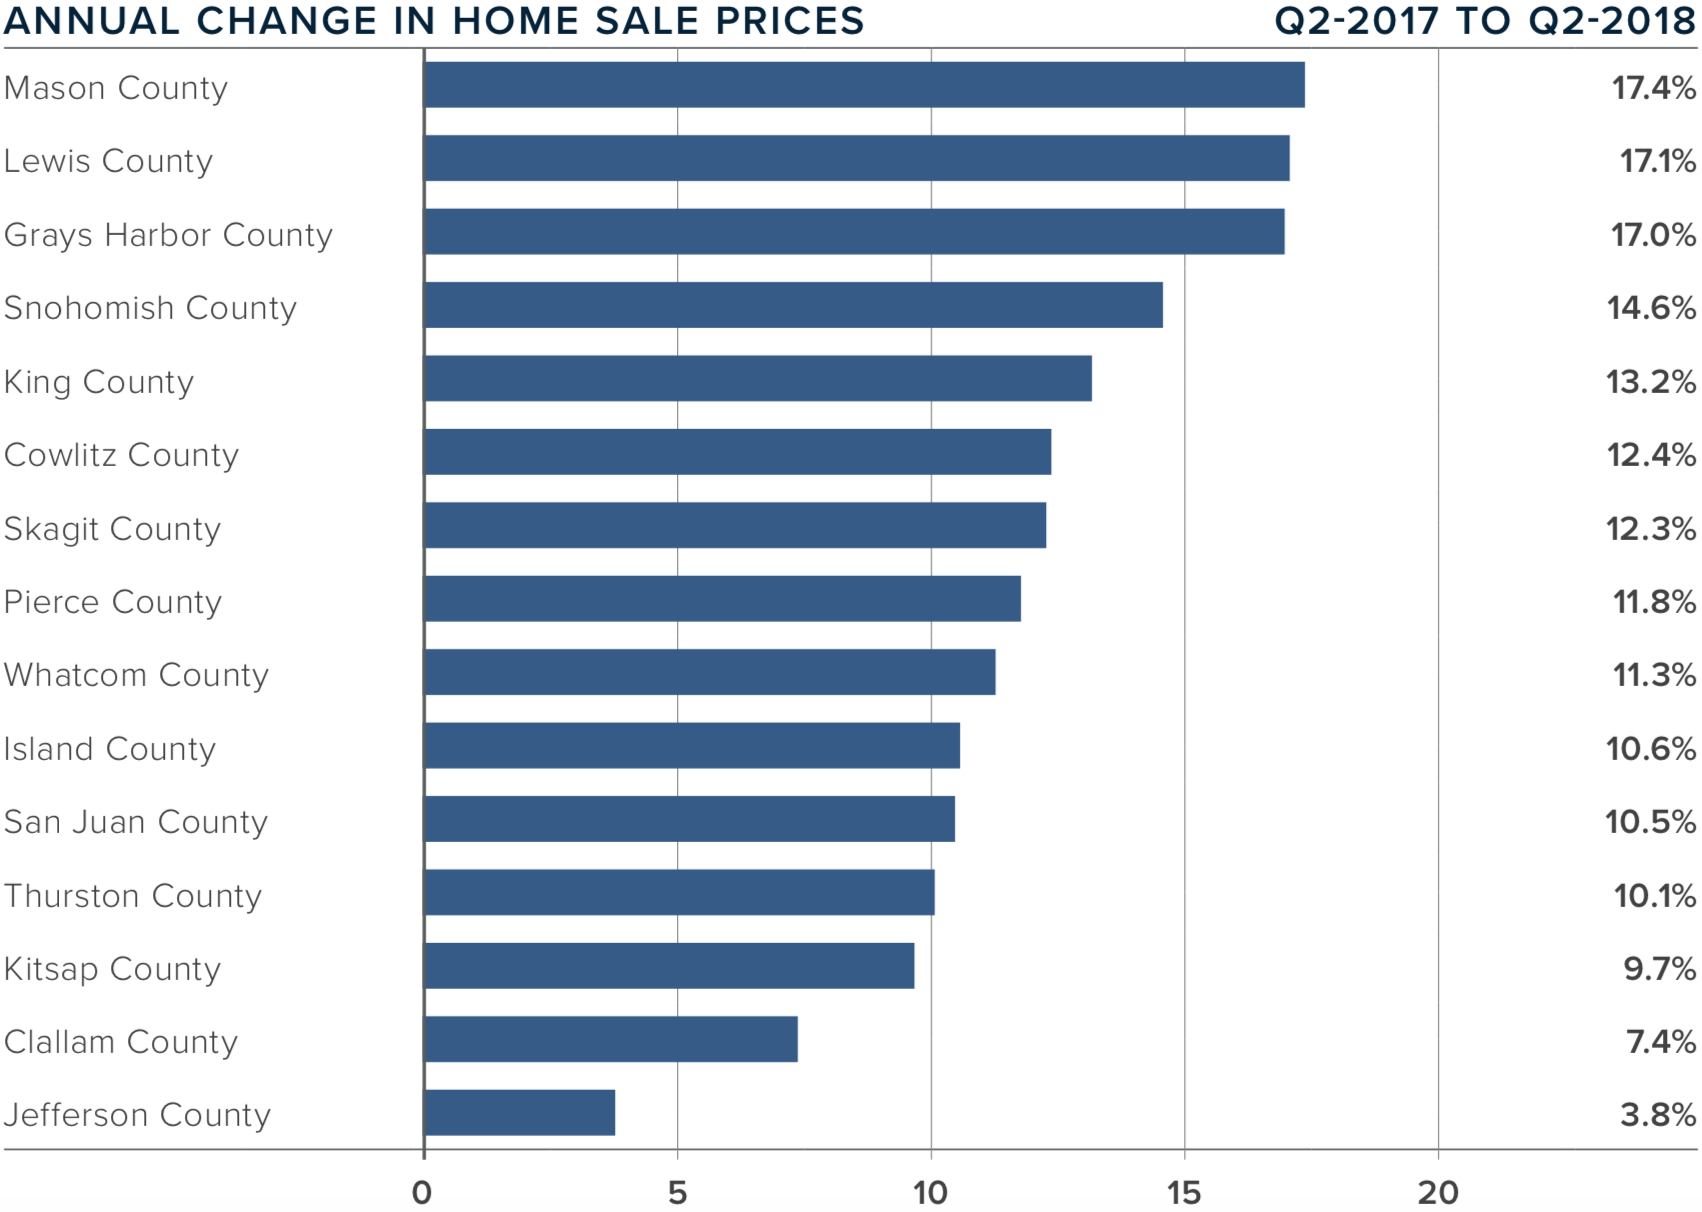
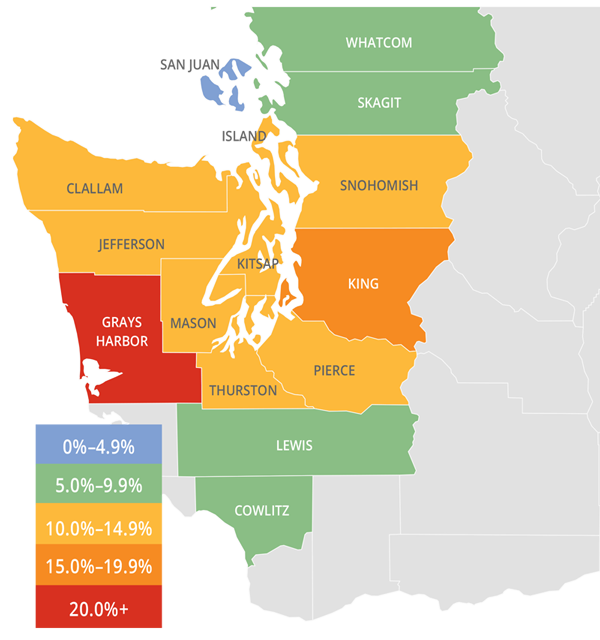
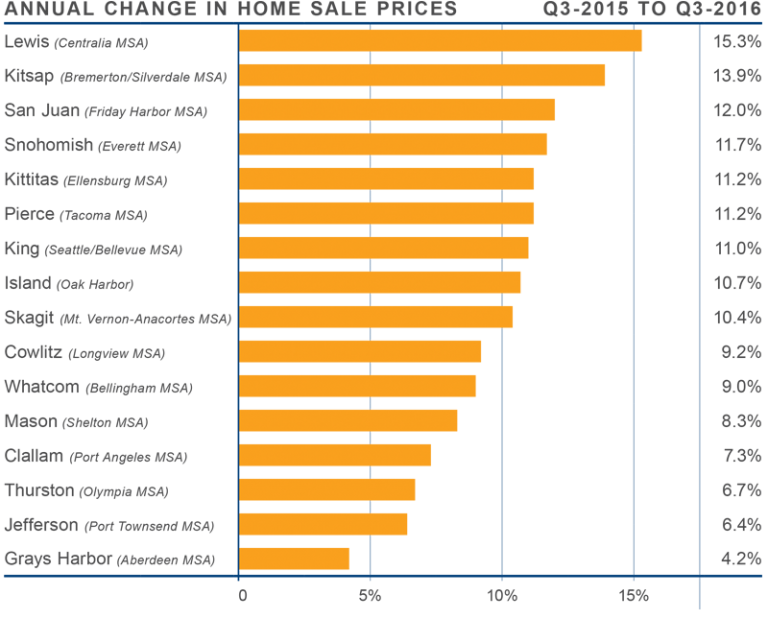
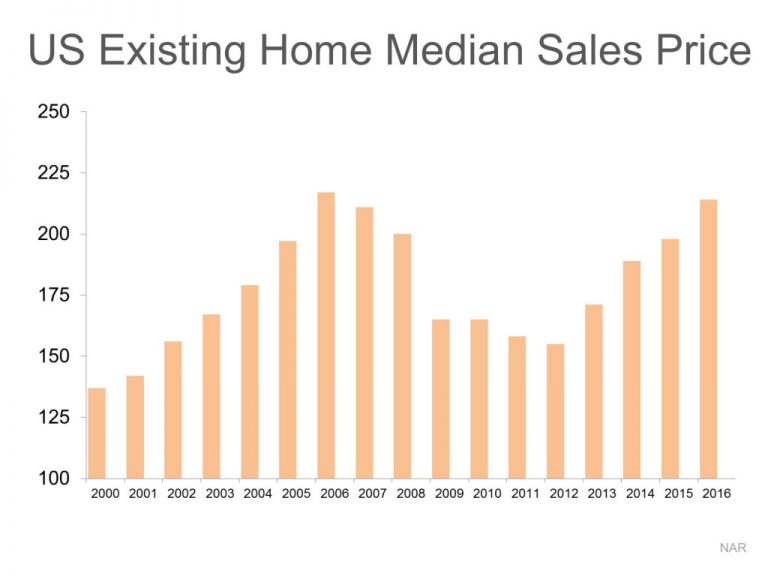
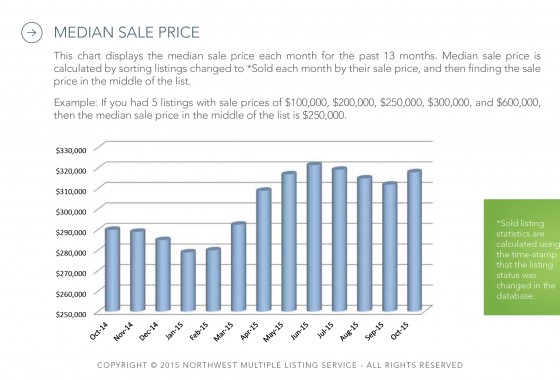
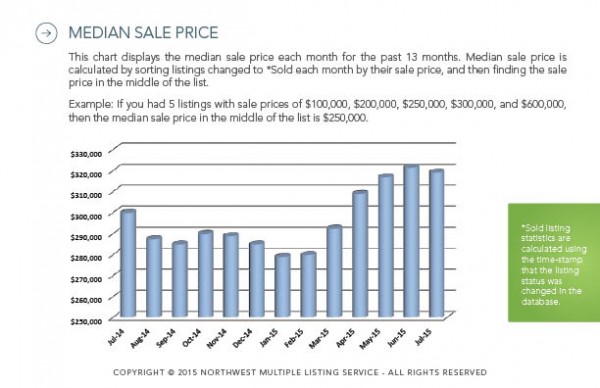
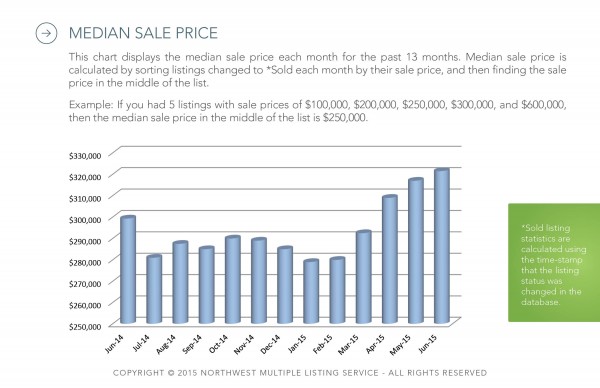
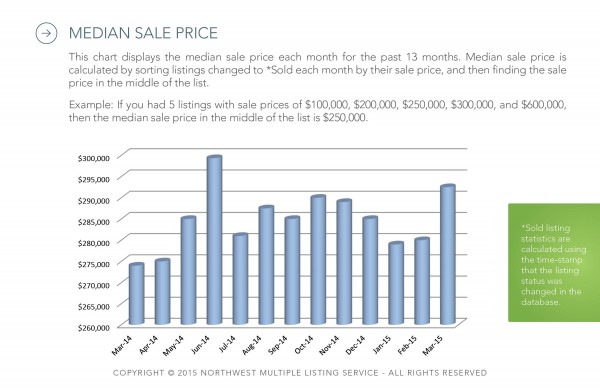
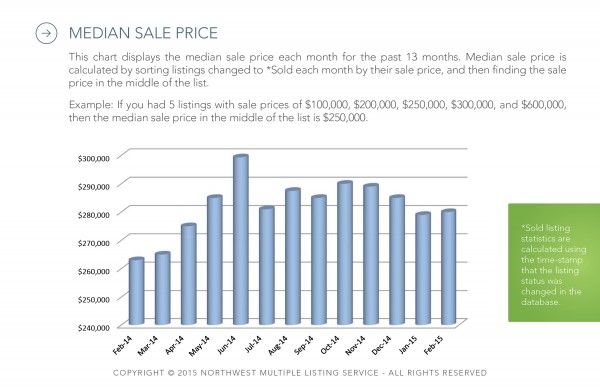
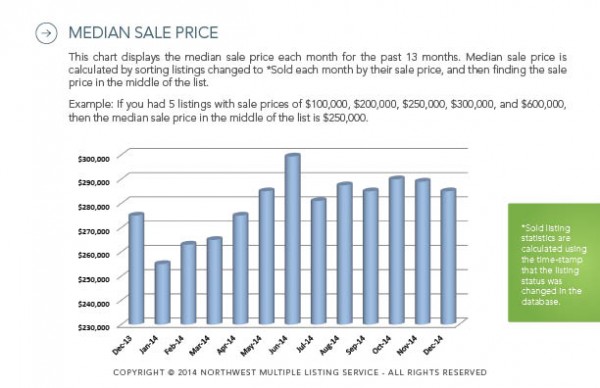
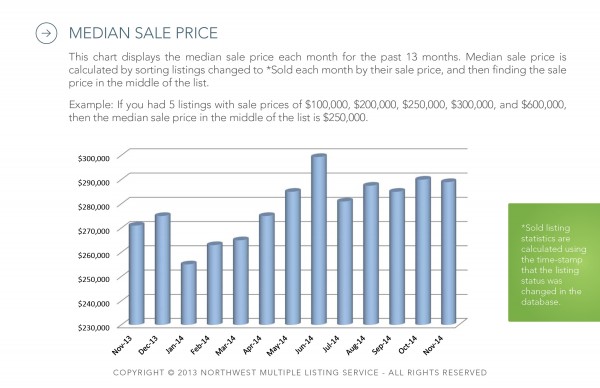
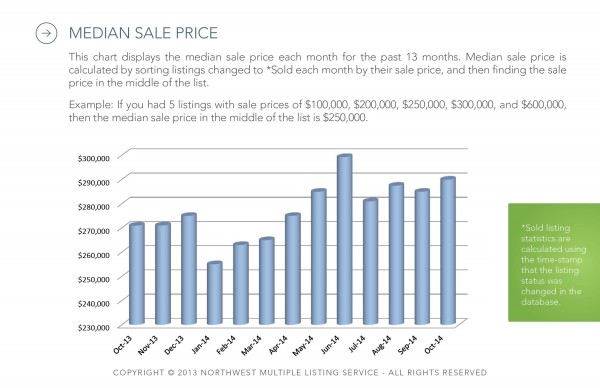
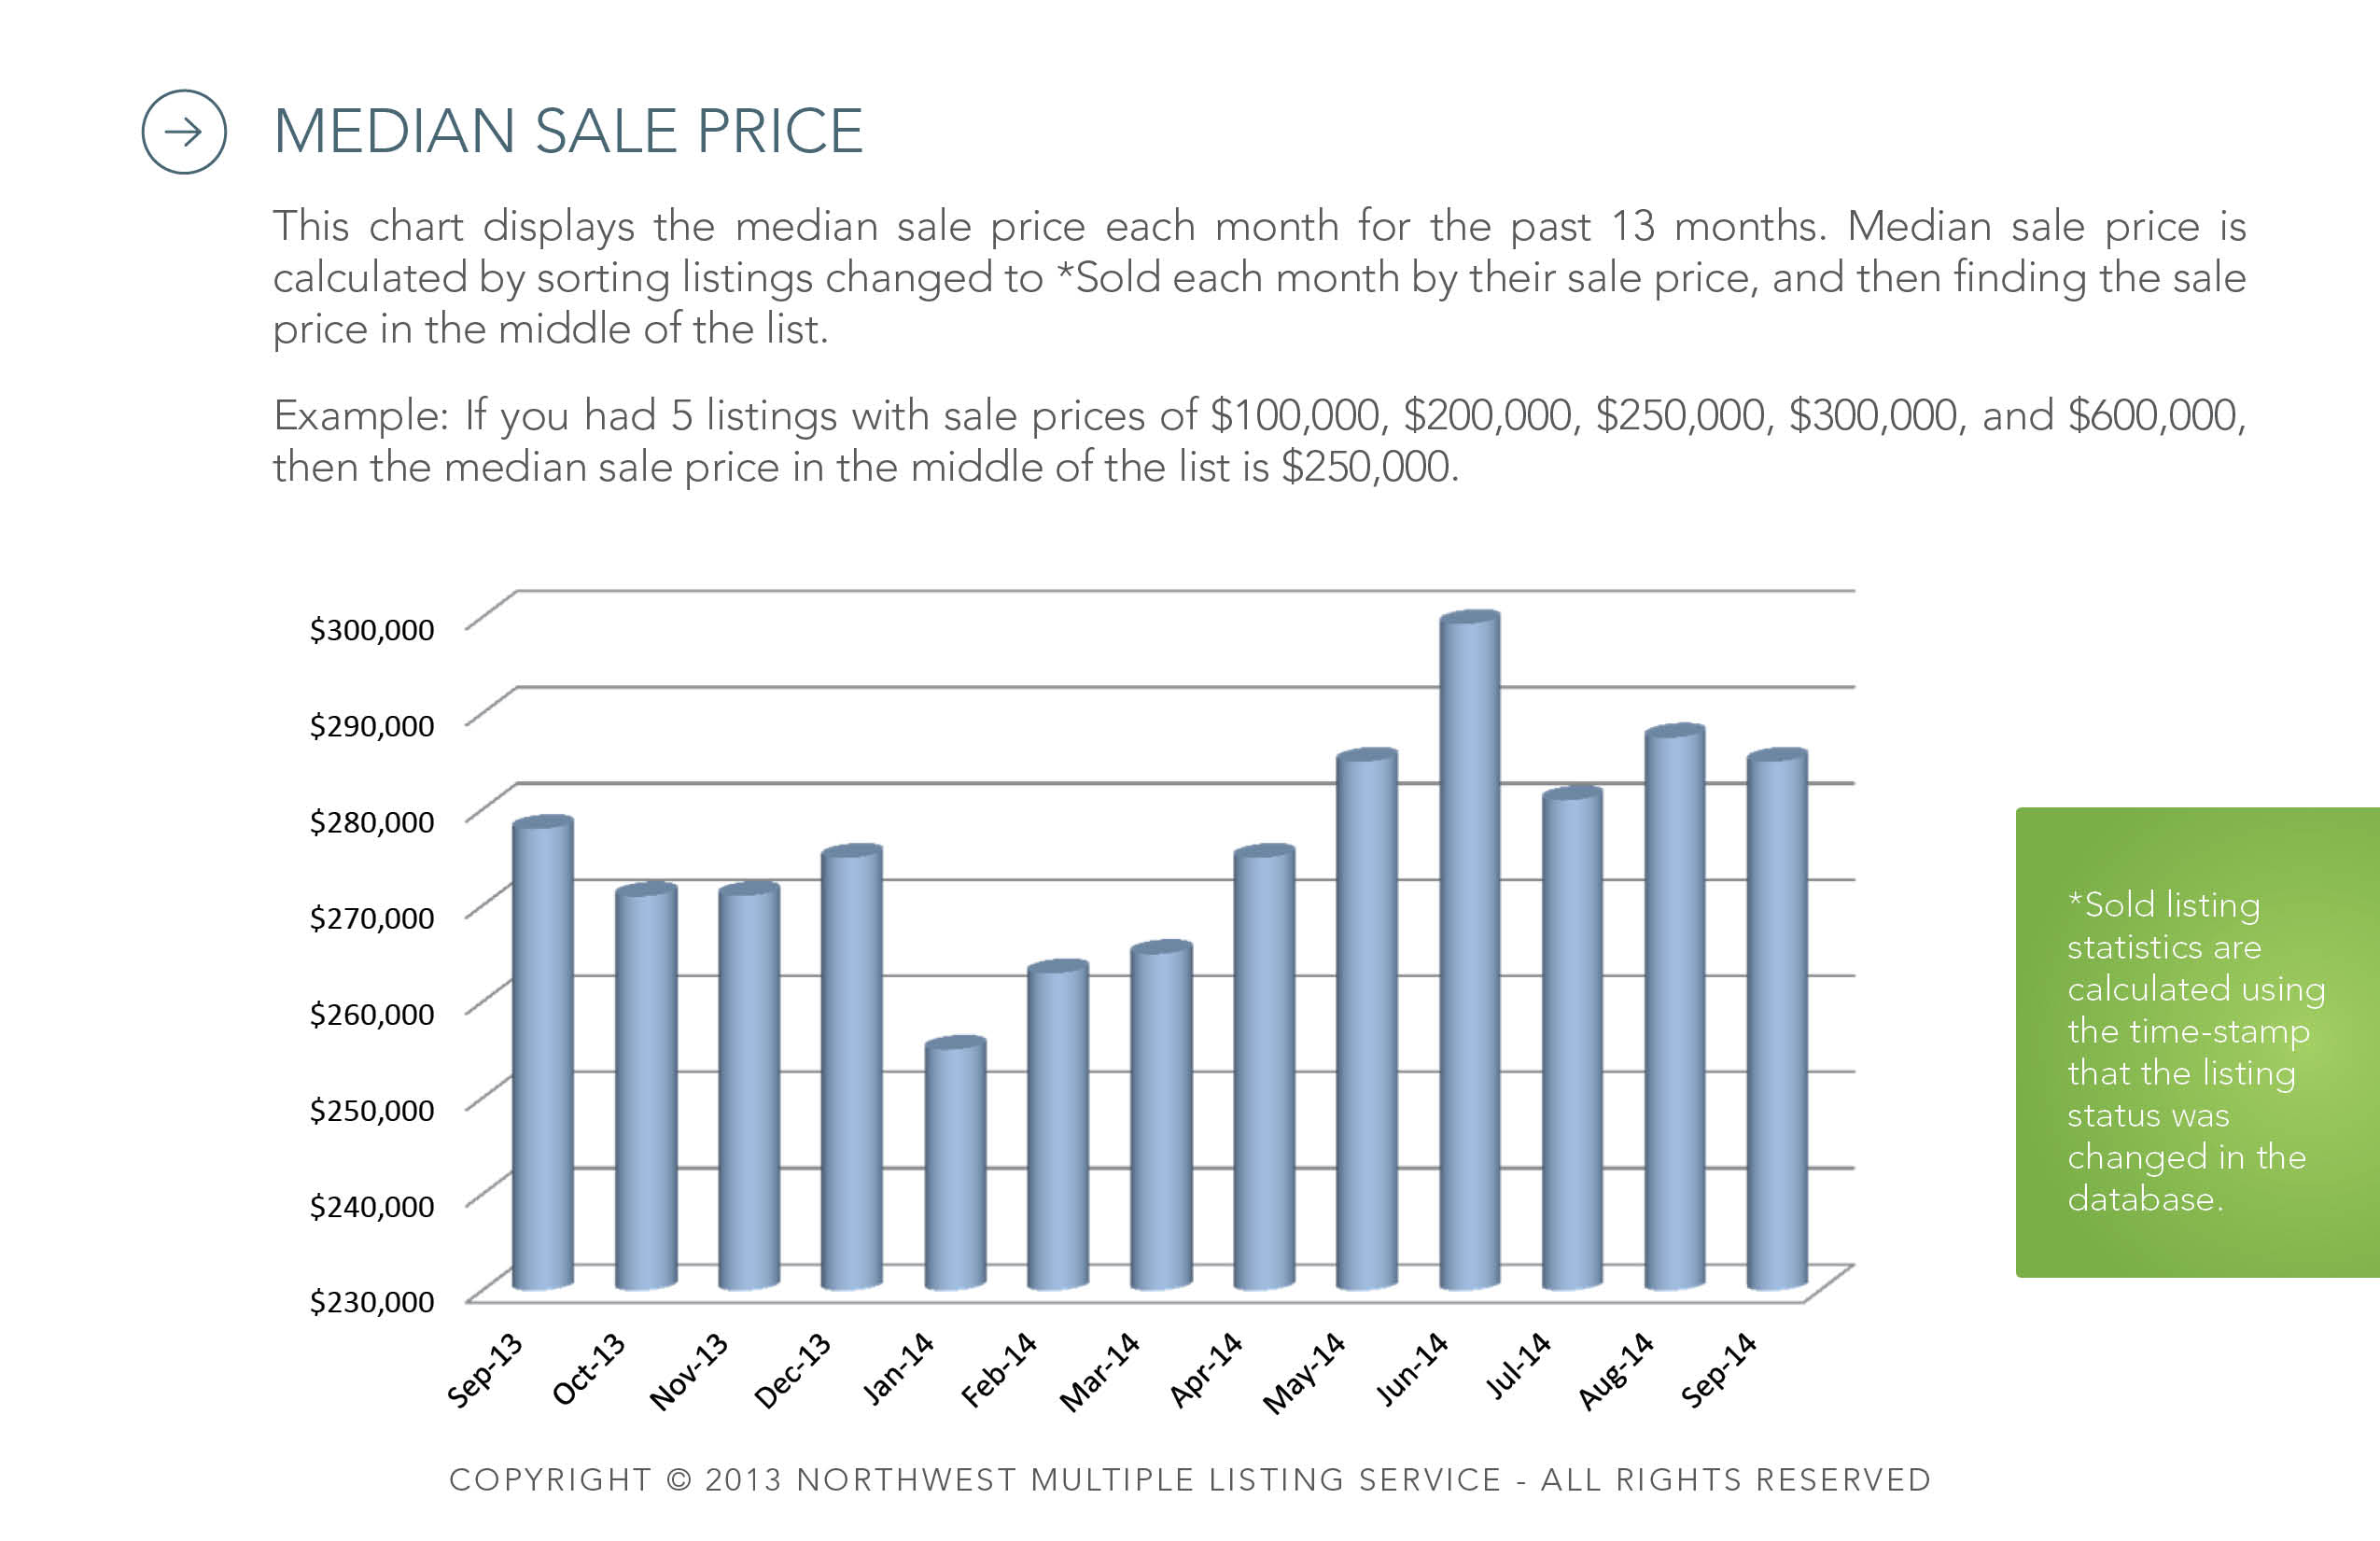
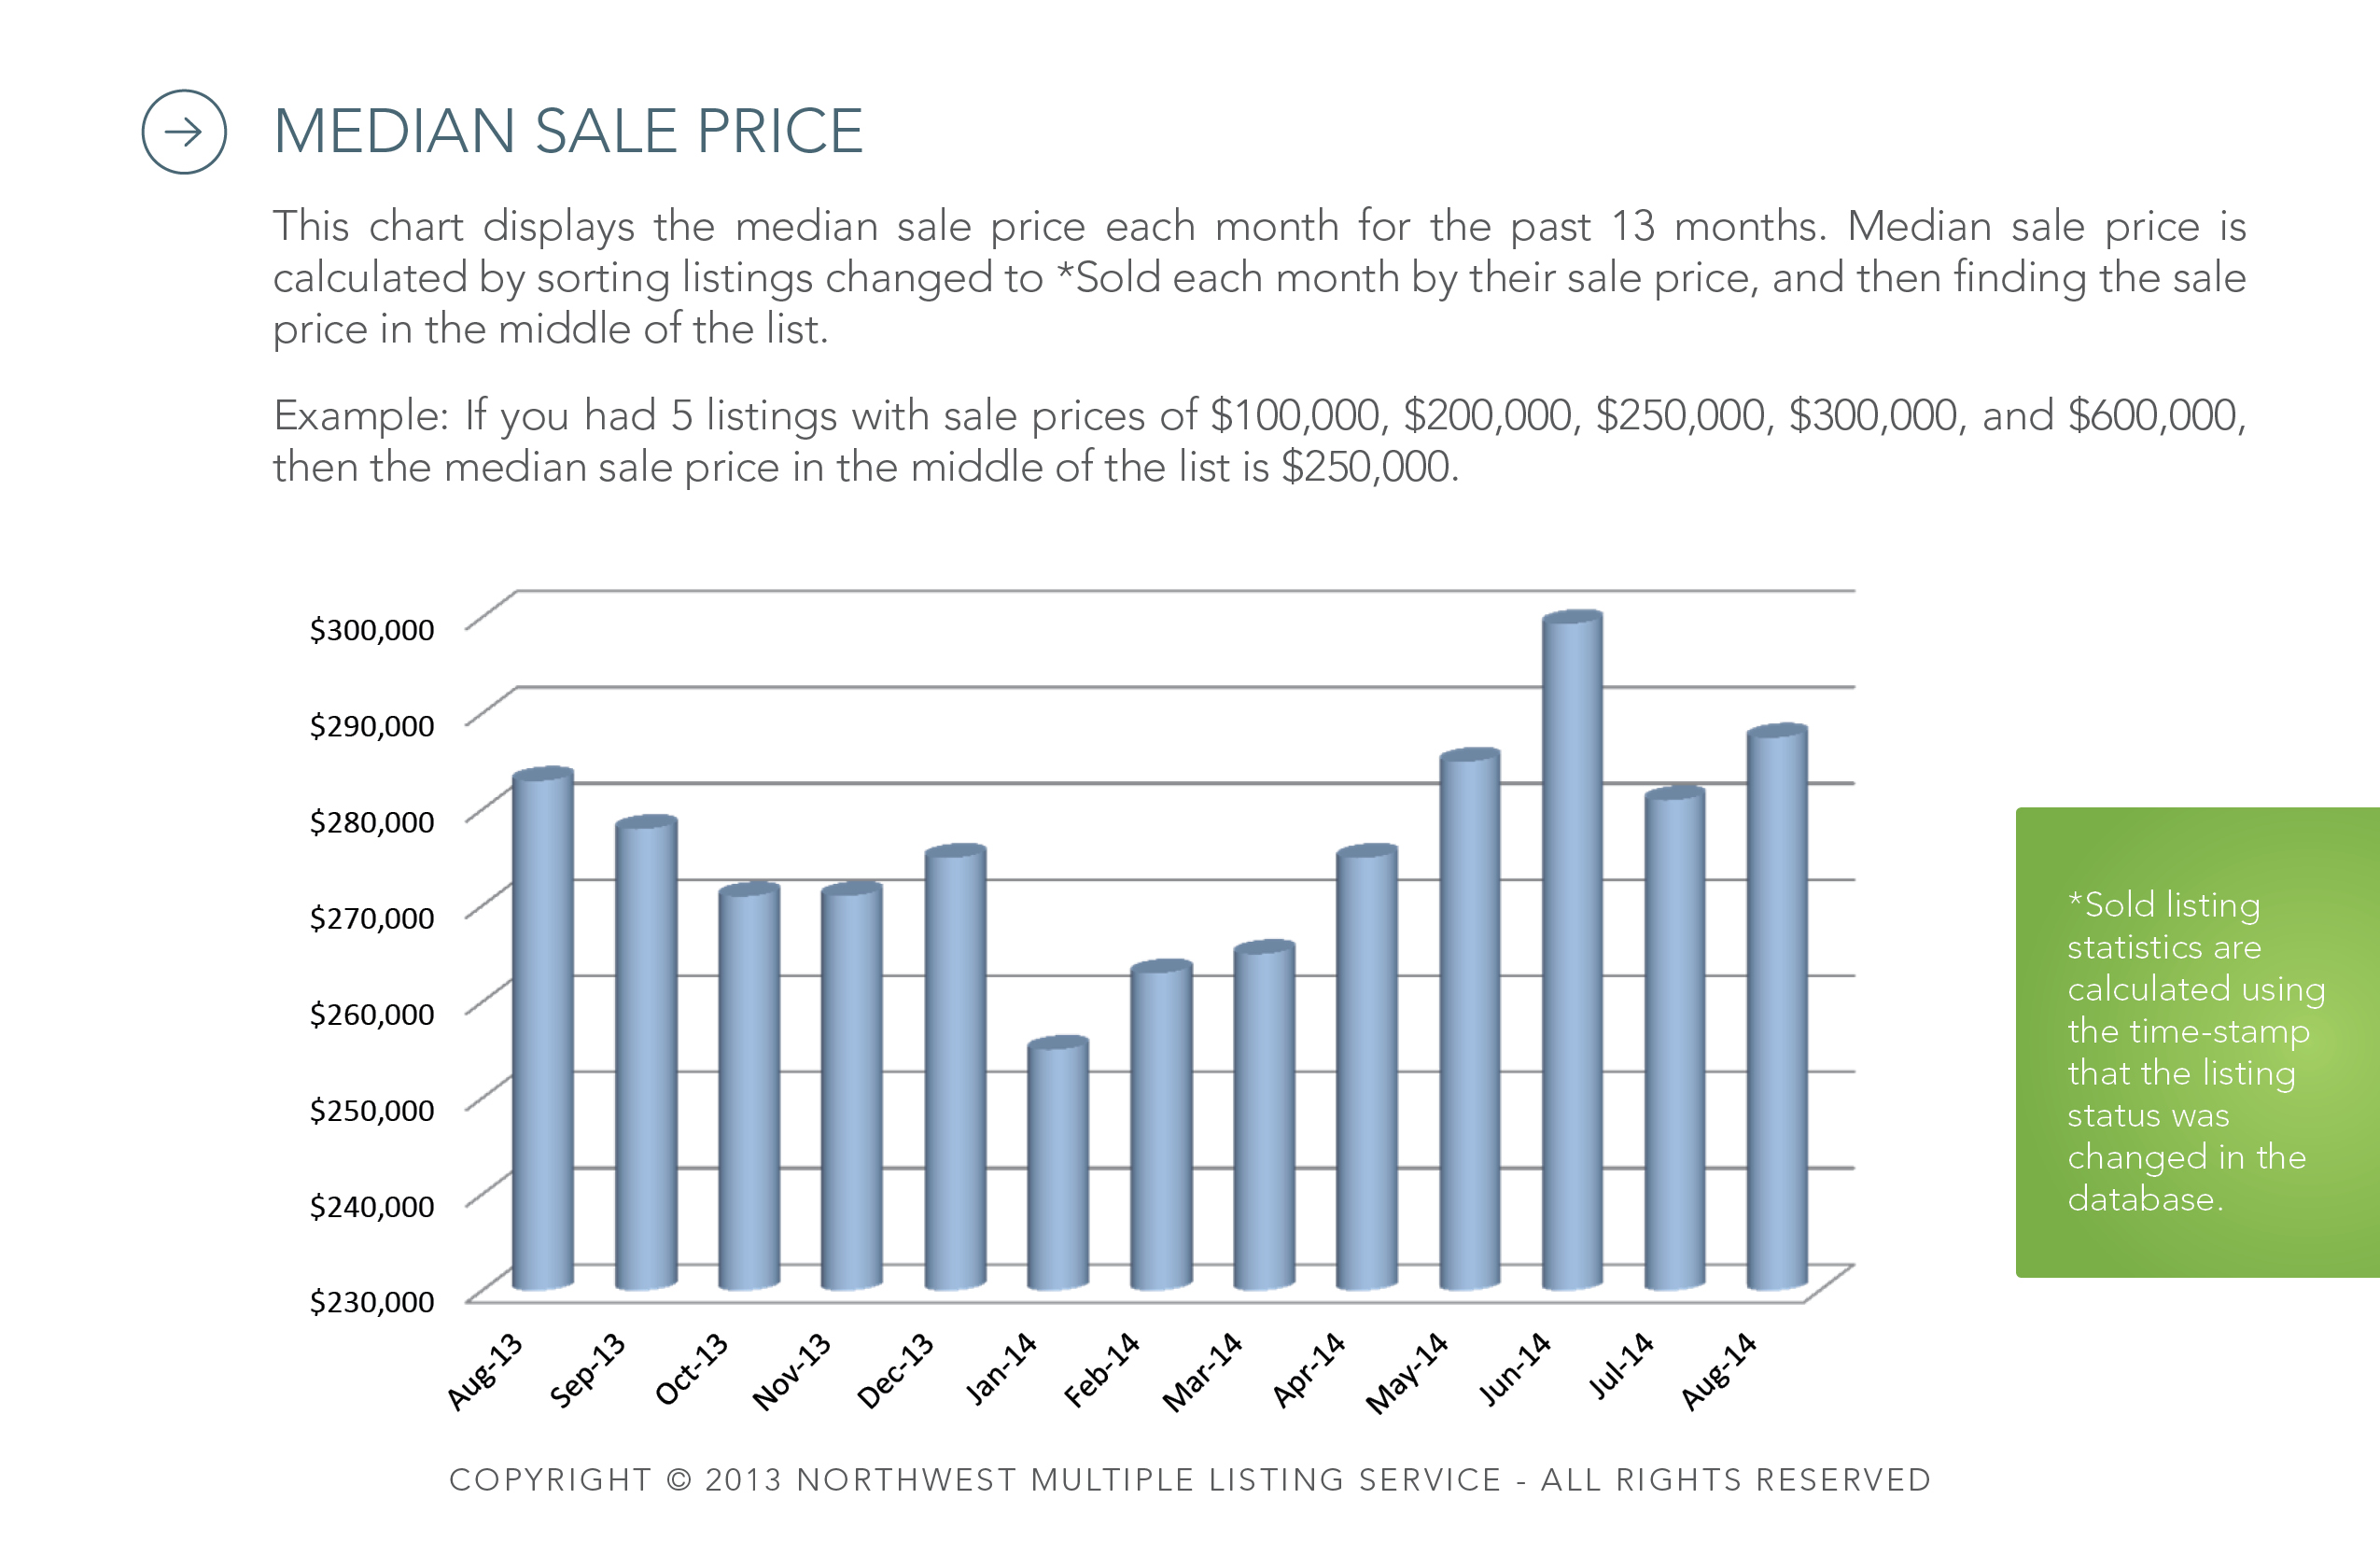
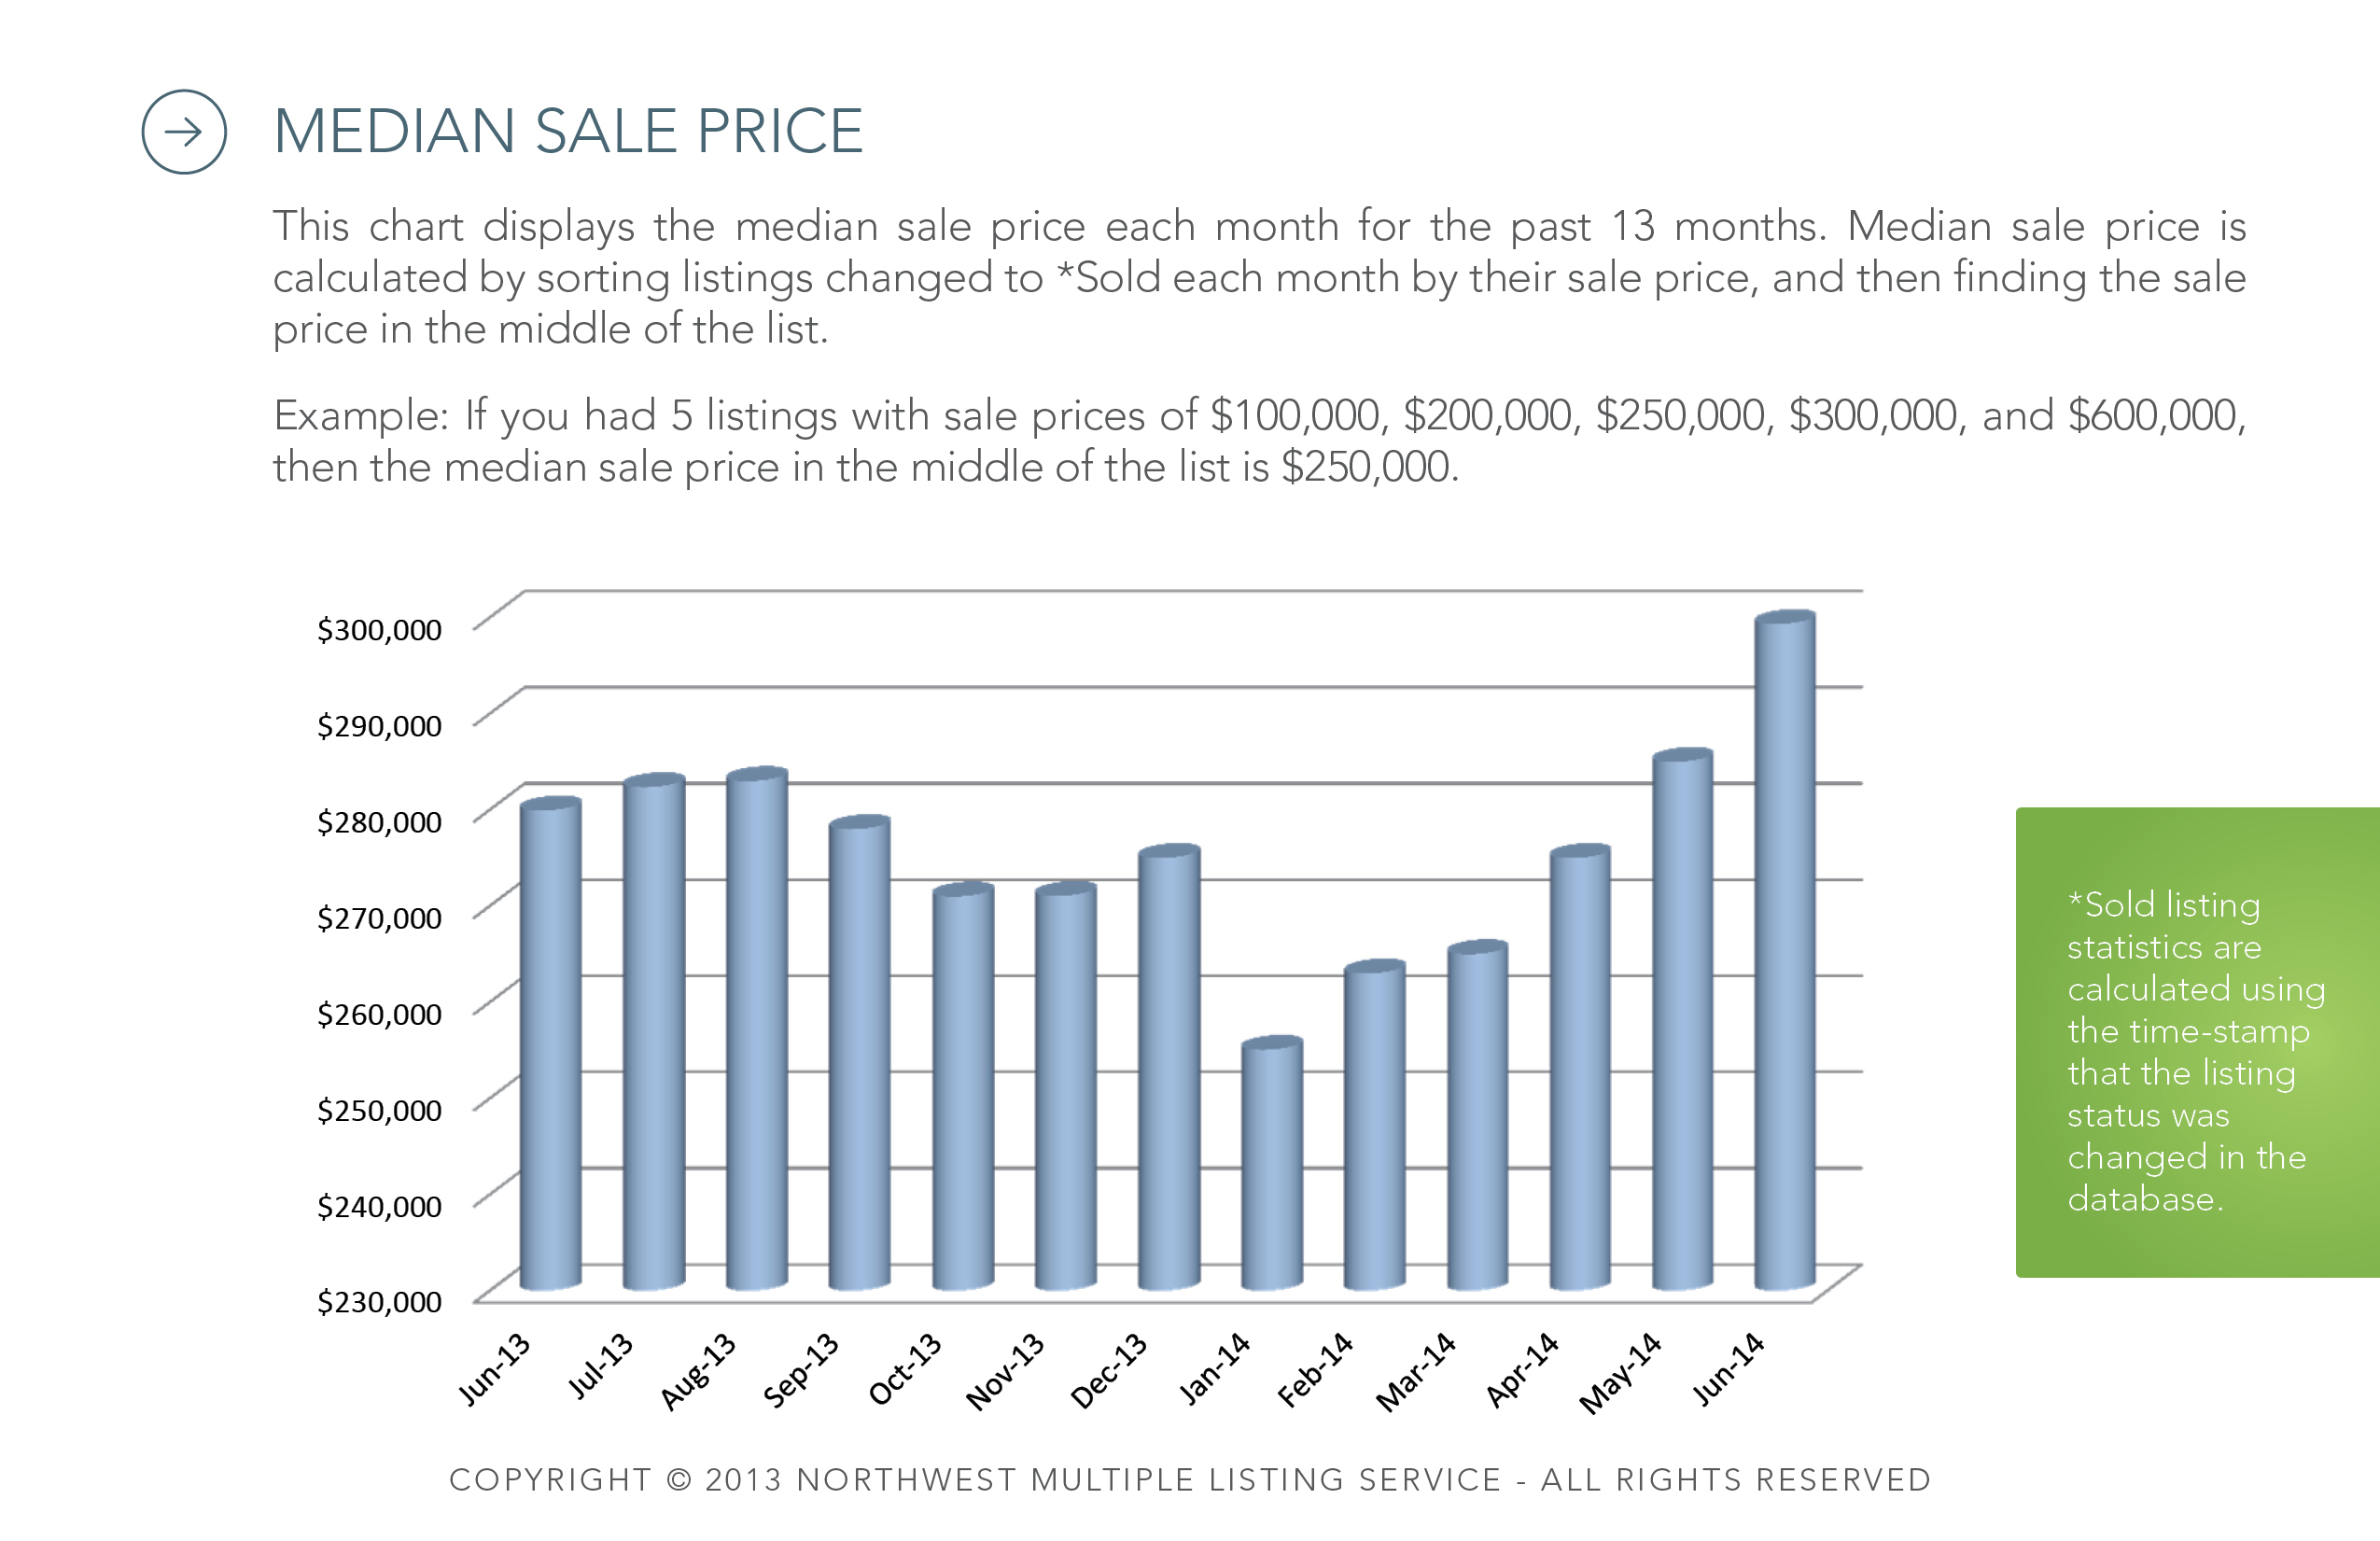
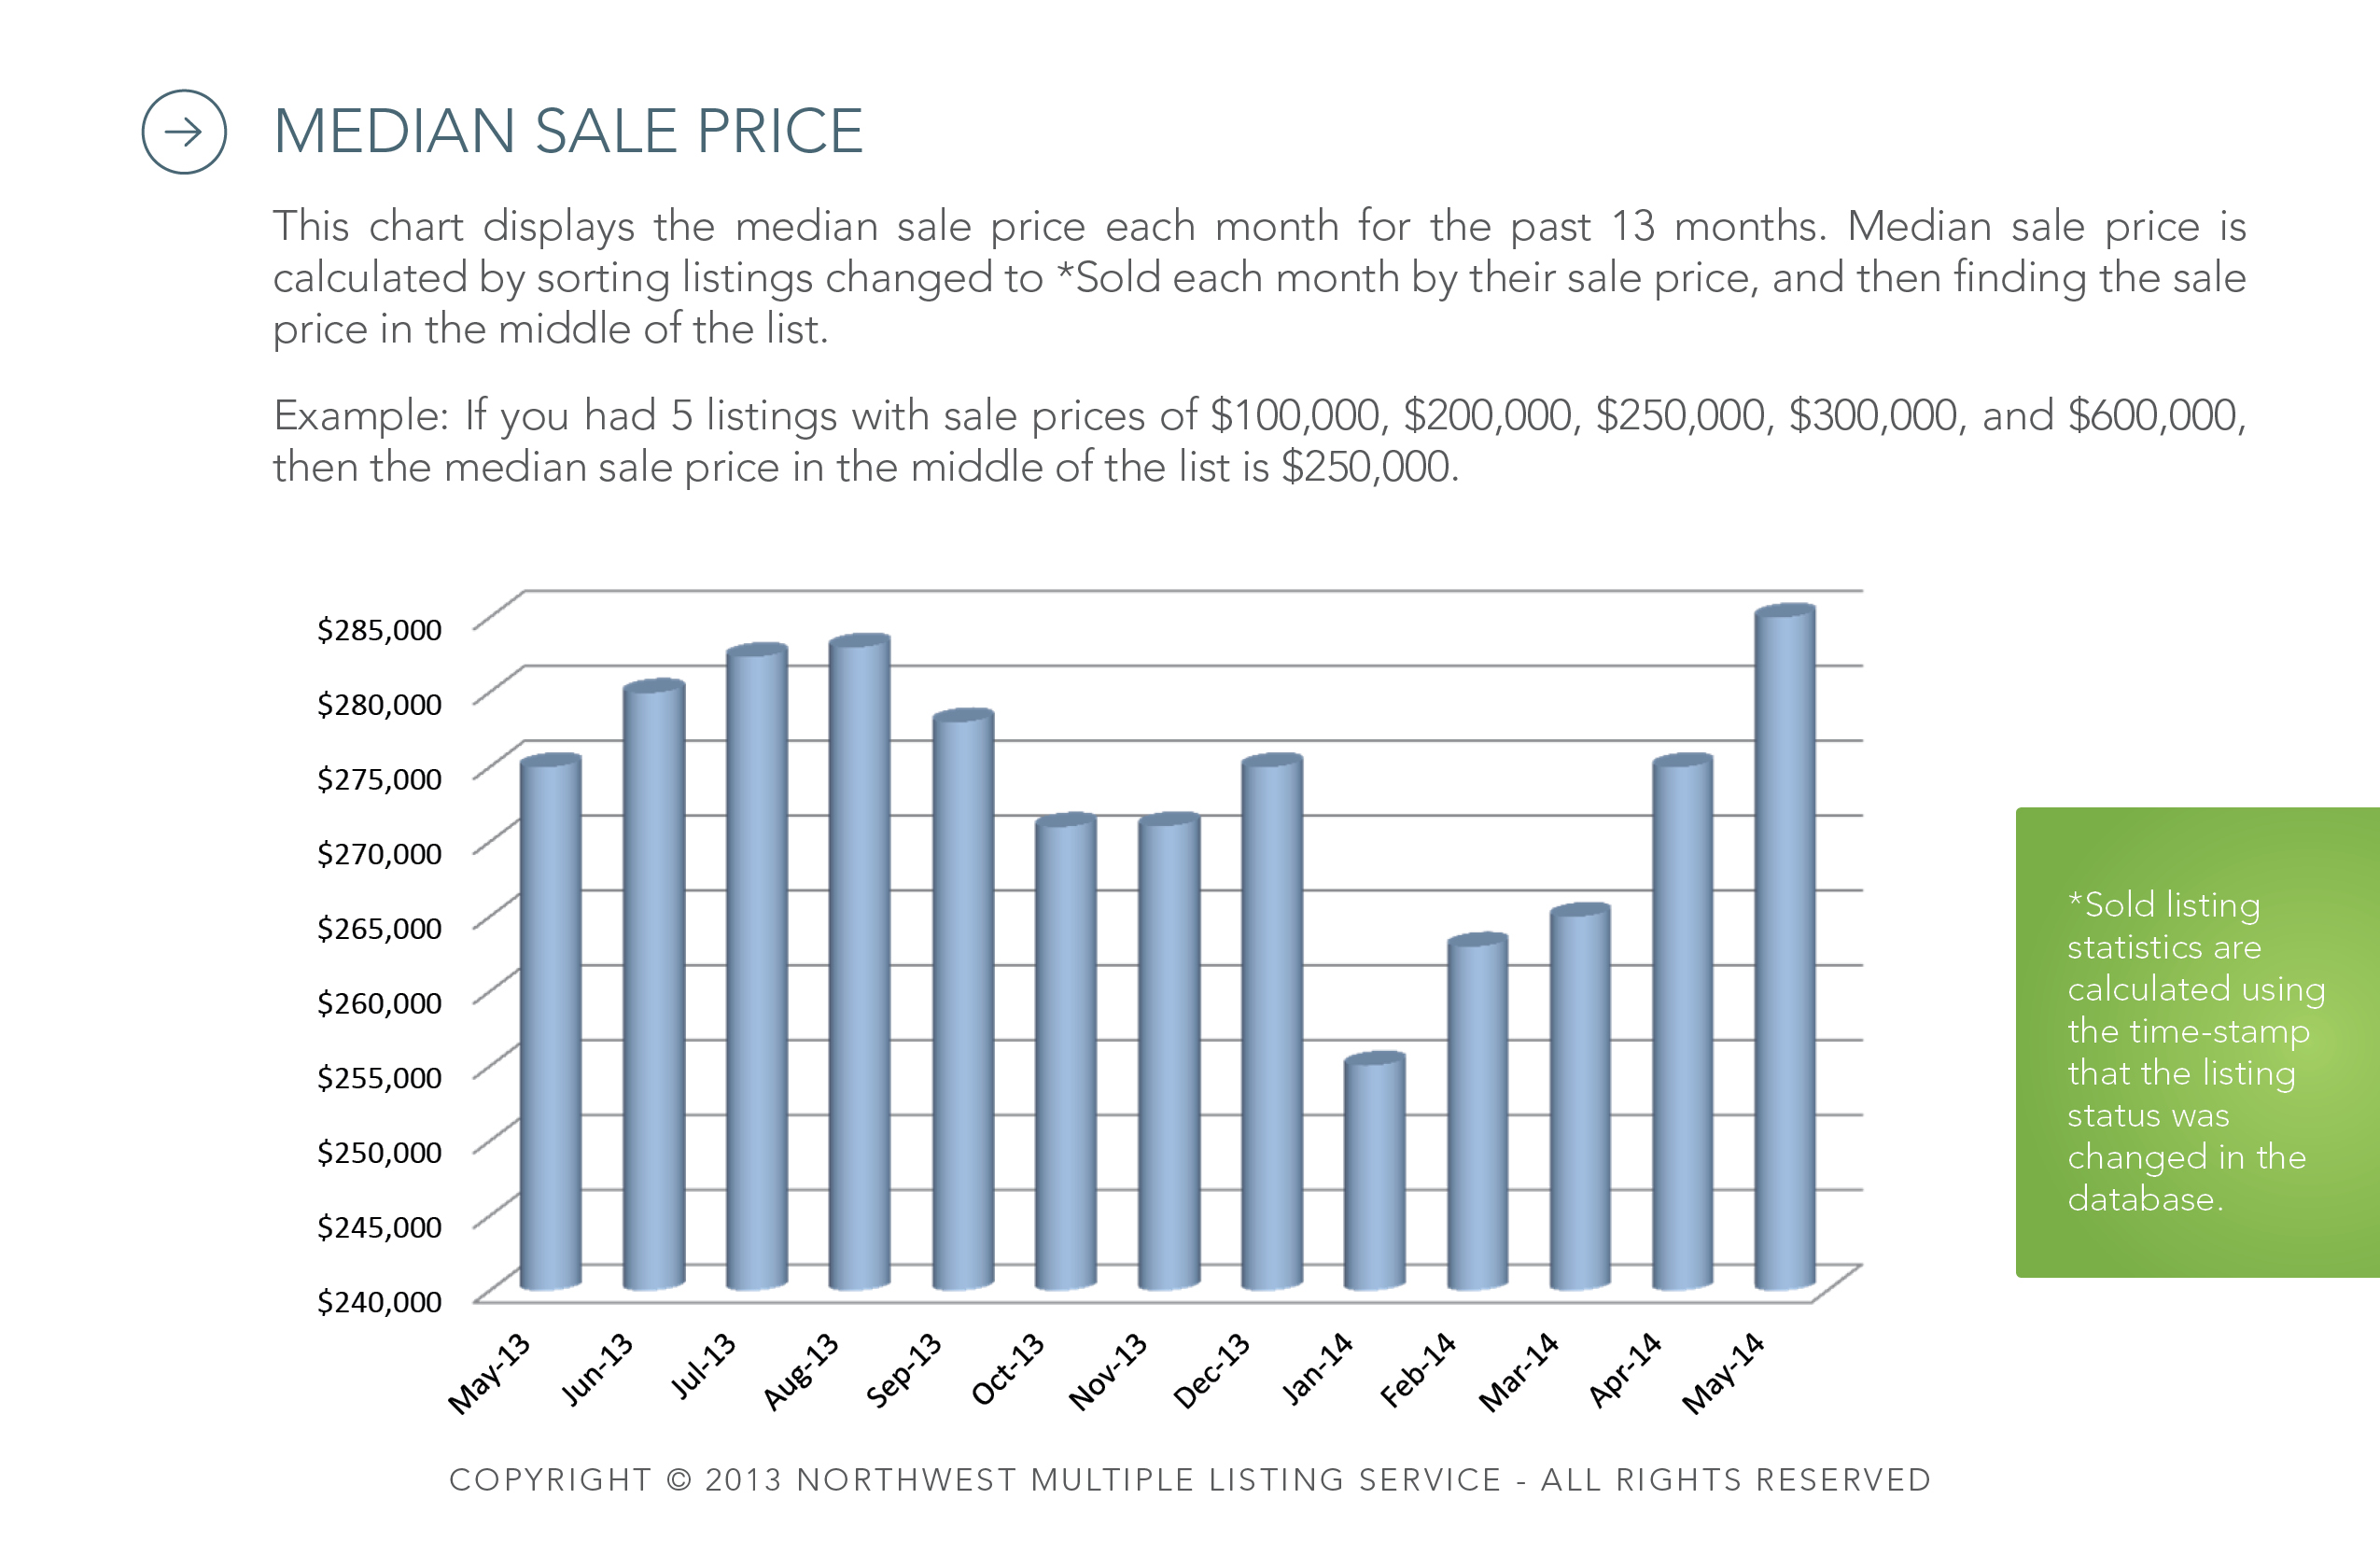
❱ Prices rose 2.8% compared to the third quarter of 2022 and were .6% higher than in the second quarter of this year. The average home sale price was $776,205.
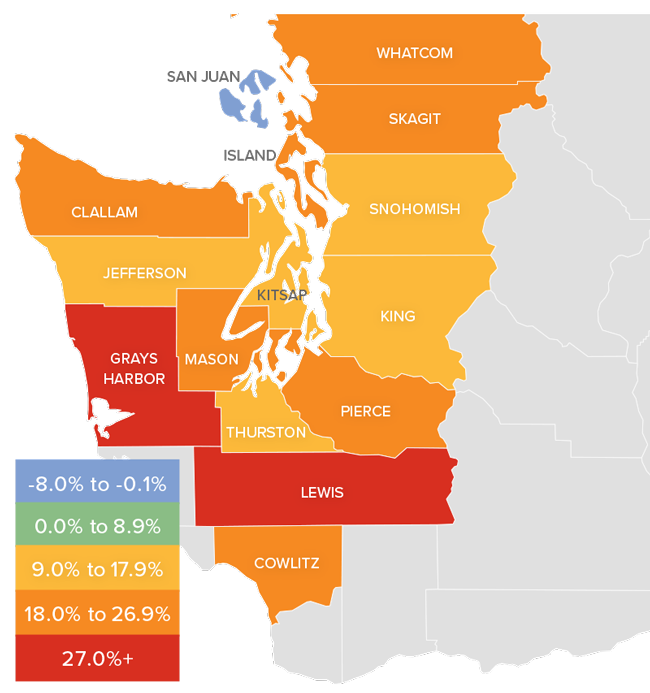
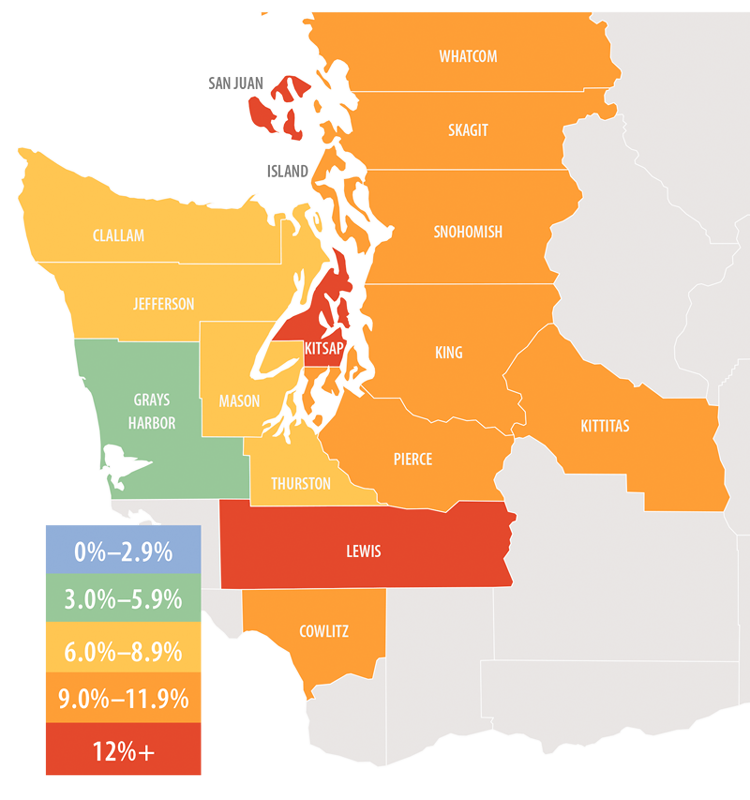
❱ Compared to the second quarter of this year, sale prices were higher in all counties except Grays Harbor (-.5%), Kitsap (-1.5%), Clallam (-1.6%), Whatcom (-2.6%), and Skagit (-3%).
❱ Compared to the prior year, the pace of price growth slowed in the third quarter. This wasn’t too surprising given that the market was coming off record high prices in the summer of 2022. But what was surprising was that prices rose over the previous quarter despite the fact that mortgage rates were above 7% for almost the entire quarter.
❱ I don’t expect prices to move far from current levels in the coming months, and they likely won’t rise again until mortgage rates start to fall. When prices do rise, I anticipate that the pace of growth will be far more modest than we have become accustomed to.
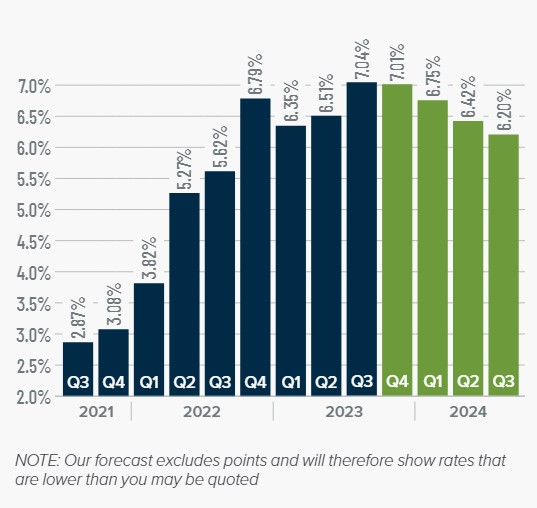
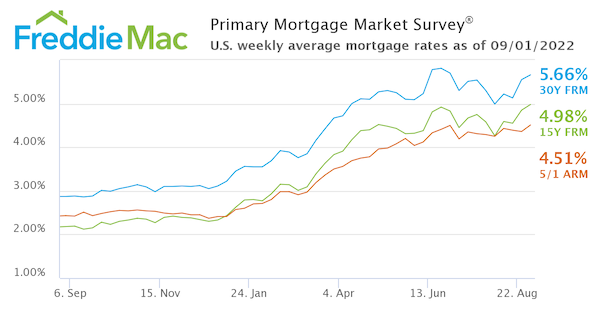
MORTGAGE RATES
Mortgage rates continued trending higher in the third quarter of 2023 and are now at levels we have not seen since the fall of 2000. Mortgage rates are tied to the interest rate (yield) on 10-year treasuries, and they move in the opposite direction of the economy. Unfortunately for mortgage rates, the economy remains relatively buoyant, and though inflation is down significantly from its high, it is still elevated. These major factors and many minor ones are pushing Treasury yields higher, which is pushing mortgage rates up. Given the current position of the Federal Reserve, which intends to keep rates “higher for longer,” it is unlikely that home buyers will get much reprieve when it comes to borrowing costs any time soon.
With such a persistently positive economy, I have had to revise my forecast yet again. I now believe rates will hold at current levels before starting to trend down in the spring of next year.
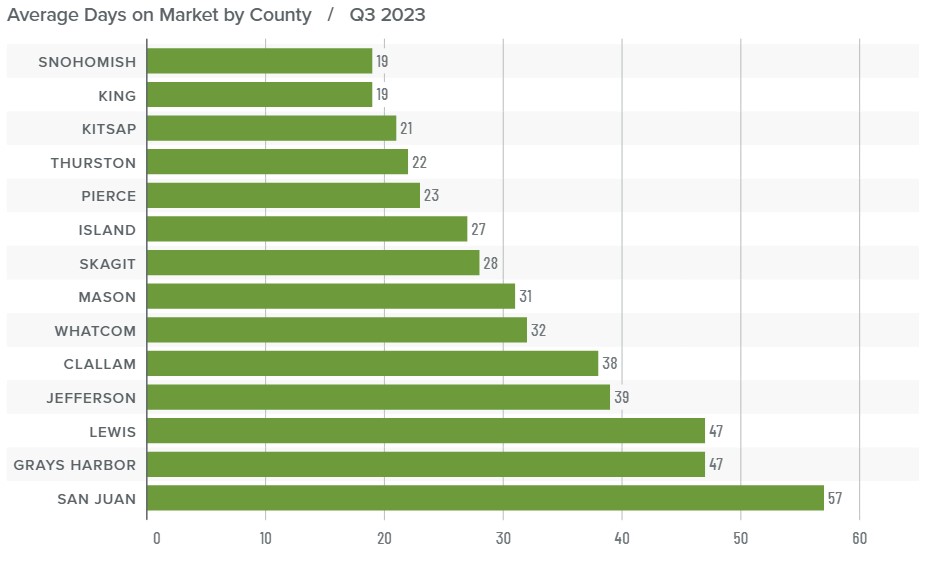
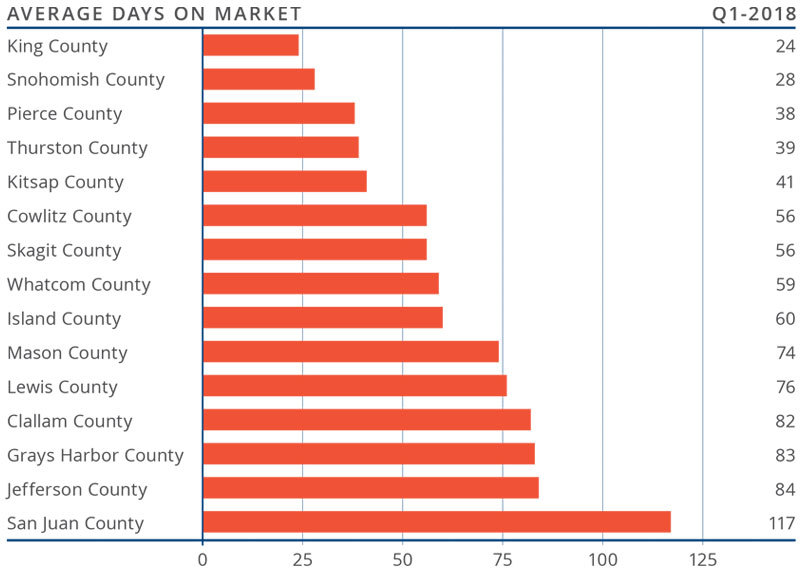
DAYS ON MARKET
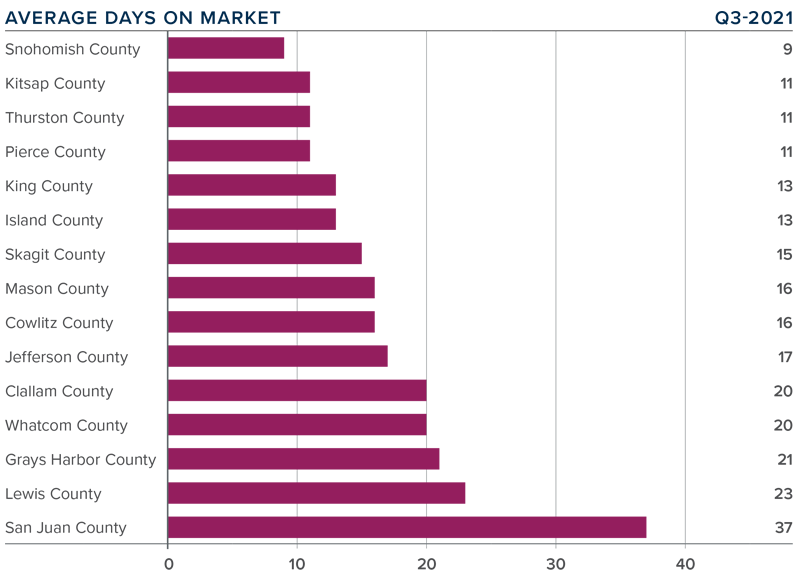
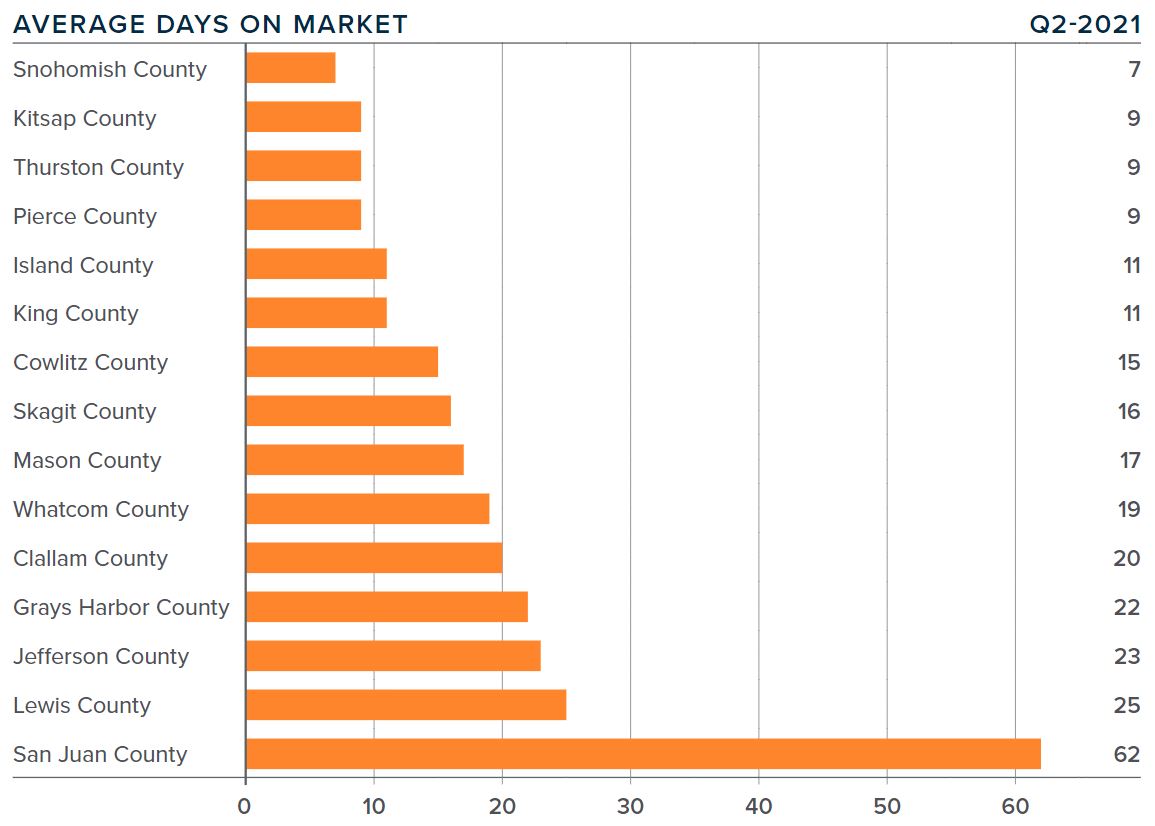
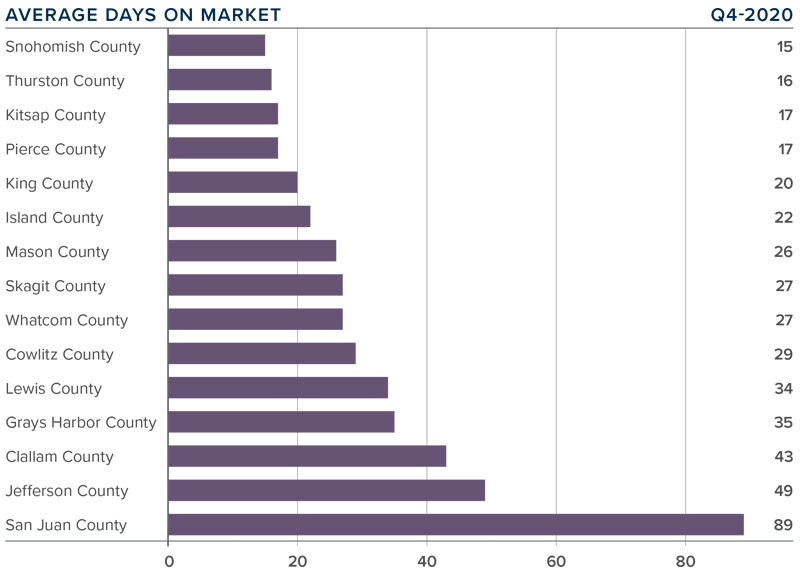
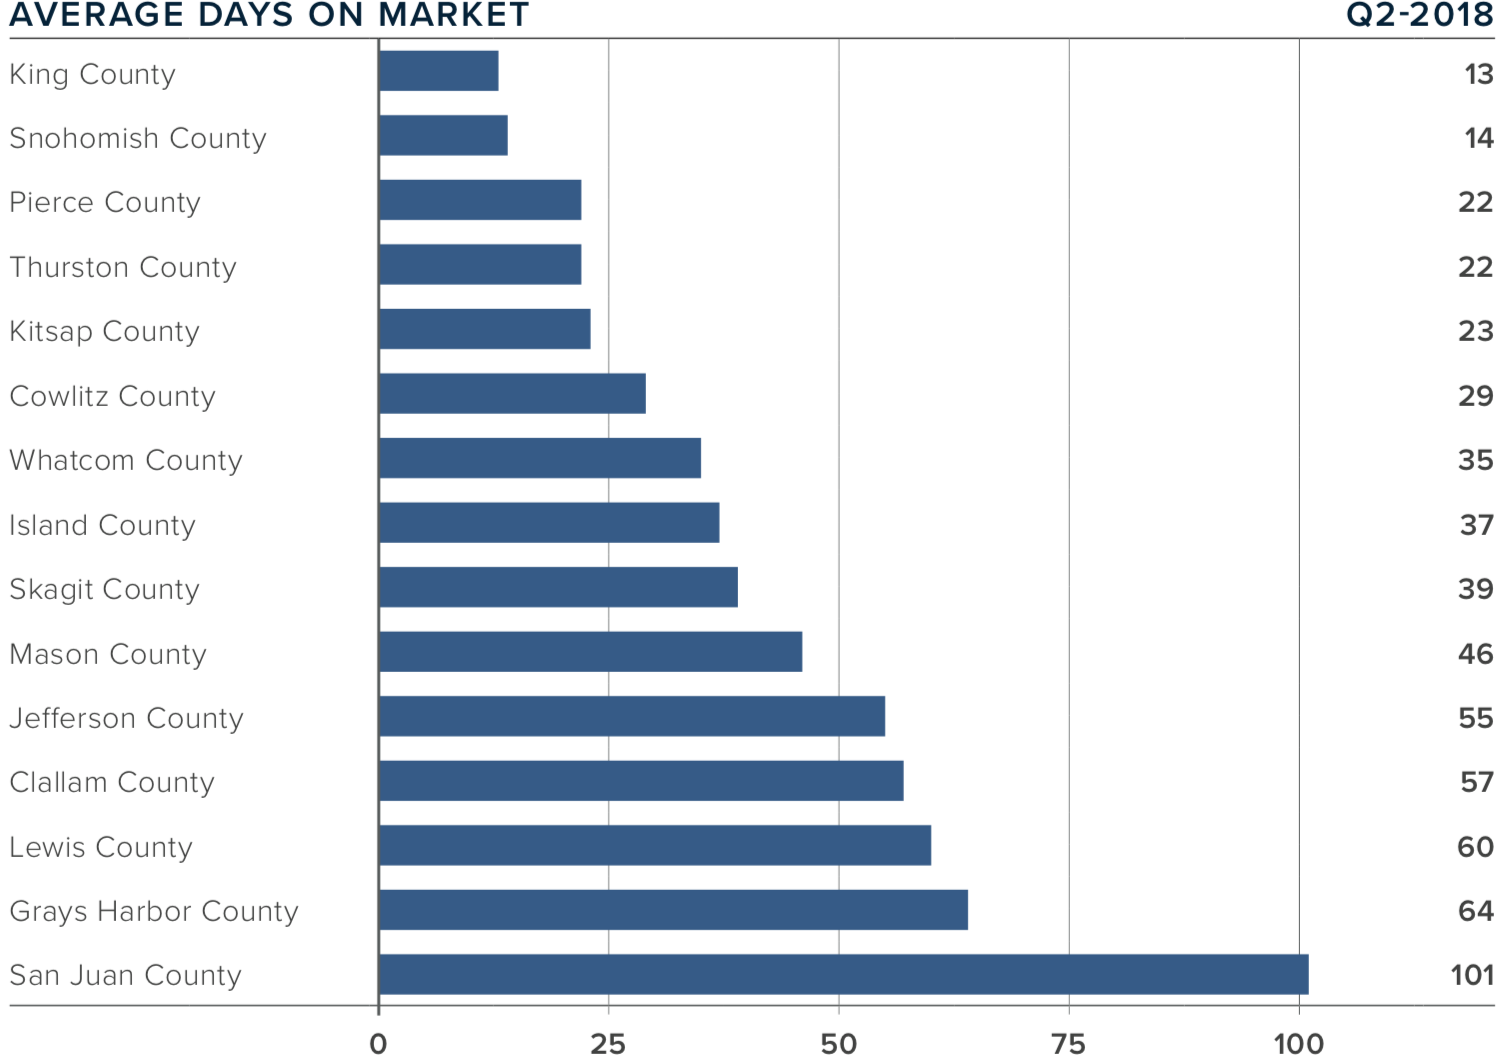
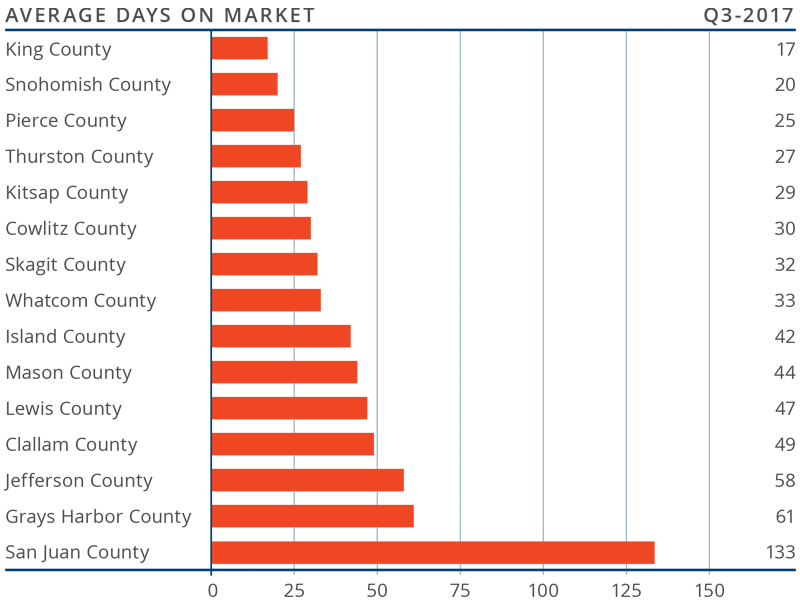
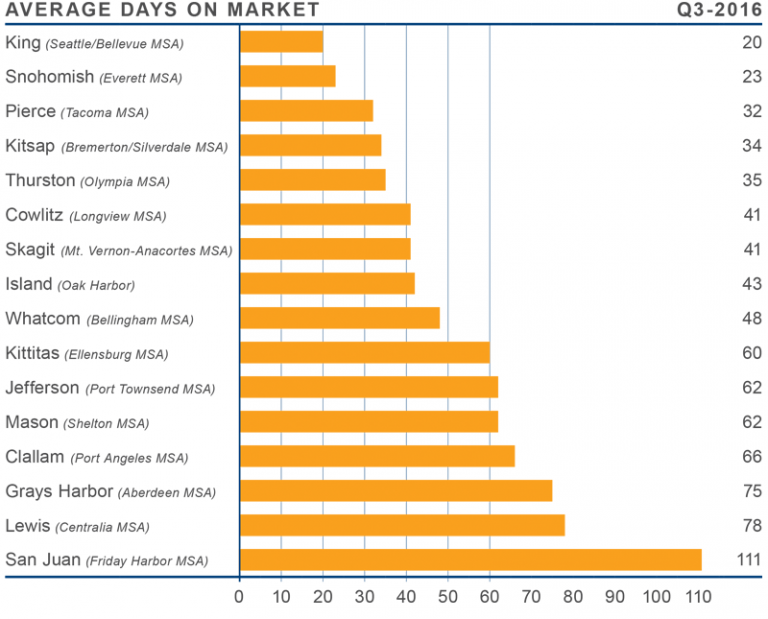
❱ It took an average of 32 days for homes to sell in the third quarter of 2023. This was 8 more days than in the same quarter of 2022, but 3 fewer days compared to the second quarter of this year.
❱ Snohomish and King counties were the tightest markets in Western Washington, with homes taking an average of only 19 days to find a buyer. Homes for sale in San Juan County took the longest time to find a buyer (57 days).z
❱ All counties except Snohomish saw average days on market rise from the same period in 2022. Market time fell in 9 of the 14 counties compared to the prior quarter.
❱ The greatest fall in market time compared to the second quarter was in San Juan County, where market time fell 23 days.
CONCOLUSIONS
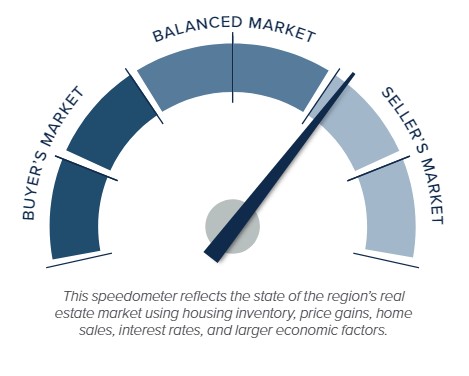
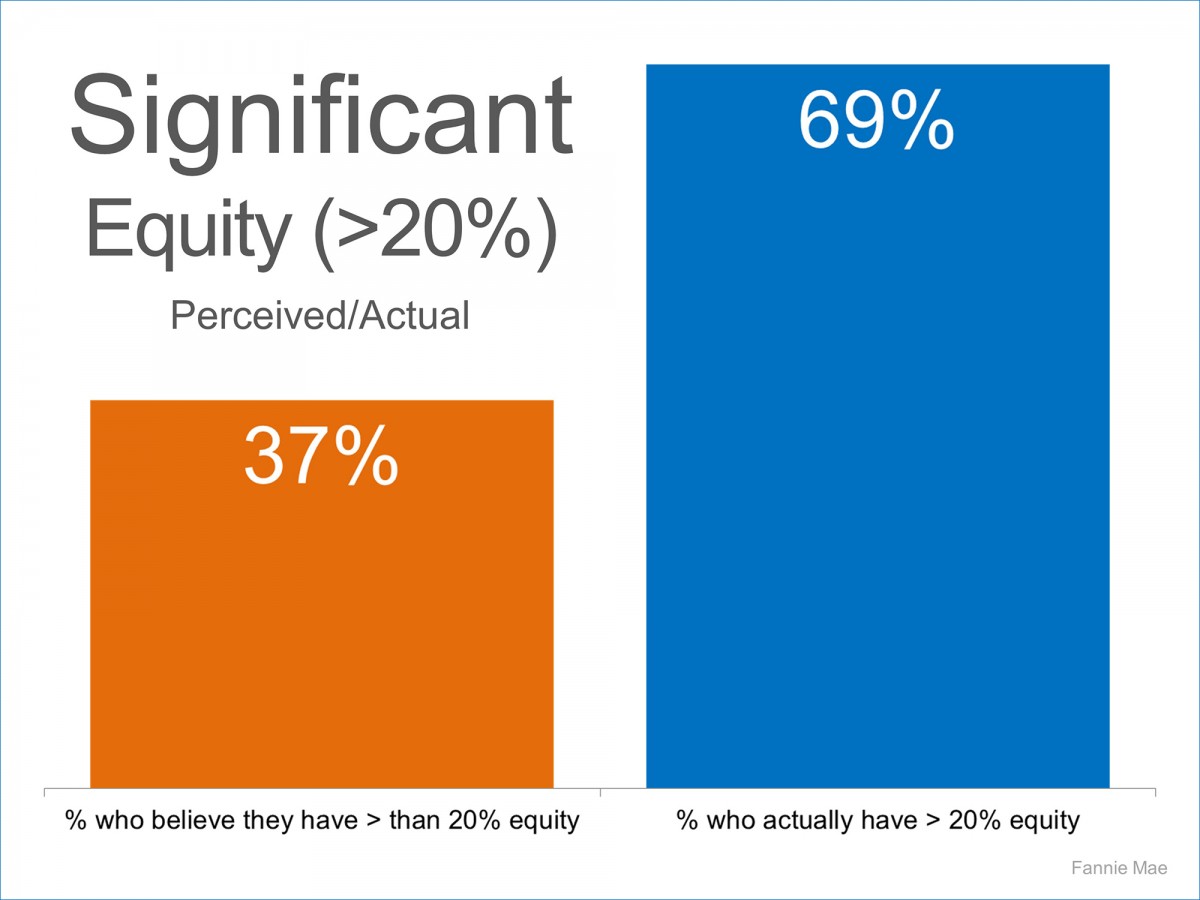
Although it was good that listing activity rose in the third quarter, it still remains well below levels that can be considered normal. This is unlikely to change anytime soon given that over 86% of Washington homeowners with mortgages have an interest rate below 5% and more than a quarter have rates at or below 3%. There is little incentive for them to sell if they don’t have to. More germane to me is the disconnect between what homeowners believe their homes are worth and what buyers can afford with mortgage rates in the mid-7% range. Most sellers appear to be getting their asking prices, or very close to it, which reflects their confidence in the market. However, home buyers are being squeezed by multi-decade high borrowing costs. It is all quite a quandary. However, taking all the factors into consideration, sellers still have the upper hand but not enough to move the needle from the position I put it in last quarter.
ABOUT MATTHEW GARDNER


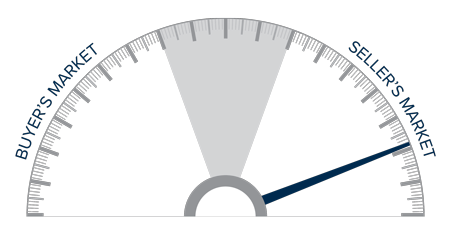


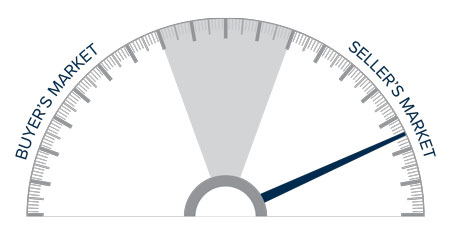
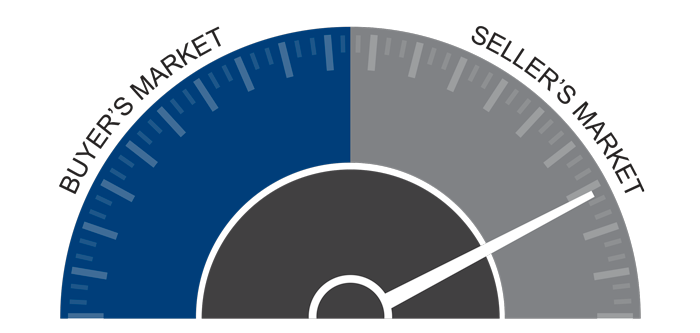
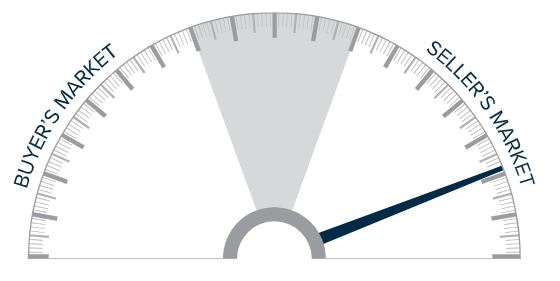 This speedometer reflects the state of the region’s real estate market using housing inventory, price gains, home sales, interest rates, and larger economic factors.
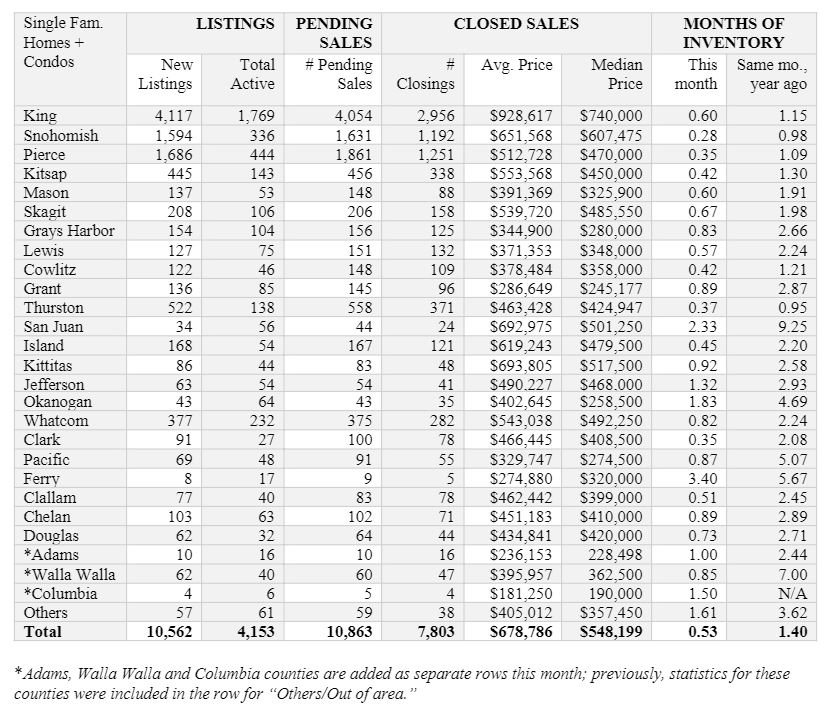


 This speedometer reflects the state of the region’s real estate market using housing inventory, price gains, home sales, interest rates, and larger economic factors.
 As Chief Economist for Windermere Real Estate, Matthew Gardner is responsible for analyzing and interpreting economic data and its impact on the real estate market on both a local and national level. Matthew has over 30 years of professional experience both in the U.S. and U.K.


 This speedometer reflects the state of the region’s real estate market using housing inventory, price gains, home sales, interest rates, and larger economic factors.


 This speedometer reflects the state of the region’s real estate market using housing inventory, price gains, home sales, interest rates, and larger economic factors. I am leaving the needle in the same position as the first and second quarters, as demand appears to still be strong.
 As Chief Economist for Windermere Real Estate, Matthew Gardner is responsible for analyzing and interpreting economic data and its impact on the real estate market on both a local and national level. Matthew has over 30 years of professional experience both in the U.S. and U.K.


 This speedometer reflects the state of the region’s real estate market using housing inventory, price gains, home sales, interest rates, and larger economic factors. I am again moving the needle toward buyers as price growth moderates and listing inventory continues to rise.


 CONCLUSIONS


 This speedometer reflects the state of the region’s real estate market using housing inventory, price gains, home sales, interest rates, and larger economic factors. I started to move the needle toward buyers last quarter and have moved it even further this quarter. Price growth continues to slow, but more significant is the rise in listings, which I expect to continue as we move toward the quieter winter period.


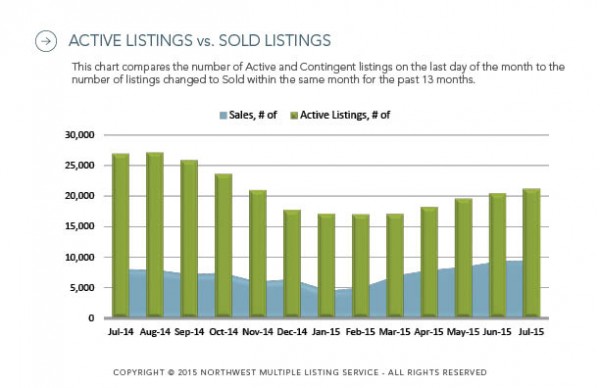
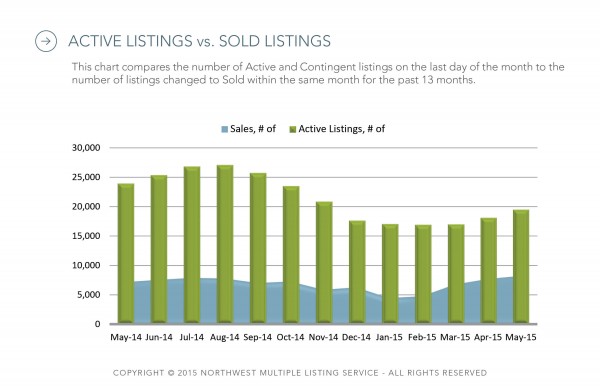


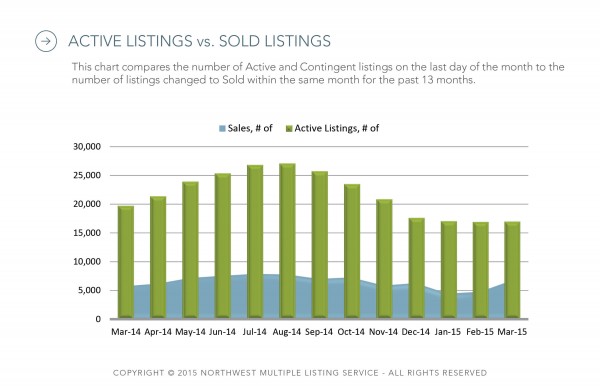


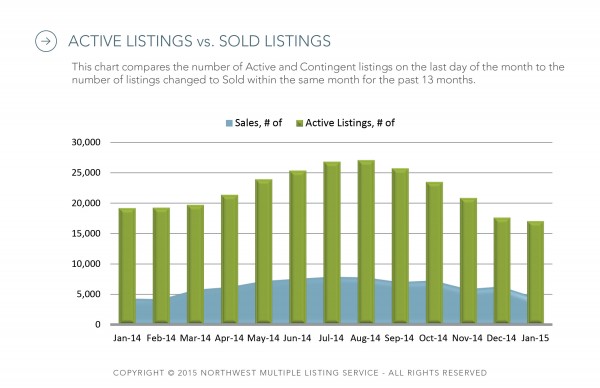


![Active_Sold_414[1]](http://eastsidehomes.com/wp-content/uploads/2014/05/Active_Sold_4141.jpg)
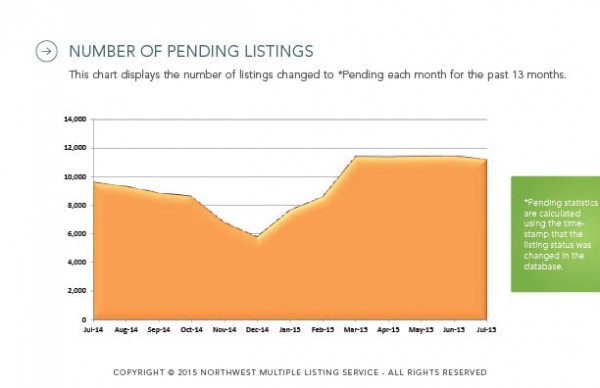
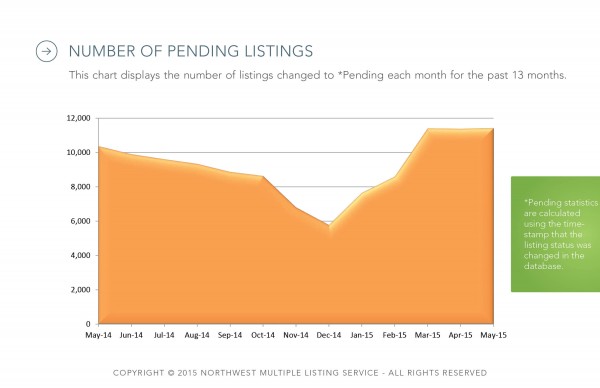
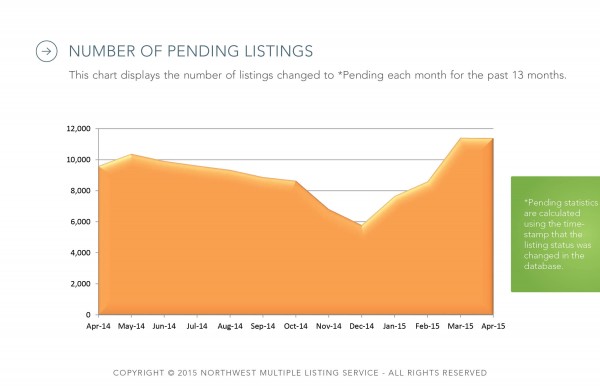
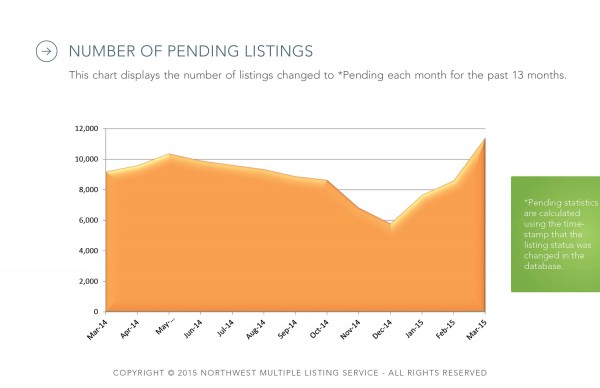
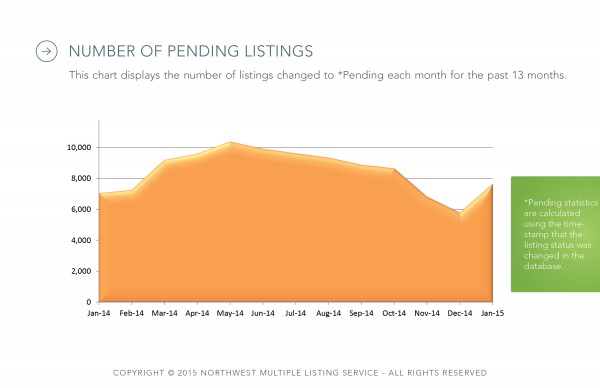
![PendingListings_414[1]](http://eastsidehomes.com/wp-content/uploads/2014/05/PendingListings_4141.jpg)
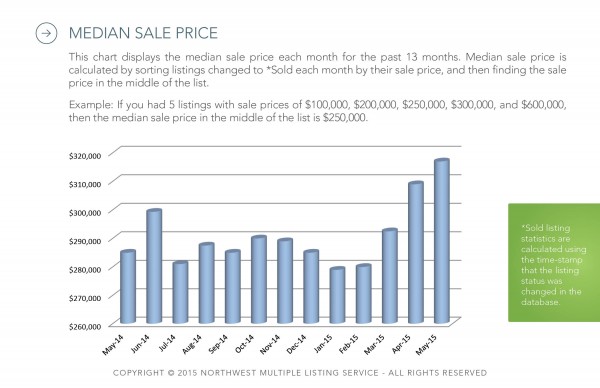
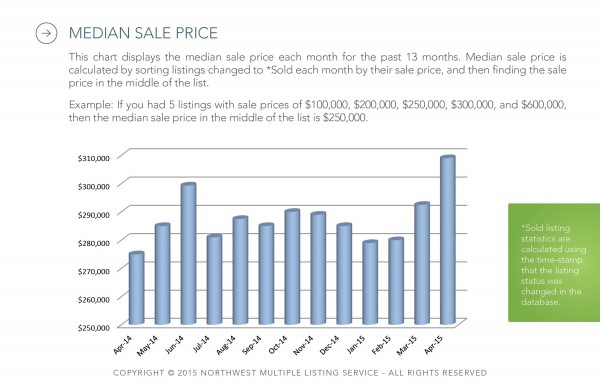
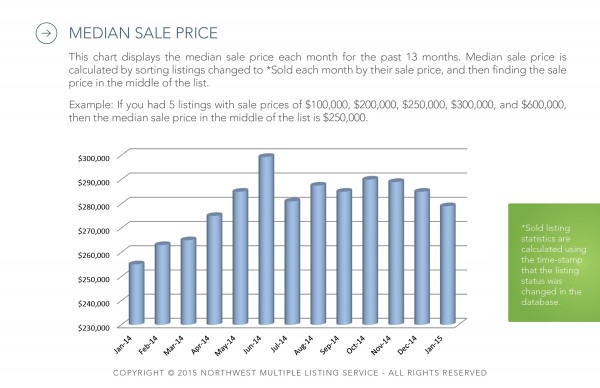
![MedianSalePrice_414[1]](http://eastsidehomes.com/wp-content/uploads/2014/05/MedianSalePrice_4141.jpg)