The Median Is Up but Values Are Not: What Price Per Square Foot Reveals | Seattle’s Eastside Real Estate Update 08-12-26
The Median Is Up but Values Are Not: What Price Per Square Foot Reveals | Seattle’s Eastside Real Estate Update 08-12-26
Tony Meier & Team. 37 years. 804 closed sales. $254M+ in closed volume since 2020.
5 Min. Read Audio Version
Tony Meier | Windermere Real Estate | 37 Years Experience | 800 Closed Eastside Sales
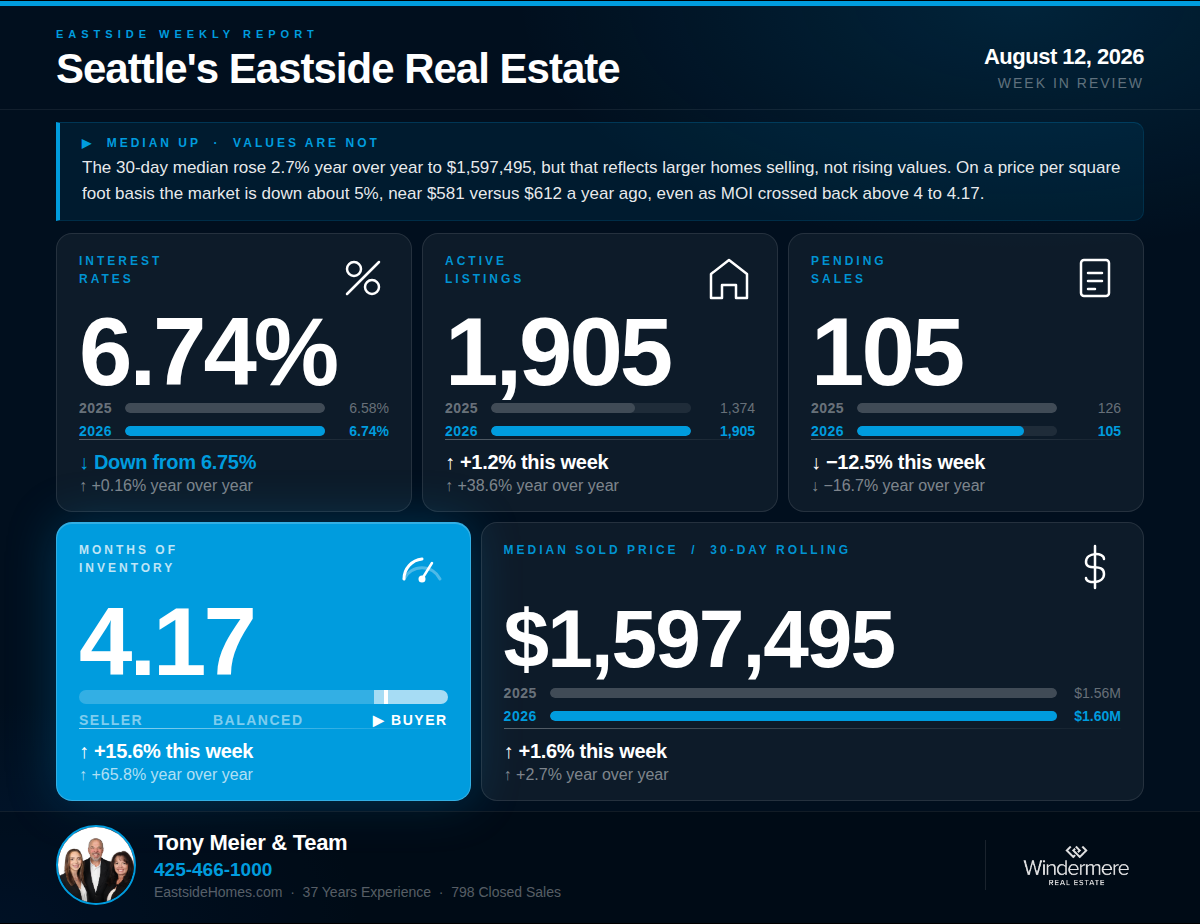
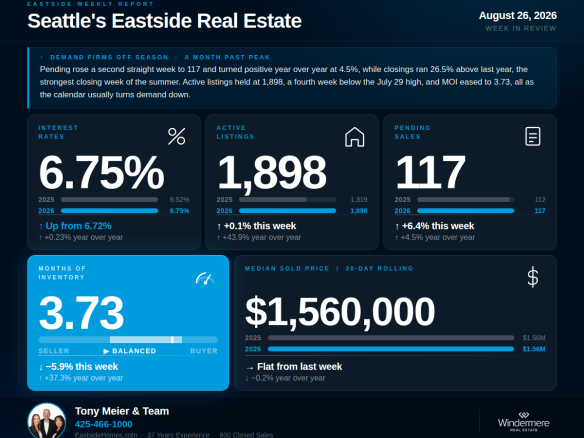
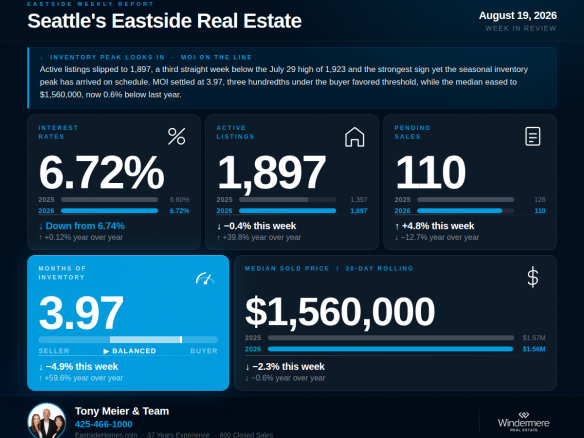
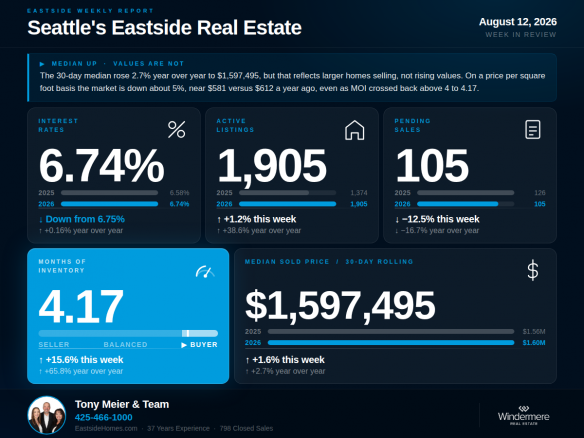
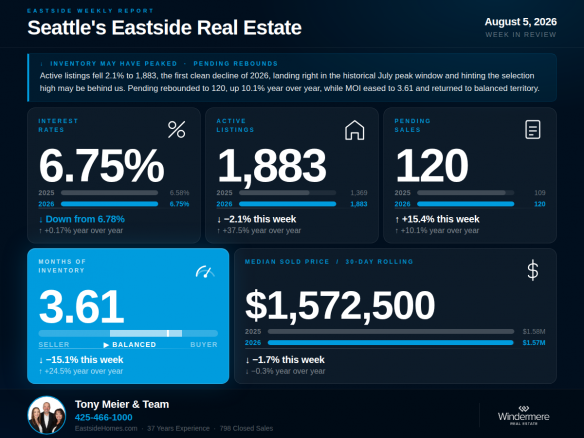
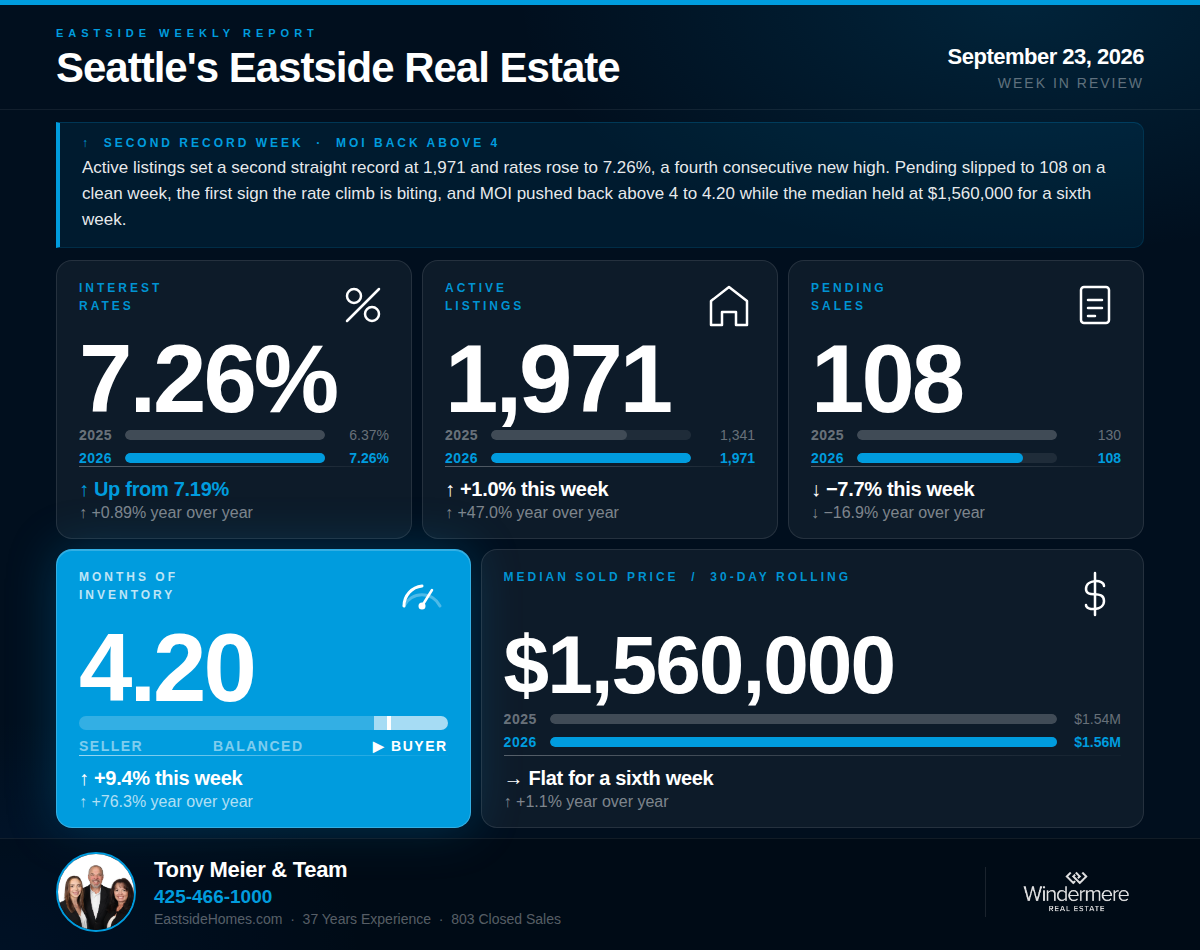
The zigzag pattern that has defined this summer is now unmistakable. For the sixth consecutive week, pending sales reversed direction, falling to 105 after last week's rebound to 120. MOI crossed above 4 for the fifth time this year, landing at 4.17. Active listings rose to 1,905 but stayed below the July 29 high of 1,923, leaving the peak question open. And the 30-day median at $1,597,495 is up 2.7% year over year, the widest positive gap of 2026. The market keeps alternating weeks, but the price story underneath deserves a closer look than the median alone provides.
💰 Interest Rates — 6.74%
↓ Down 1 bp from last week's 6.75% | ↑ Up 0.16% year over year
Rates held essentially flat at 6.74% this week, down 1 basis point from last week. Rates remain 0.16% above the comparable week in 2025, the third consecutive week above year-ago levels. The pre-conflict baseline of 5.99% sits 0.75 points below where rates are today. On a $1.5M home, this week's rate represents roughly $750 more per month in carrying costs than buyers faced in late February.
🏡 Active Listings — 1,905
↑ Up 1.2% from last week | ↑ Up 38.6% year over year
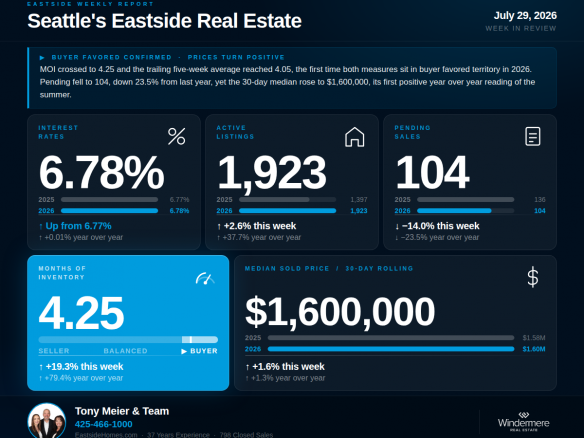
Active listings rose to 1,905 this week, up 1.2% from last week's 1,883 but still below the July 29 reading of 1,923. The peak question remains open. Last week's decline suggested the seasonal top had arrived; this week's partial rebound complicates that read without resolving it. What we can say: 1,923 on July 29 still stands as the 2026 high, and the past two weeks have both come in below it. Year over year, inventory sits 38.6% above the 1,374 recorded during the comparable week in 2025, the widest gap of the year. Whether the peak is in will likely be settled in the next two weeks.
📝 Pending Sales — 105
↓ Down 12.5% from last week | ↓ Down 16.7% year over year
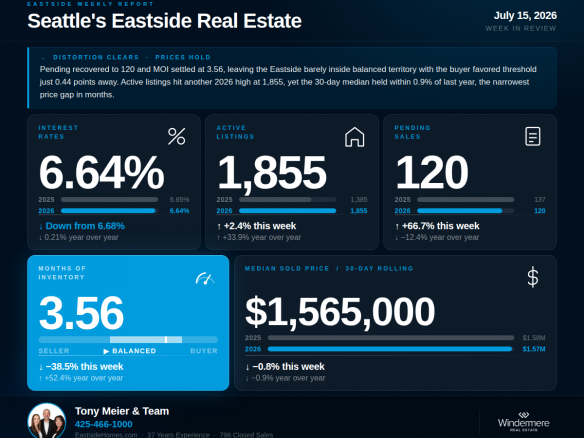
Pending sales fell to 105 this week, down 12.5% from last week's 120 and down 16.7% from the 126 recorded during the comparable week in 2025. The zigzag is now the defining feature of summer demand: 137, 72, 120, 121, 104, 120, 105 over the past seven weeks. No two consecutive weeks have moved in the same direction since June. The trailing five-week average of 114 is the steadier signal, and it describes a demand level running 10 to 15 percent below last year. Buyers are engaging selectively, transacting in bursts, and pulling back between them.
📦 Months of Inventory — 4.17
↑ Up 15.6% from last week's 3.61 | ↑ Up 65.8% year over year
MOI crossed above 4 again this week, landing at 4.17, up 15.6% from last week and 65.8% above the 2.52 recorded during the comparable week in 2025. This is the fifth reading above 4 this year and the fourth since June 24. Each crossing so far has been followed by a pullback, and the market has yet to hold above 4 for consecutive weeks. The five weeks since the July 4 distortion average 3.83, upper balanced territory. The honest description remains what we said last week: this market is oscillating around the boundary between balanced and buyer-favored, tipping over in soft demand weeks and pulling back in stronger ones.
🏠 Median Sold Price (Rolling 30-Day) — $1,597,495
↑ Up 1.6% from last week | ↑ Up 2.7% year over year
The 30-day median rose to $1,597,495 this week, up 1.6% from last week and up 2.7% from the $1,555,000 recorded at this same point in 2025. But the median alone is telling a misleading story this summer, and the appraisal-level data reveals why. The homes selling today are meaningfully larger than a year ago: the median sold home is 2,751 square feet versus 2,550 square feet in the comparable window last year, a 7.9% increase in size. Price per square foot tells the like-for-like story: roughly $581 today versus $612 a year ago, down about 5%. The median is up because the mix of what is selling has shifted toward larger homes, not because values are rising. Supporting that read: average sold price actually declined 1.8% year over year, closed transactions in the 30-day window are down 18%, median days on market stretched from 13 to 15, and homes selling in their first 30 days are now closing at 98.9% of list versus 100% a year ago. Closed sales this week came in at 80, down 26.6% from the 109 recorded during the comparable week in 2025.
🔍 The Big Picture — What This All Means
Step back from the weekly zigzag and the summer has settled into a clearer, and more sobering, shape than the headline median suggests. Demand oscillates week to week but averages 10 to 15 percent below last year. Inventory is 38.6% above last year. MOI keeps testing the buyer-favored threshold. And the price story requires honesty: the median is up 2.7% year over year, but that reflects larger homes selling, not rising values. On a per-square-foot basis, the market is down roughly 5% from a year ago. Buyers today are paying about 2% more than last year's buyers but getting nearly 8% more house. That is what a buyer-leaning market actually looks like in the transaction data: values easing on a like-for-like basis, masked at the headline level by a shift in what sells. August's remaining weeks will answer whether the inventory peak is in and whether demand firms into fall.
🏠 For Sellers
Sellers, this week's data carries a caution: do not price off the headline median. The median is up 2.7% year over year, but that is because larger homes are selling, not because values rose. On a per-square-foot basis, the market is down roughly 5% from last year, average sale prices declined, days on market stretched, and homes are closing just under list rather than at or above it. Pricing to last year's comparable sales, or to the headline median trend, is how listings end up sitting in a market where pending is down 16.7% year over year. The sellers succeeding in this environment are pricing to current per-square-foot reality and presenting well enough to compete against 38.6% more inventory. Done right, homes are still selling in a median of 15 days.
We have done extensive analysis on what this shift means for sellers in each Eastside sub-market and would welcome the opportunity to walk you through what the data shows for your specific area and home.
🔑 For Buyers
Buyers, this week's data quantifies your position better than any headline: on a like-for-like basis, you are paying about 5% less per square foot than buyers a year ago, and the typical purchase is nearly 8% more house for only 2% more money. MOI back above 4, selection near its 2026 high, sellers conceding on list price for the first time in years, and negotiating time that has stretched from 13 to 15 median days on market. Two cautions remain. Selection may have peaked, with active listings holding below the July 29 high for two weeks. And rates at 6.74% are the real constraint on affordability, so stress-testing your qualification remains the essential first step. But the value story has turned in your favor, and the transaction data now proves it.
If we can help you think through what this means for your move, we are here.
Tony Meier & Team — Windermere Real Estate / NE, Kirkland, WA
Thinking about a move on the Eastside?
Tony Meier & Team has closed 804 residential transactions with $254M+ in volume since 2020. Whether you are six months out or just curious about your home’s value, we would be glad to help you think it through.
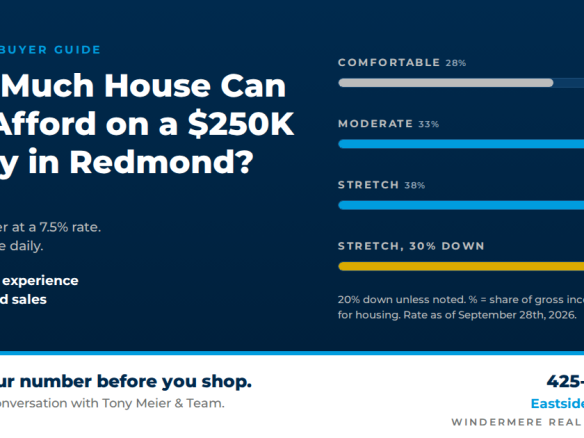
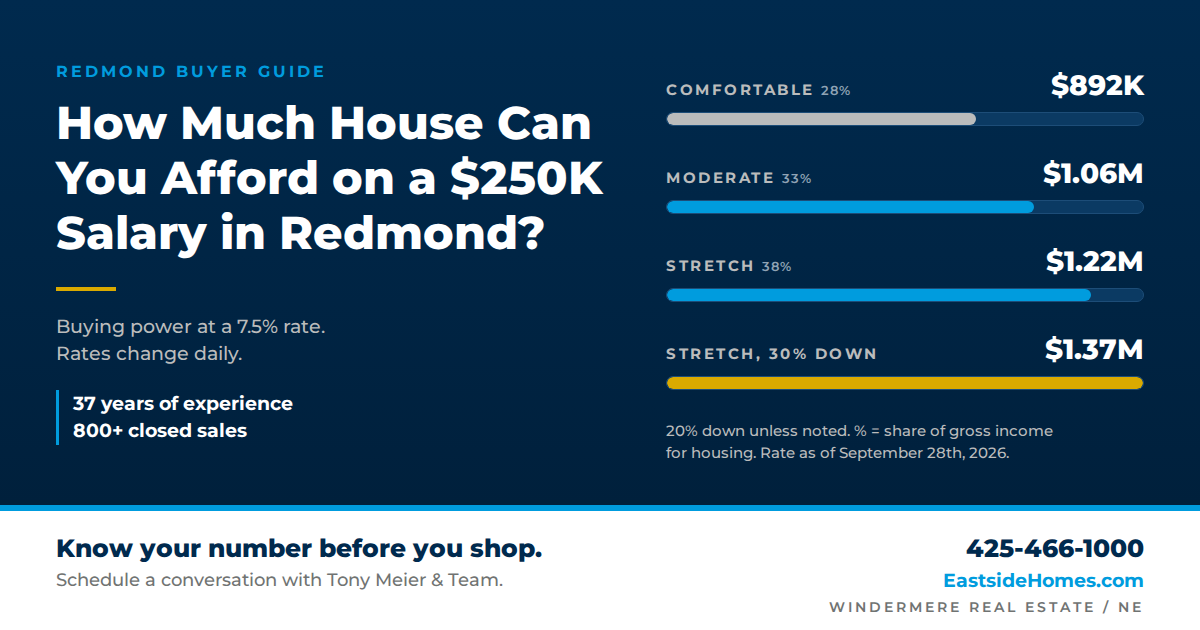
On a $250,000 salary with 20% down and rates near 7.5%, most buyers can comfortably afford a Redmond home between about $890,000 and $1.06 million. Here's the math, and what changes it.
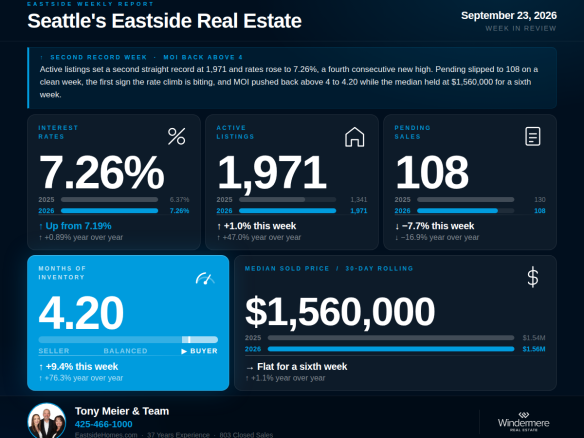
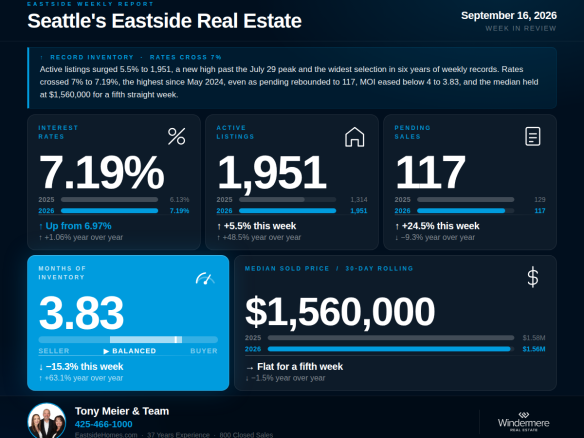
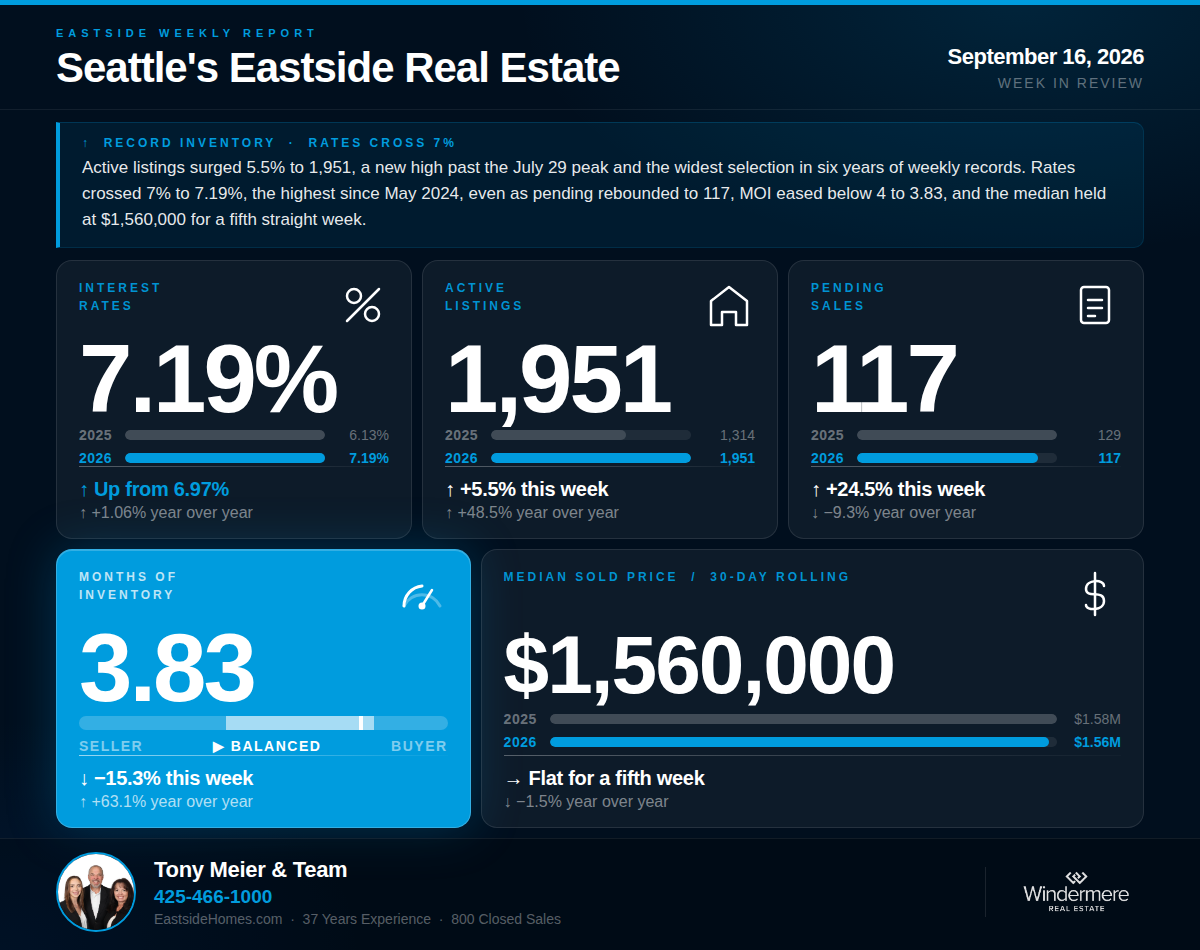
Active listings surged to 1,951, a new 2026 high seven weeks after the July peak and the highest weekly count in six years of tracking, while rates crossed 7% for the first time since May 2025, landing at 7.19%, up 1.06% year over year. Record selection meets the most expensive financing in 28 months.
Northwest MLS launches First Look September 4, 2026. How the new 21-day listing status works, what changed about days on market, and what it means for you.
The 30-day median is up 2.7% year over year, but price per square foot is down about 5%. Larger homes are selling, masking a like-for-like value decline. Pending fell to 105, MOI crossed above 4 for the fifth time this year, and the inventory peak question remains open.
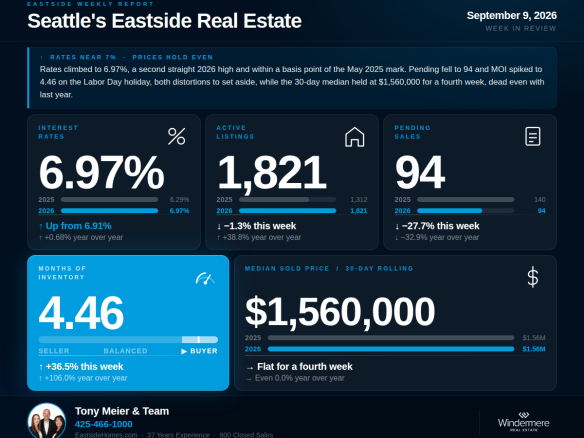
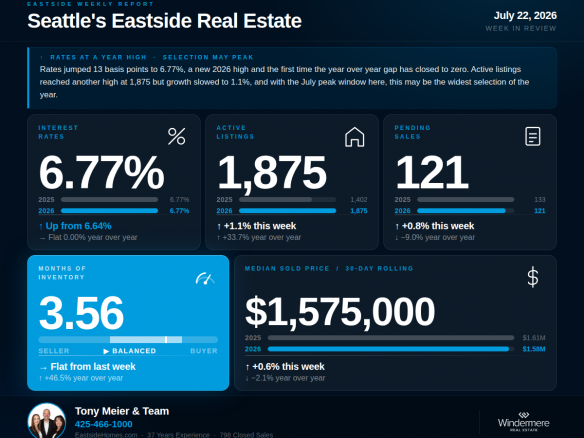
Rates jumped to 6.77%, a new 2026 high and the highest in nearly a year — the last time they were higher was July 28, 2025. The buyer's year-over-year rate advantage has closed to zero. Meanwhile inventory growth slowed sharply as the July peak window arrives, meaning selection may be peaking too.
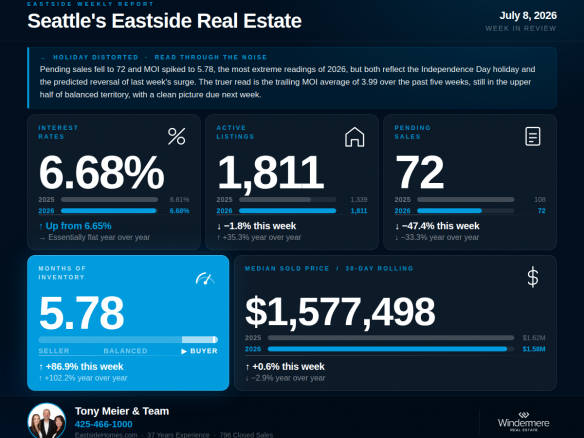
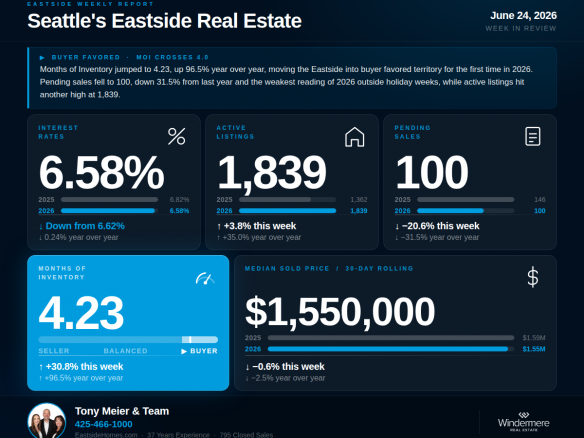
This week's headline numbers are the most extreme readings of 2026, but they arrive with the Independence Day holiday firmly stamped on them. Pending fell to 72, MOI jumped to 5.78, and active listings declined for the first time all year. A clean read of underlying market conditions will not be available until next week.
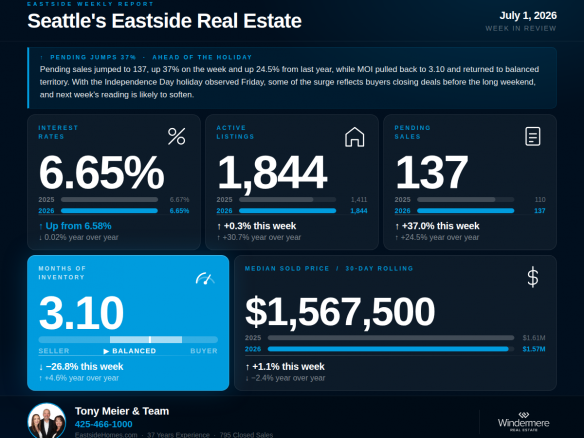
Pending sales jumped 37% this week to 137, MOI pulled back to 3.10 returning to balanced territory, and active listings barely grew for the first time all year. But pre-holiday timing complicates the read, and next week's Independence Day suppression is likely to reverse the pending signal.
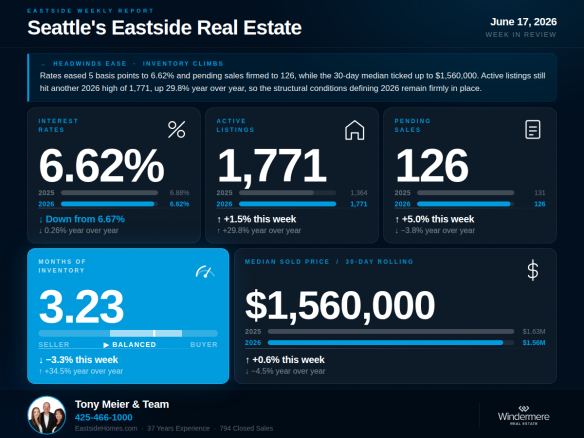
The data this week reads in mixed directions: rates eased to 6.62%, pending sales firmed modestly to 126, and active listings climbed to 1,771 — another 2026 high. Four short-term signals moved in sellers' favor this week, but the structural conditions defining 2026 remain in place.
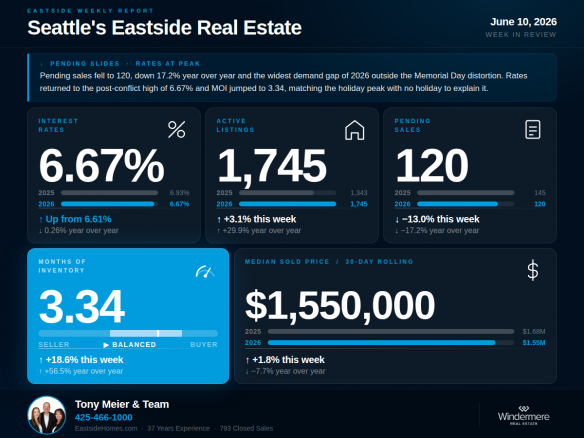
Three signals converged this week: pending sales fell sharply with the YOY gap widening to -17.2%, rates returned to the post-conflict high of 6.67%, and Months of Inventory jumped to 3.34 — the second-highest weekly reading of 2026, this time without holiday distortion to explain it.