Tony Meier | Windermere Real Estate | 37 Years Experience | 800 Closed Eastside Sales
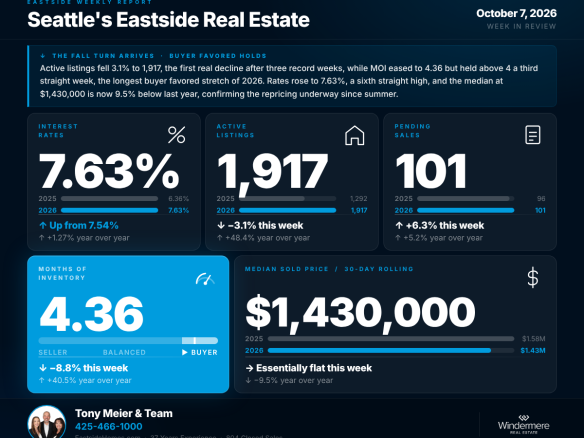
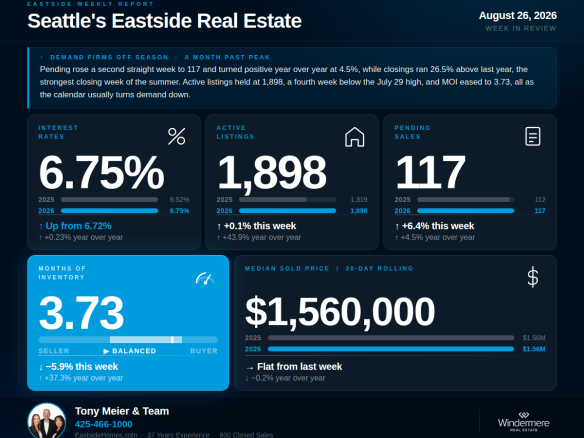
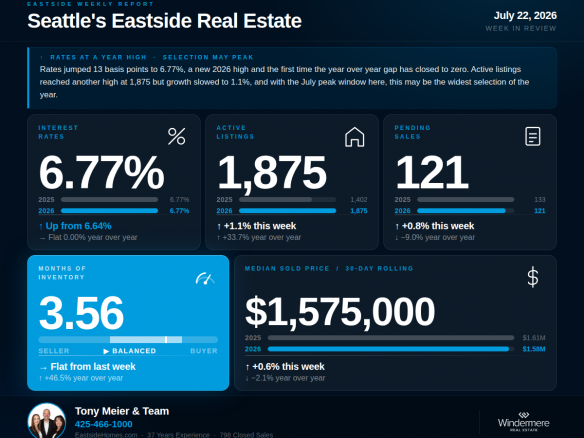
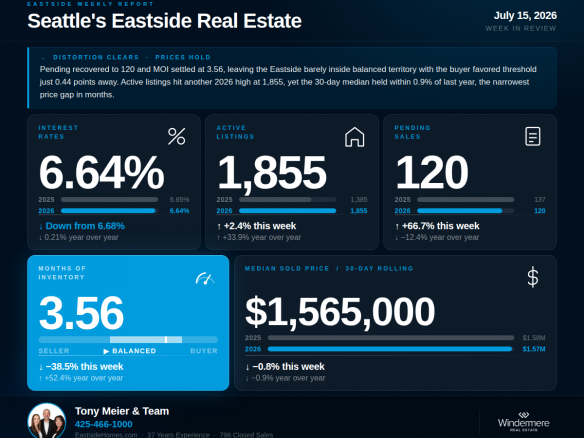
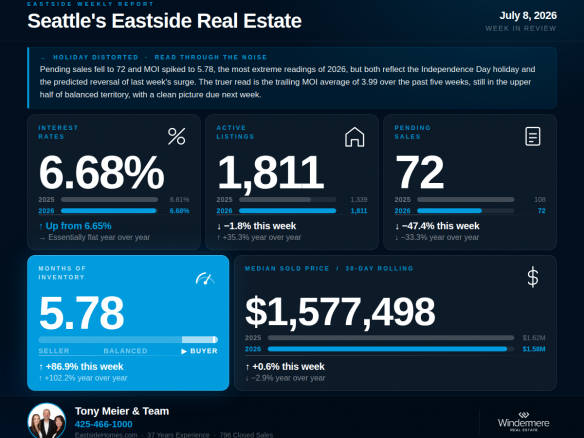
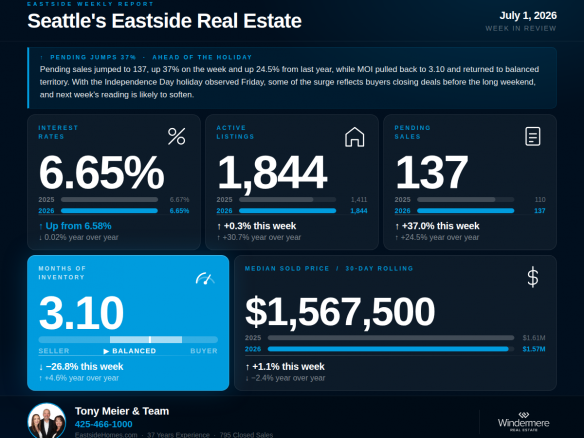
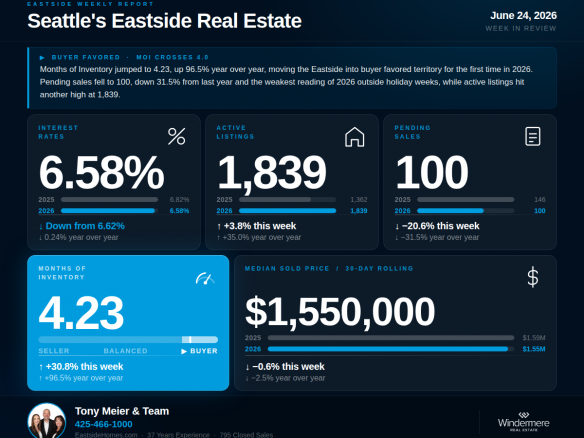
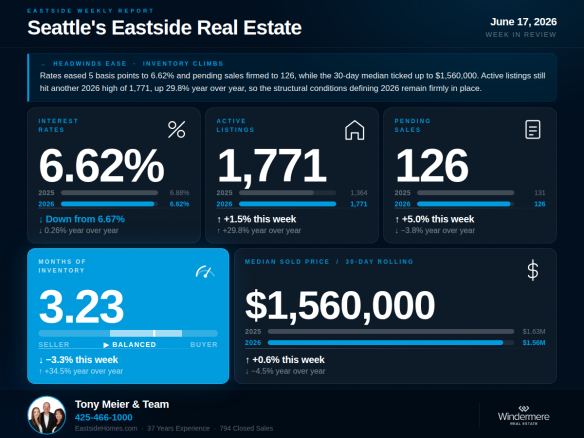
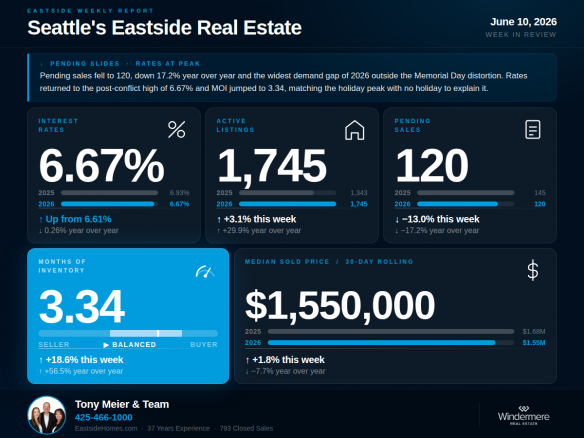
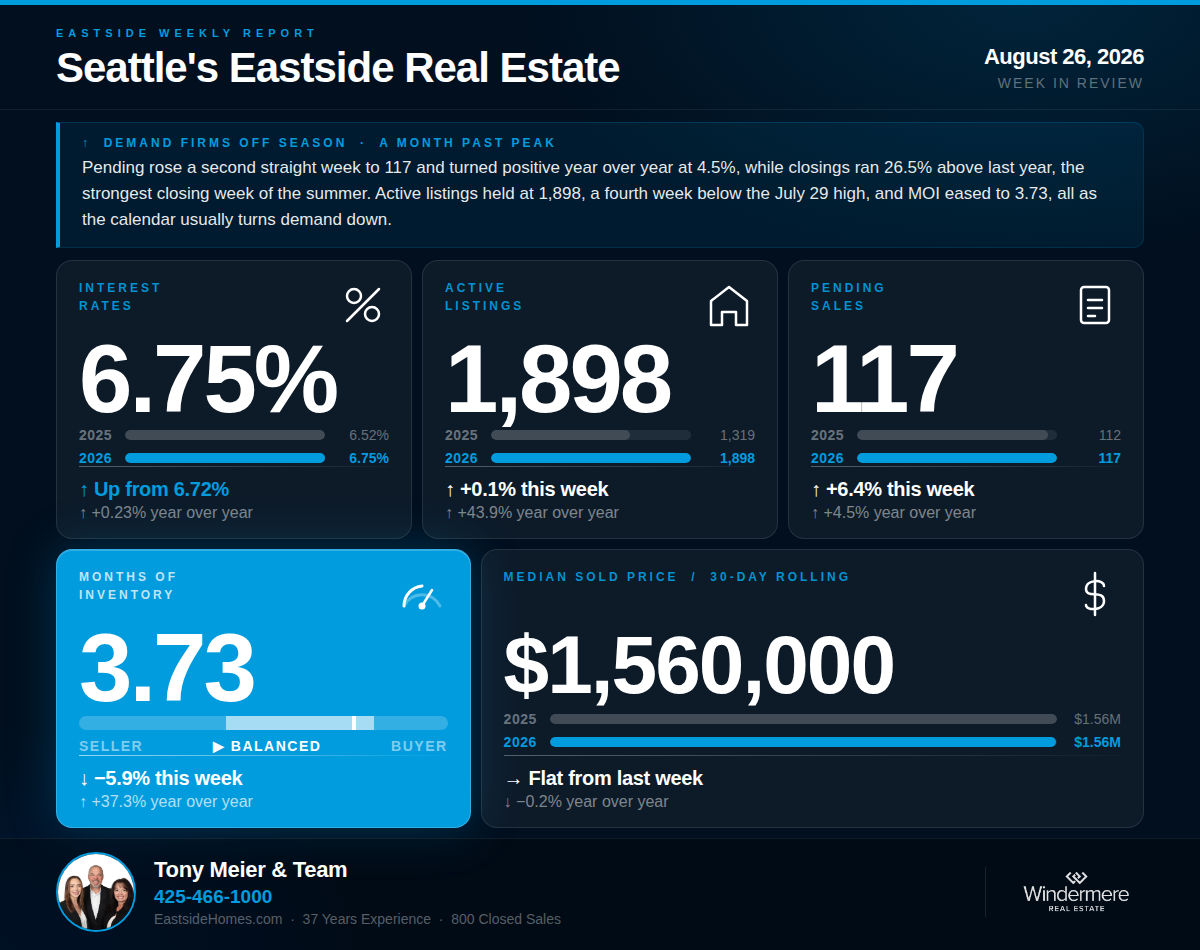
For the first time since mid-July, the weekly zigzag broke, and it broke at a point in the calendar when demand usually fades. Pending sales rose a second consecutive week to 117 and turned positive year over year at 4.5%. Closed sales came in 26.5% above last year, the strongest closing week of the summer. MOI eased a second straight week to 3.73. Active listings held flat at 1,898, a fourth consecutive week below the July 29 high. Rates ticked back up to 6.75%. The firming is modest, but its timing is what makes it worth attention, because the seasonal script from here calls for demand to flatten and selection to shrink into winter.
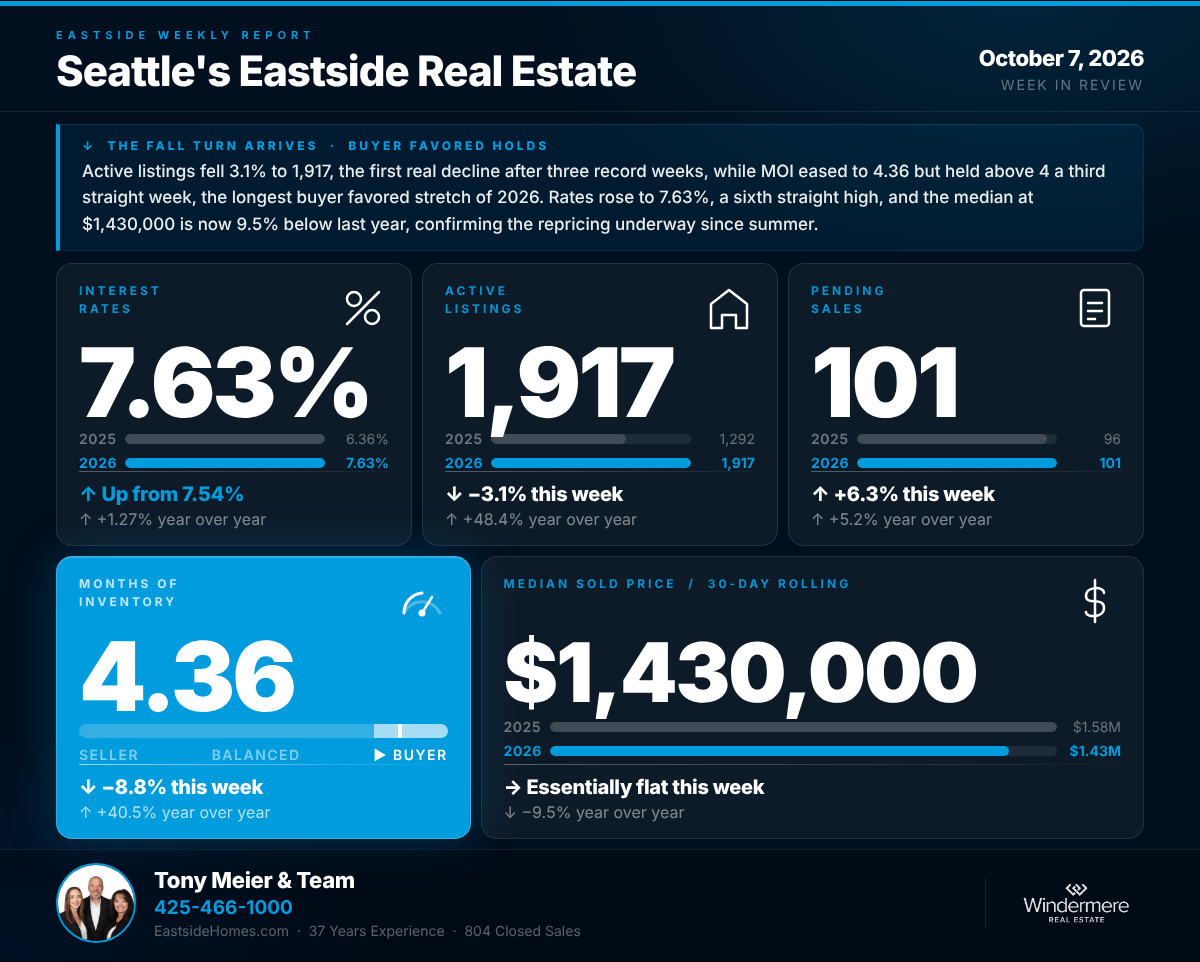
💰 Interest Rates — 6.75% | ↑ Up 3 bp from last week's 6.72% | ↑ Up 0.23% year over year
Rates ticked up to 6.75% this week, up 3 basis points from last week, ending three consecutive weeks of easing. Rates remain 0.23% above the comparable week in 2025, the fifth consecutive week above year-ago levels. The pre-conflict baseline of 5.99% sits 0.76 points below where rates are today. On a $1.5M home, this week's rate represents roughly $760 more per month in carrying costs than buyers faced in late February.
🏡 Active Listings — 1,898 | ↑ Up 0.1% from last week | ↑ Up 43.9% year over year
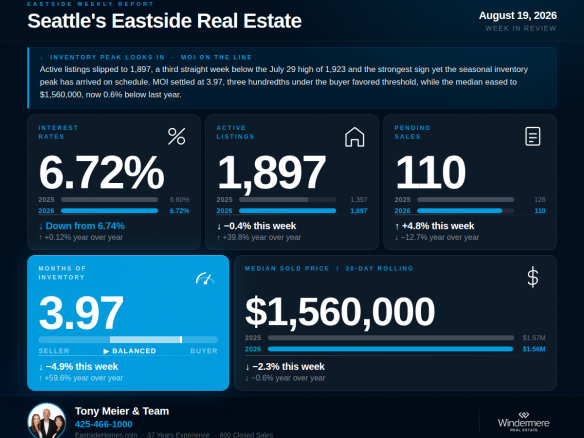
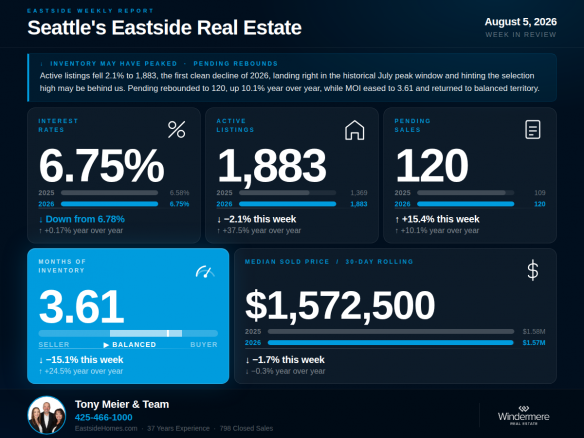
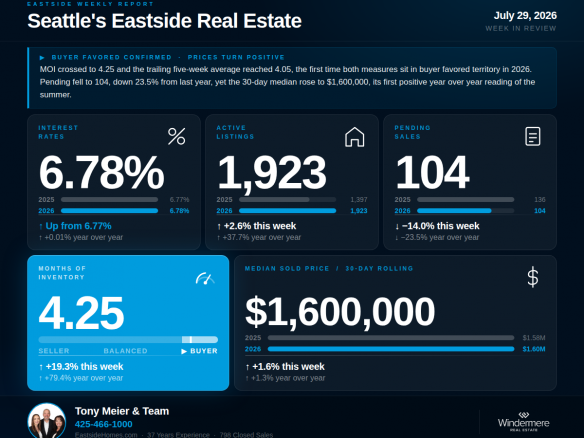
Active listings held essentially flat at 1,898 this week, up 0.1% from last week and a fourth consecutive week below the July 29 high of 1,923. A month past the high, the peak case is close to settled, and it matters for what comes next: in the historical pattern, once the July top is in, active listings decline through fall and reach their winter low around the holidays. Selection from here typically only shrinks. One number needs careful reading: the year-over-year gap widened to 43.9%, the largest of 2026, but not because this year's count is growing. Last year's count was falling faster at this point than this year's has so far. Both years are past peak; 2026 is simply carrying more inventory into fall.
📝 Pending Sales — 117 | ↑ Up 6.4% from last week | ↑ Up 4.5% year over year
Pending sales rose to 117 this week, up 6.4% from last week's 110 and up 4.5% from the 112 recorded during the comparable week in 2025. It is the second consecutive weekly increase, the first back-to-back gains since mid-July, and a positive year-over-year reading on a clean calendar week. Here is the context that frames it: over the past five years, September pending has come in flat to lower than late August in most years, and October lower still in four of the five. Demand rising now, at the point the calendar usually turns it down, is the more meaningful version of this signal. Closed sales add support: 105 this week, up 26.5% from the 83 recorded during the comparable week in 2025, the best year-over-year closing comparison of the summer.
📦 Months of Inventory — 3.73 | ↓ Down 5.9% from last week's 3.97 | ↑ Up 37.3% year over year
MOI eased to 3.73 this week, down 5.9% from last week's 3.97 and 37.3% above the 2.72 recorded during the comparable week in 2025. This is the second consecutive weekly decline, and the trailing five-week average sits at 3.95. Looking ahead, MOI becomes a race between two lines: inventory declines through autumn while demand typically flattens then eases. In each of the past five years, September MOI held essentially level with late August; the later-fall direction has varied year to year with the balance of those two forces. The market enters that stretch from upper balanced territory, right below the buyer-favored line it has tested five times this year without holding.
🏠 Median Sold Price (Rolling 30-Day) — $1,560,000 | → Flat from last week | ↓ Down 0.2% year over year
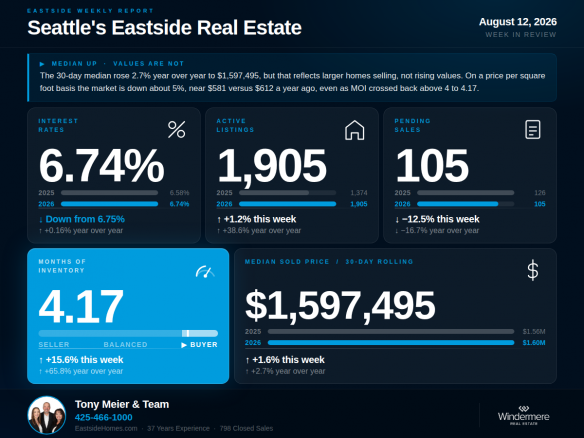
The 30-day median held at $1,560,000 this week, unchanged from last week and 0.2% below the $1,563,718 recorded at this same point in 2025. The headline median has converged with last year, and as we detailed two weeks ago, per-square-foot values continue to run about 5% softer, with larger homes doing more of the transacting. Flat is the honest one-word summary of Eastside pricing heading into fall.
🔍 The Big Picture — What This All Means
The seasonal map from here is well established: inventory declines from its July peak through the holidays, demand flattens through September and eases in October, and the market gradually narrows until the spring reset. What this week's data shows is the Eastside entering that stretch with demand firming rather than fading, closings accelerating, and MOI drifting toward balance. That combination does not guarantee a strong fall, and this summer punished every extrapolation from short trends. But the setup is different from what the raw MOI number implies. A buyer-leaning market on paper is entering the season when its defining feature, abundant selection, historically erodes week by week. Whichever side of a transaction you are on, the next eight to ten weeks are the window in which this year's unusual inventory advantage gradually normalizes.
🏠 For Sellers
Sellers, the calendar is turning in your favor for the first time this year. Your competition peaked a month ago and historically declines from here through winter, while this week showed demand firming at a moment it usually fades. If you are planning a fall listing, the window between Labor Day and mid-October is historically the best remaining stretch of the year, before demand eases and the holiday slowdown arrives. The pricing bar has not moved: values are flat at the headline and softer per square foot, and buyers still have 43.9% more choices than a year ago. But a well-priced, well-presented home is entering an improving competitive environment for the first time since spring.
We have done extensive analysis on what this shift means for sellers in each Eastside sub-market and would welcome the opportunity to walk you through what the data shows for your specific area and home.
🔑 For Buyers
Buyers, this is the moment to be honest about the calendar. The selection advantage you hold today, 43.9% more inventory than last year, is at or near its high-water mark for this cycle. History says active listings decline from here through winter, and this week showed demand firming while your competition for homes ticked up. None of that erases your leverage: MOI at 3.73 remains upper balanced, most listings face limited competition, and per-square-foot values sit below last year. But the trade you are weighing is no longer leverage versus more selection later. It is leverage now versus less selection later. If the right home is on the market today, the data argues for acting rather than waiting. Keep your qualification current at 6.75%.
If we can help you think through what this means for your move, we are here.
Tony Meier & Team — Windermere Real Estate / NE, Kirkland, WA