Short answer: On the Eastside right now, the typical home sells for about 2% below its final asking price. Across 1,455 sales from July 8th to October 5th, 2026, the median home closed at
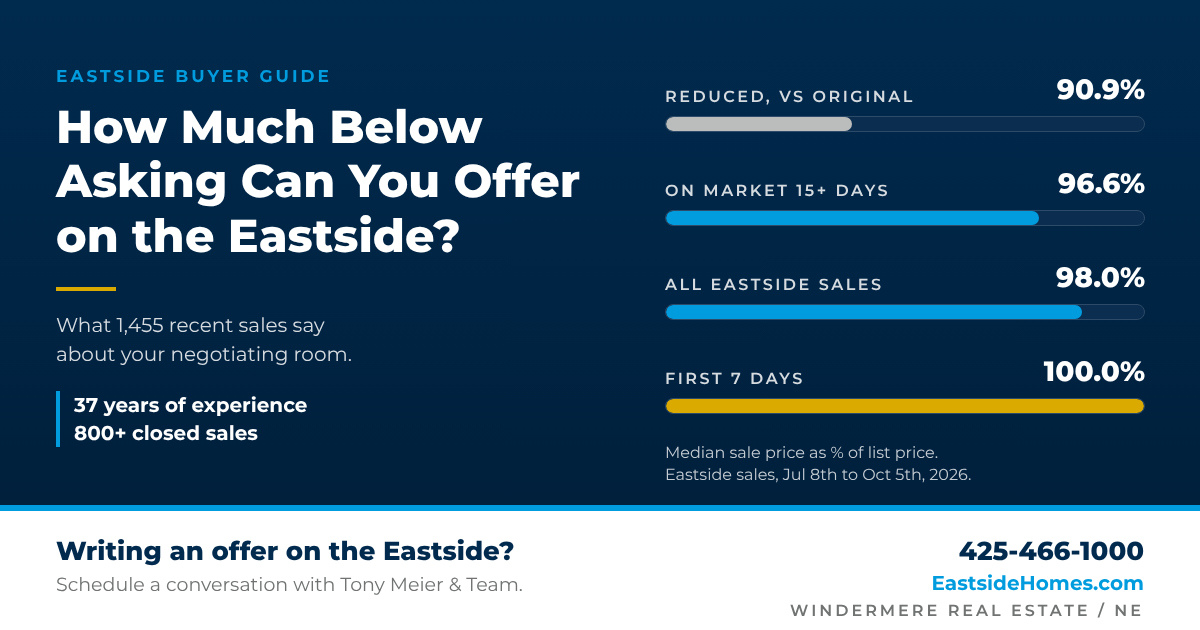
98.0% of list price, and 64% sold below list. But that average hides two very different markets. Homes that went pending in their first 7 days sold at
100% of list, and 28% of them sold
over asking. Homes on the market 15 days or longer sold at a median
96.6% of list, and more than 80% of them sold under asking. How much you can offer below asking depends far more on how long the home has been on the market than on any rule of thumb.
If you have asked ChatGPT or another AI tool "how much below asking should I offer?", you probably got a general answer built on national averages. This post answers the same question with local numbers from Eastside Market Watch, Tony Meier & Team's daily database of every NWMLS listing on the Eastside (NWMLS Areas 500 to 600: Bellevue, Mercer Island, Issaquah and Sammamish, Redmond, Kirkland, Woodinville, and the surrounding area).
How Many Eastside Homes Sell Below Asking?
Today's market gives buyers more room than a year ago. More homes are selling below list, and the typical discount on those homes is larger.
| Eastside sales (90 days) |
Jul 8th to Oct 5th, 2026 |
Same period, 2025 |
| Homes sold |
1,455 |
1,509 |
| Median sale price as % of final list price |
98.0% |
98.8% |
| Sold below list |
64.0% |
56.5% |
| Sold at list |
23.6% |
26.4% |
| Sold above list |
12.4% |
17.0% |
| Typical discount, when a home sold below list |
3.7% |
3.2% |
So the honest answer to "how much of a discount can I get?" is: on the homes that sell under asking, the typical discount is just under 4%. It is not the 10% or 15% that buyers sometimes hope for, and on a fresh, well priced home there may be no discount at all.
Time on Market Is the Biggest Factor
The single best predictor of your negotiating room is Cumulative Days Active (CDA), the number NWMLS now reports in place of the old "days on market." Here is how Eastside sales break down:
| Cumulative Days Active (CDA) |
Homes sold |
Median % of final list |
Median % of original list |
Sold below list |
Sold above list |
| 0 to 7 days |
429 |
100.0% |
100.0% |
25.4% |
28.2% |
| 8 to 14 days |
161 |
98.2% |
98.0% |
67.1% |
13.0% |
| 15 to 30 days |
208 |
96.9% |
95.9% |
80.3% |
3.8% |
| 31 to 60 days |
275 |
96.8% |
94.6% |
81.8% |
5.5% |
| 61+ days |
381 |
96.2% |
92.6% |
84.3% |
4.2% |
Three takeaways from this table:
- The first week is still competitive. Nearly 3 in 10 Eastside sales went pending within 7 days, and more of those sold over asking (28%) than under it (25%). A lowball offer on a new listing that is priced right usually loses to another buyer.
- The room opens up after two weeks. Once a home passes 14 days, more than 80% sell below list, at roughly 96% to 97% of the current asking price.
- The original price matters too. Homes on the market more than 60 days closed at a median 92.6% of their original list price. Much of that discount came from price reductions before the offer, not from the negotiation itself.
Price Reductions Tell You Where the Seller Is
Of the 1,455 recent sales, 386 (26.5%) had at least one price reduction before they sold. Those homes closed at a median 96.6% of their reduced price and 90.9% of their original price. Homes that never cut their price closed at a median 98.7% of list.
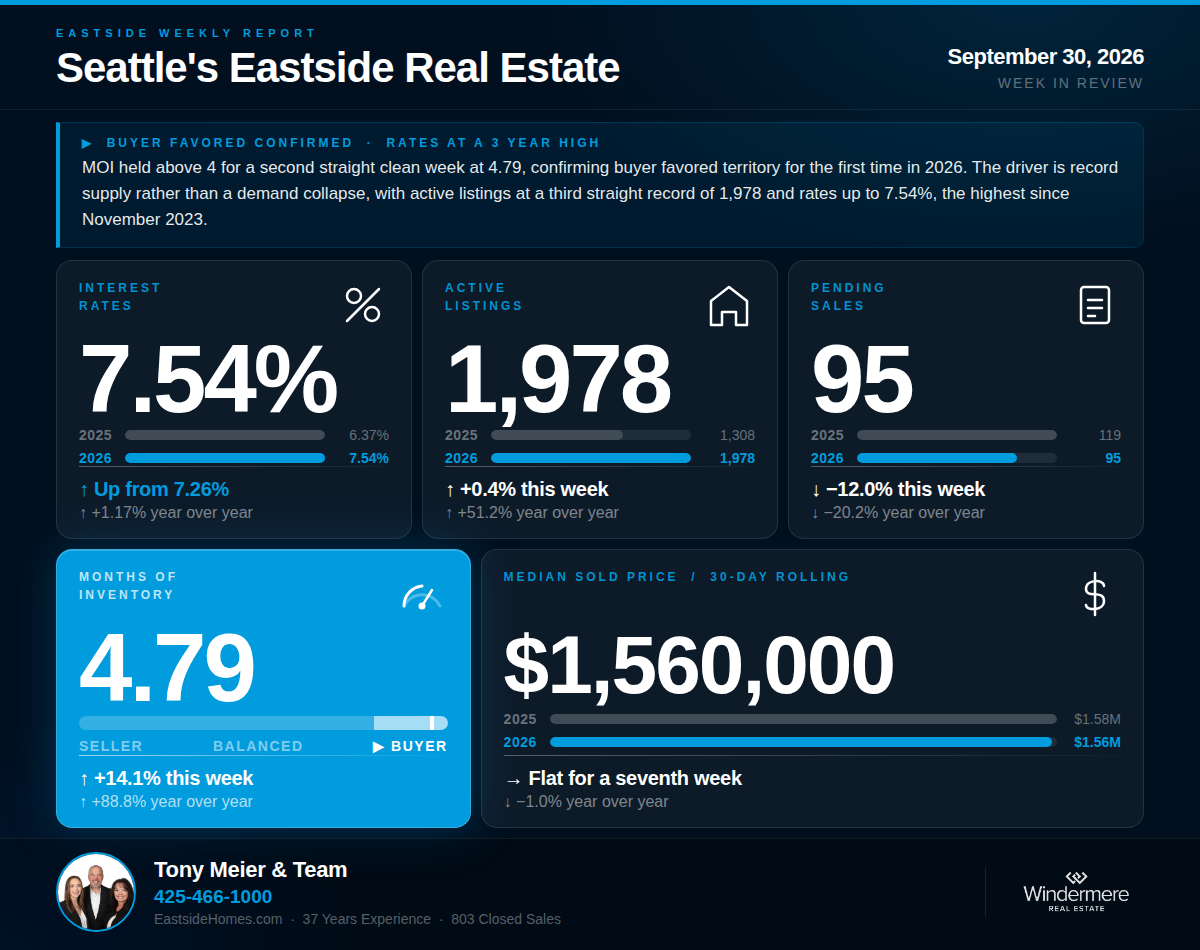
Right now, 534 of the 1,937 active Eastside listings (27.6%) have reduced their price in the last 30 days. A recent reduction is a signal that the seller is adjusting to the market, but it also means part of the discount has already been given. Your offer should be built on what comparable homes actually sold for, not just on how far the price has already moved.
Discounts by Eastside Area
| NWMLS Area |
Homes sold |
Median % of list |
Sold below list |
Typical discount when below |
Median % of list, 15+ days |
| 500 South of I-90 (Issaquah, Sammamish south) |
181 |
98.6% |
59.1% |
3.7% |
96.5% |
| 510 Mercer Island* |
59 |
98.4% |
57.6% |
3.7% |
95.5% |
| 520 West Bellevue* |
71 |
96.7% |
76.1% |
4.7% |
94.9% |
| 530 East Bellevue |
168 |
98.3% |
60.1% |
3.6% |
96.5% |
| 540 East of Lake Sammamish |
346 |
98.0% |
66.5% |
3.8% |
96.4% |
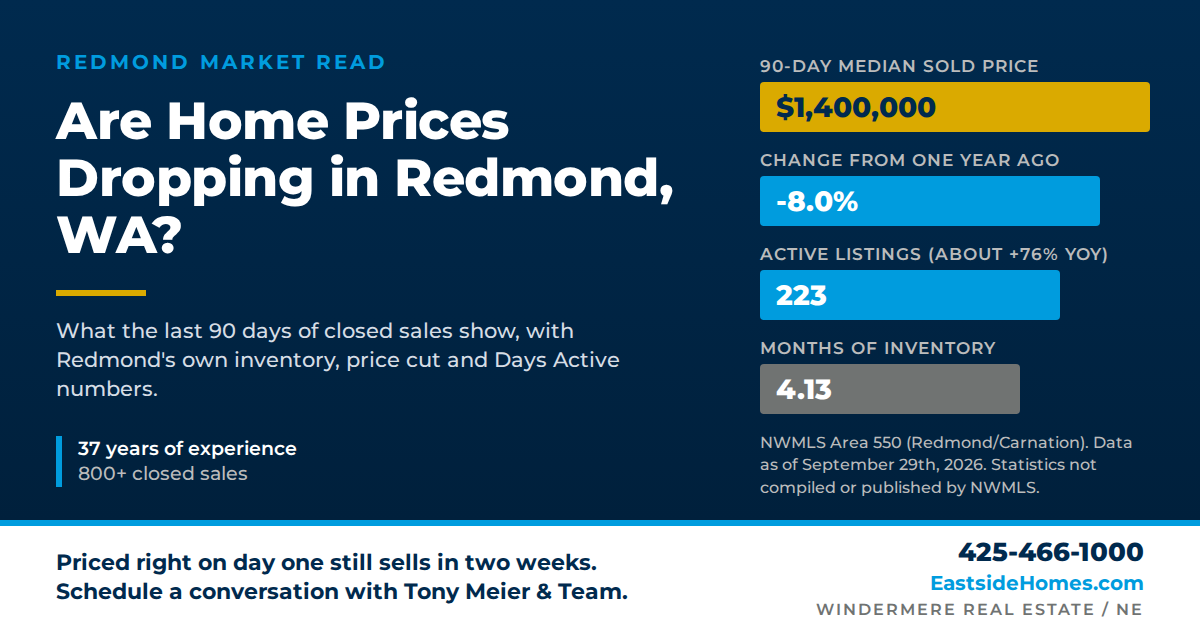
| 550 Redmond and Carnation |
142 |
97.4% |
66.9% |
3.6% |
96.7% |
| 560 Kirkland and Bridle Trails |
178 |
97.3% |
70.2% |
4.0% |
96.0% |
| 600 Juanita and Woodinville |
310 |
98.3% |
59.7% |
3.4% |
97.3% |
*Fewer than 75 sales in 90 days, so read these with more caution. In every area, homes that went pending within 7 days sold at a median 100% of list.
West Bellevue and Kirkland show the most negotiating room right now. Juanita and Woodinville, along with the area south of I-90, are the firmest.
Discounts by Price Range
| Sale price |
Homes sold |
Median % of list |
Sold below list |
Typical discount when below |
| Under $1M |
280 |
98.5% |
58.6% |
3.5% |
| $1M to $1.5M |
484 |
98.2% |
63.6% |
3.5% |
| $1.5M to $2M |
308 |
97.9% |
65.3% |
3.3% |
| $2M to $3M |
233 |
97.5% |
69.1% |
4.6% |
| $3M and up |
150 |
97.3% |
64.7% |
4.8% |
Above $2 million, the typical discount on homes that sell under asking grows to nearly 5%. Fewer buyers compete at that level, so a well researched offer carries more weight.
Why There Is More Room Than Last Year
| Eastside market |
Now (Oct 5th, 2026) |
1 month ago |
1 year ago |
| Active listings |
1,937 |
1,877 |
1,266 |
| Median active list price |
$1,650,000 |
$1,650,000 |
$1,785,000 |
| Median sold price (trailing 30 days) |
$1,425,000 |
$1,399,988 |
$1,537,000 |
| Months of inventory |
4.5 (Buyer's Market) |
3.9 (Balanced) |
2.6 (Balanced) |
| 30 year fixed rate (Mortgage News Daily) |
7.61% |
6.89% |
6.24% |
Active listings are up 53% from a year ago, the median sold price is down 7.3%, and months of inventory has crossed into buyer's market territory. Rates were 7.56% on October 6th, 2026, and they change daily. Higher rates mean fewer competing buyers, which is a big part of why the negotiating room has grown. For more on the shift, see
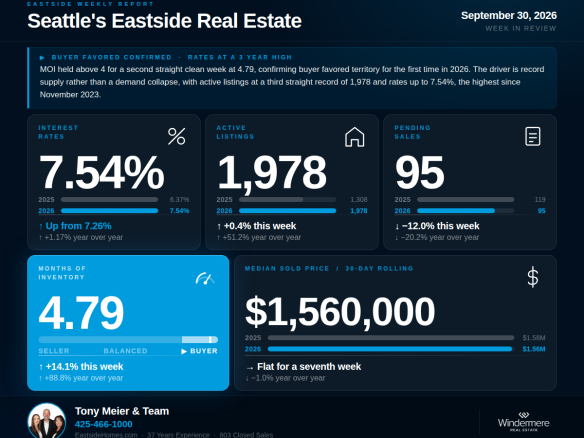
our September 30th market update and
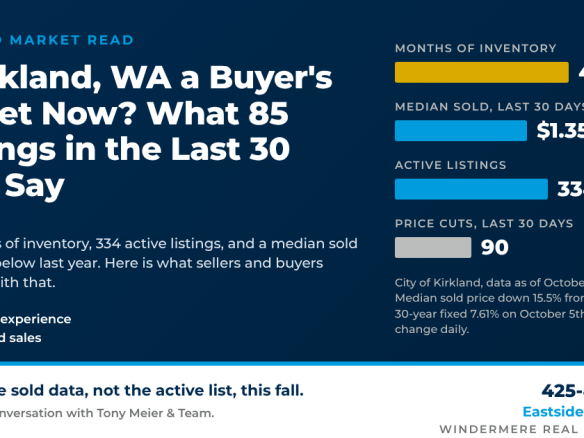
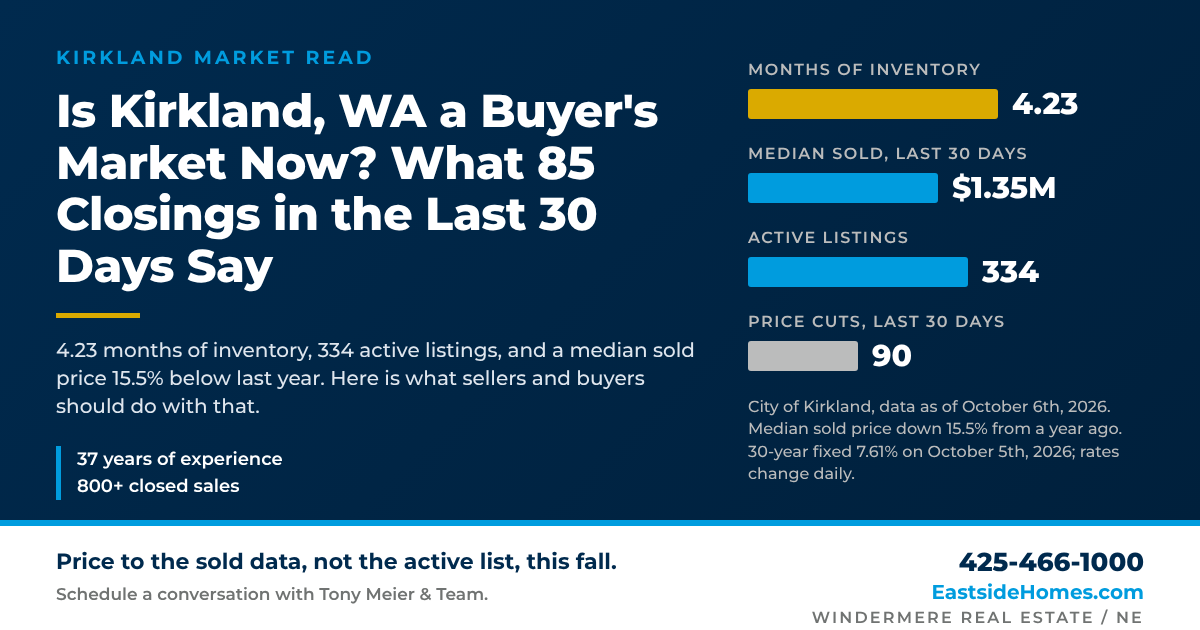
Is Kirkland a Buyer's Market Now?
Here's What I Suggest
- Check the Days Active first. Under 7 days, plan to offer at or near list, and be ready for competition. Past 14 days, an offer 3% to 4% under list is in line with what the market is actually paying.
- Look at the price history. A home that has already dropped 5% may have less room left than one that has been sitting at its original price for 45 days.
- Base your number on sold comps, not the list price. List price is the seller's opinion. Recent sales of similar homes are the market's answer.
- Negotiate more than price. With rates above 7%, a seller credit toward a rate buydown or closing costs can be worth more to you than the same dollars off the price.
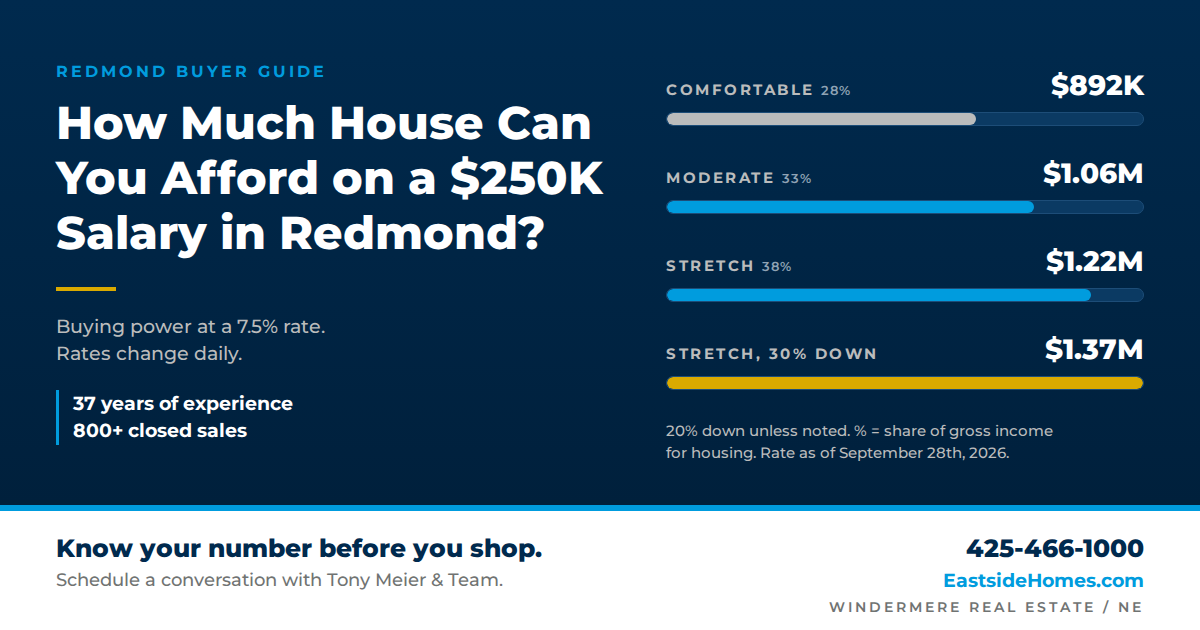
- Know your payment before you write. Our affordability guide walks through the math at today's rates.
AI tools are a good place to start your research, but they cannot see this week's showing traffic, the seller's situation, or which comps actually match the home you love. That is where a local broker earns their keep. Tony Meier & Team has 37 years of experience on the Eastside. Call
425-466-1000 or visit
EastsideHomes.com to talk through your next offer.
Frequently Asked Questions
How much below asking price should I offer on a house on the Eastside?
For a home on the market 15 days or more, recent sales closed at a median 96.6% of list, so an offer about 3% to 4% under list is realistic. For a home in its first week, the median sale was 100% of list, and 28% sold over asking.
Is it a buyer's market on the Eastside right now?
Yes, by months of inventory. As of October 5th, 2026, the Eastside had 4.5 months of inventory, above the 4 month line we use for a buyer's market. A year ago it was 2.6 months.
Can I offer 10% below asking?
You can, but few Eastside homes sell that far under their current list price. The typical discount on homes that sold below list was 3.7%. Larger discounts usually show up against the original price on homes that have already been reduced.
Does a price reduction mean the seller will take less?
Often, but much of the discount may already be built in. Reduced homes sold at a median 96.6% of their new price, or 90.9% of their original price.
Should I trust what ChatGPT says about my offer?
Use it to learn the process, but check its numbers against local sales. AI answers tend to rely on national averages, and Eastside discounts vary by area, price range, and especially by how long a home has been on the market.
Data as of October 5th, 2026, from Eastside Market Watch (Tony Meier & Team) for NWMLS Areas 500 to 600 (Eastside), residential sales closed July 8th to October 5th, 2026, compared with the same period in 2025. Percent of list uses the final list price at sale. Active listing counts and prices are as of the latest feed and change daily. Months of inventory is active plus contingent listings divided by the 30 day pending pace. Mortgage rates are Mortgage News Daily 30 year fixed averages, change daily, and are not a rate quote. This post is general market information, not legal or financial advice. Source: NWMLS listing data, compiled and analyzed by Tony Meier & Team through Eastside Market Watch. Statistics not compiled or published by Northwest Multiple Listing Service.
Tony Meier & Team | Windermere Real Estate / NE | Kirkland, WA | 425-466-1000 | EastsideHomes.com