
5 Min. Read
Audio Version
Tony Meier | Windermere Real Estate | 37 Years Experience | 807 Closed Eastside Sales
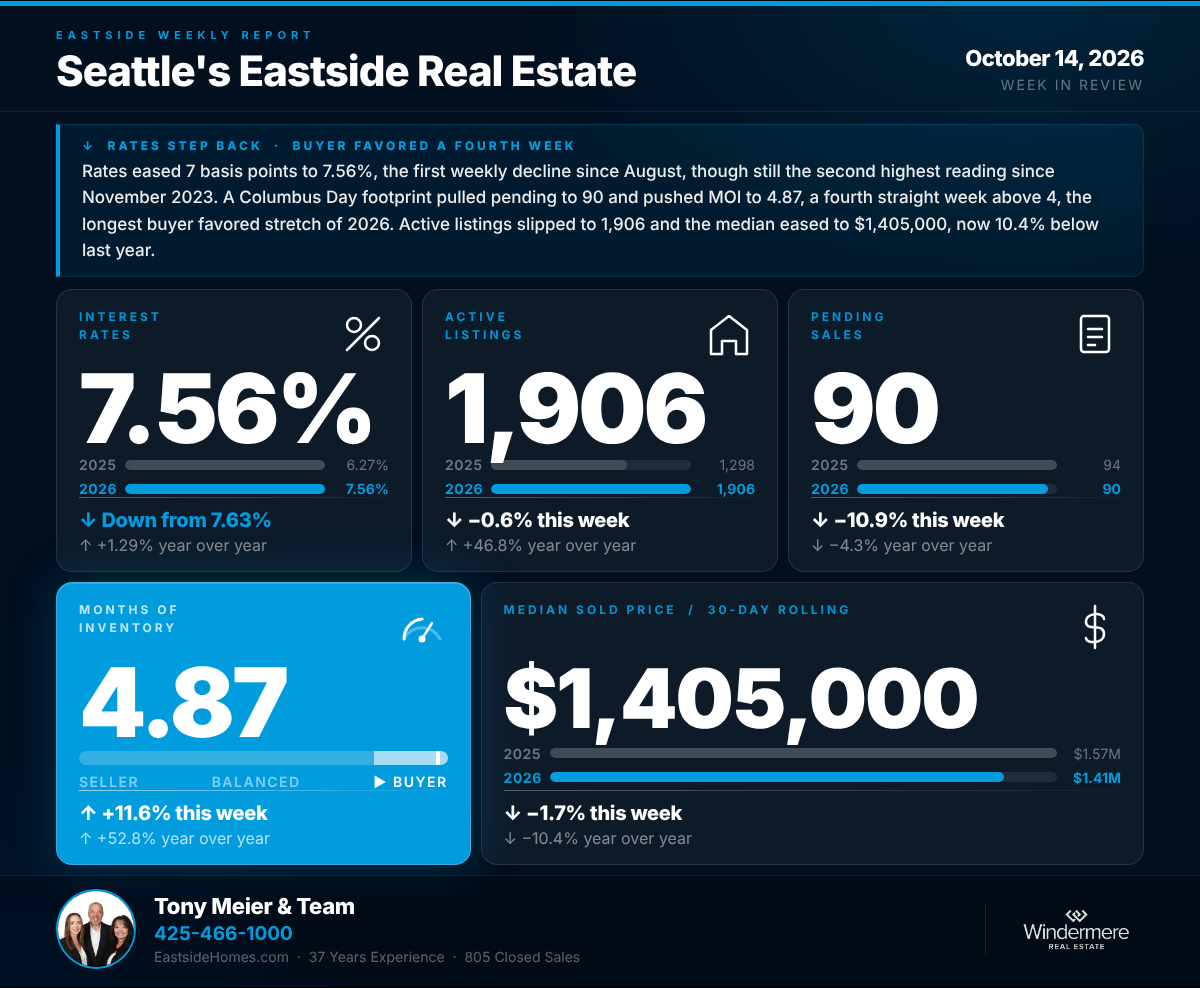
Rates finally took a step back. The 30-year fixed eased 7 basis points to 7.56%, the first weekly decline since August 19th, though it remains the second-highest reading since November 2023. The rest of the week carried a holiday footprint. The Columbus Day week has pulled pending sales lower in each of the past five years, and it did again: pending fell to 90, closings to 78, and months of inventory jumped to 4.87, its fourth consecutive week above 4. Active listings slipped to 1,906, a second straight decline, and the rolling median fell to $1,405,000, 10.4% below a year ago.

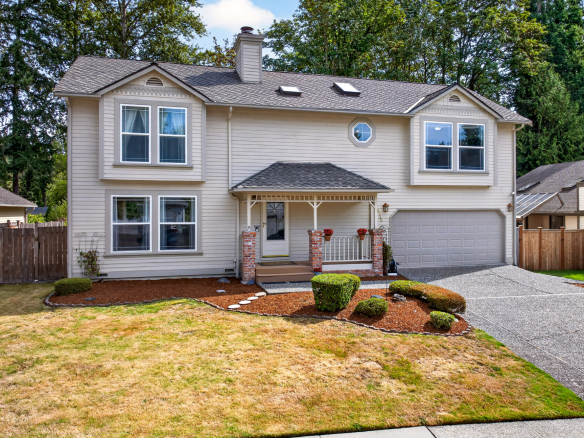
PENDING! Beautiful Redmond 4-Bedroom Home with Bonus Room Overlooking Greenbelt
13712 176th Ave NE, Redmond Details
4 weeks ago
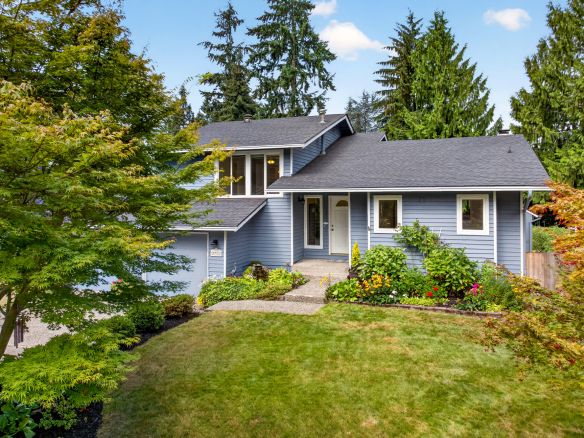
SOLD! Spacious Tri-Level Home with a Gardener’s Dream Yard on a Quiet Cul-de-Sac
2711 169th St SE, Bothell Details
4 weeks ago
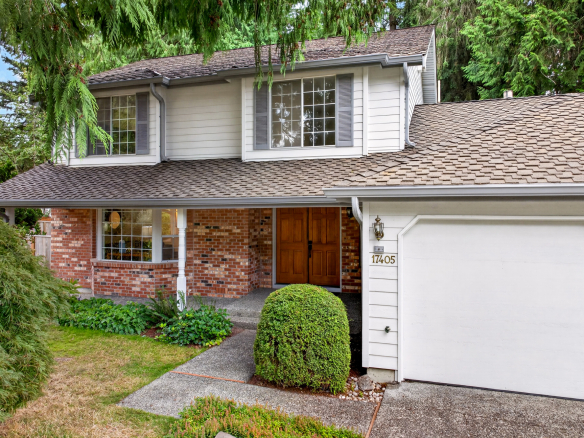
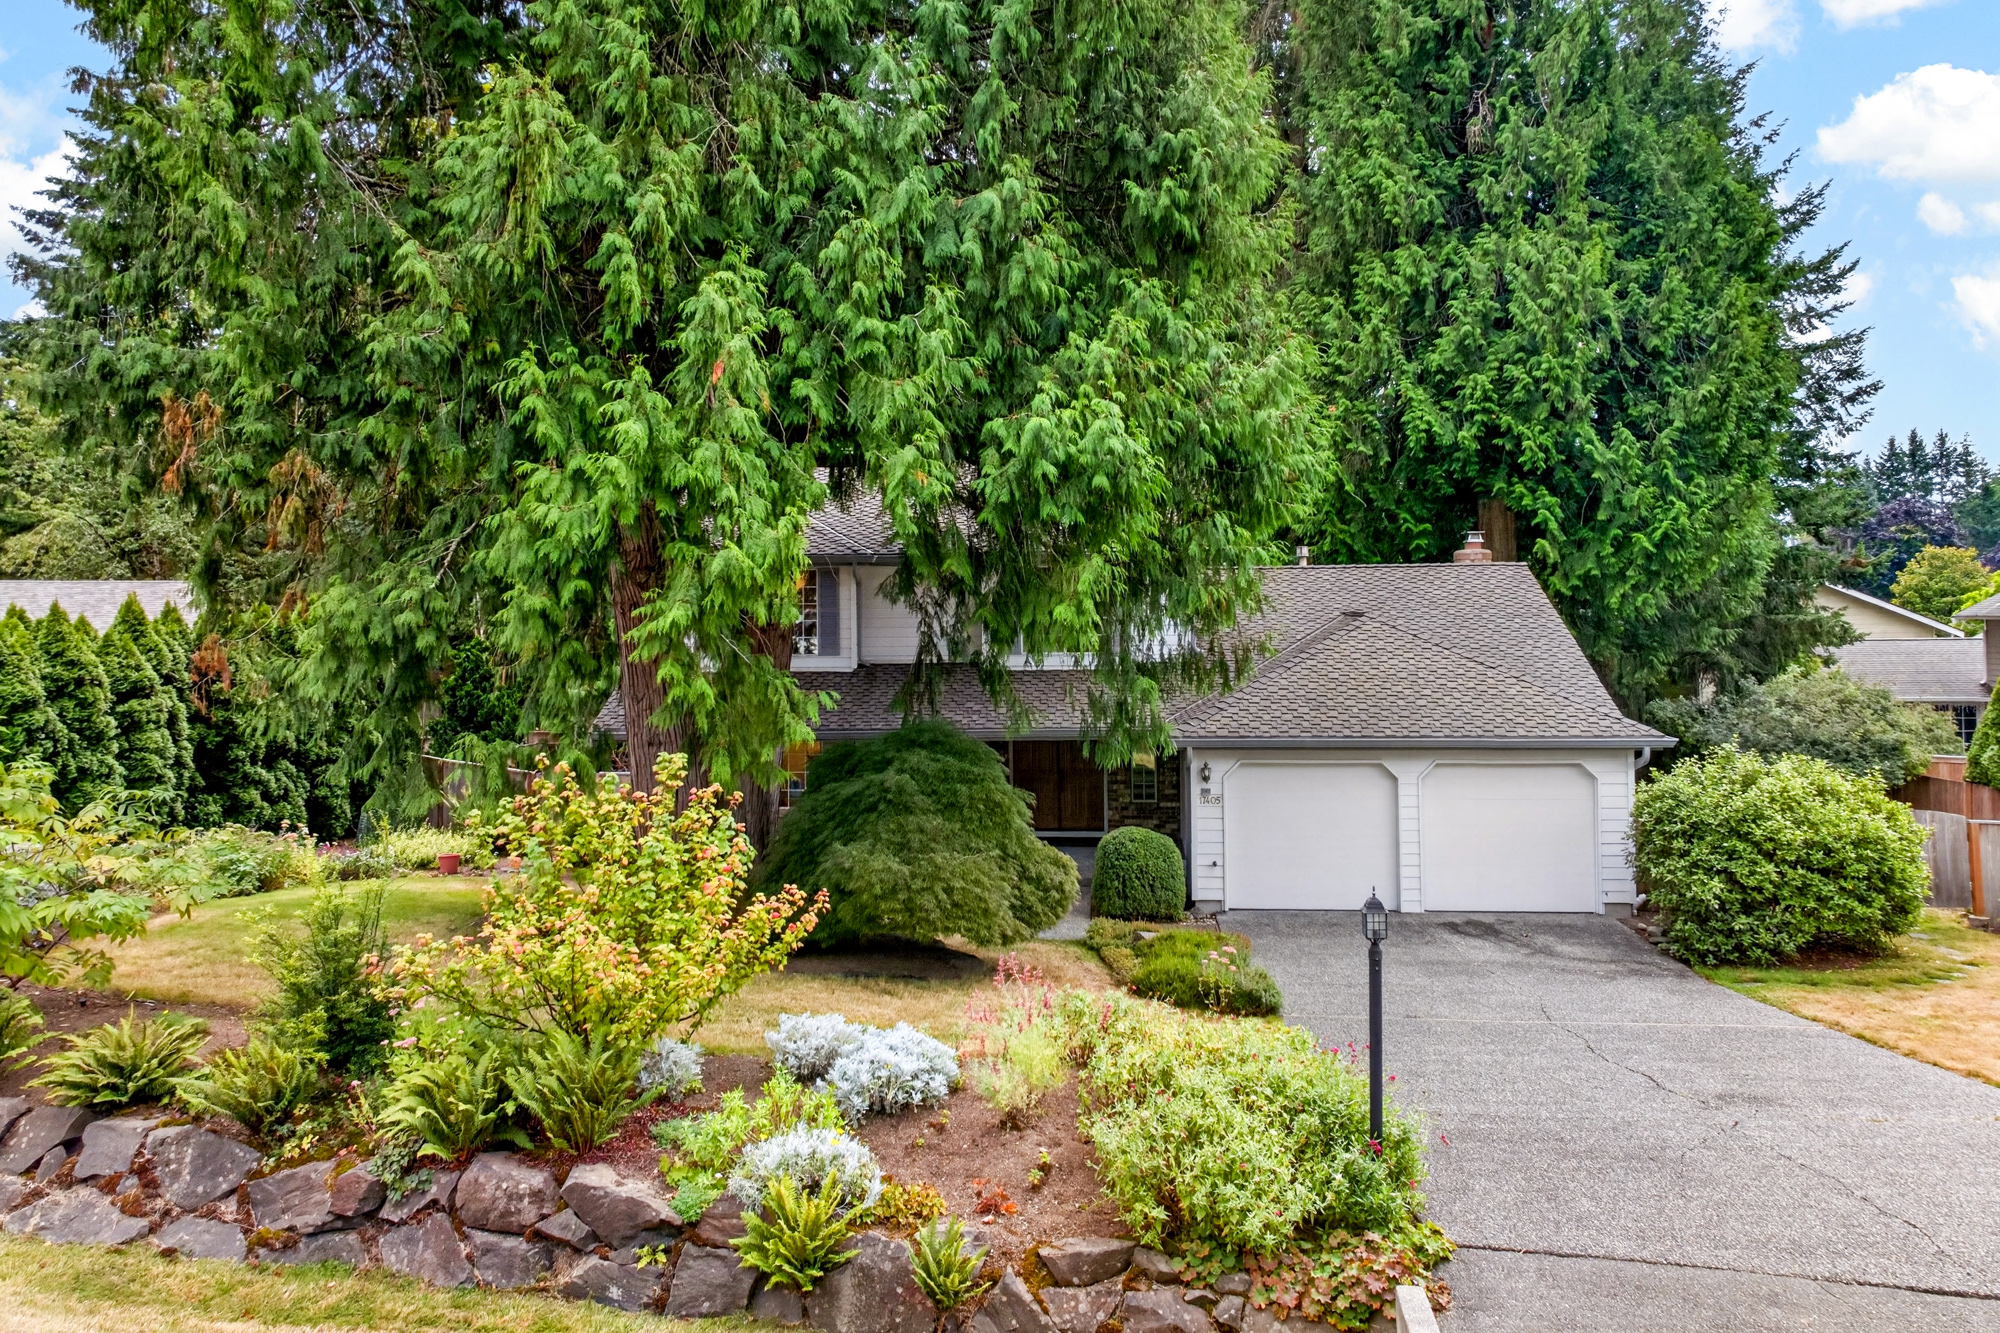
SOLD! Just Listed on English Hill in Redmond: Fully Remodeled Redmond Two Story
17405 NE 136th St, Redmond Details
1 month ago
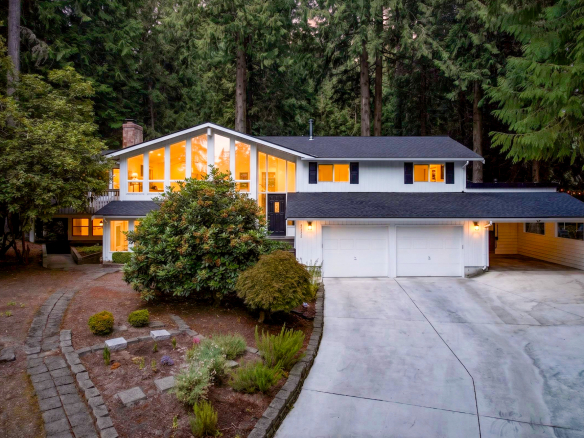
SOLD! Updated 3 Bedroom Plus Office/Den with MIL Space on 0.84 Private Acres in Woodinville
16224 195th Pl NE, Woodinville Details
2 months ago
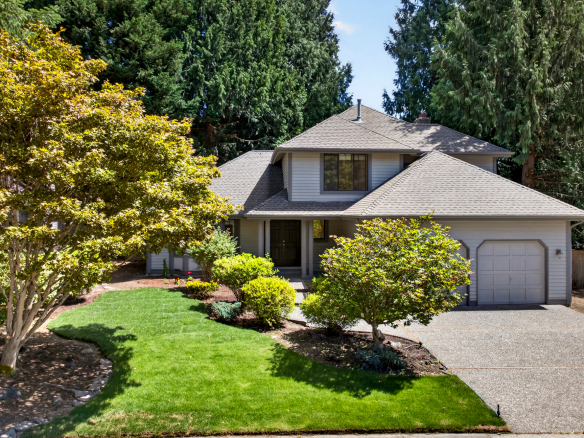
SOLD! Redmond Two Story, Fully Refreshed Inside and Out with Private Evergreen Backyard
13834 175th Pl NE, Redmond Details
2 months ago
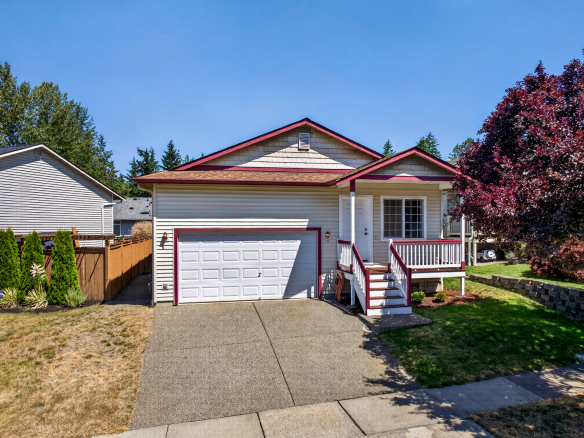
SOLD! Move-In Ready in Lynnwood: New Furnace, New Water Heater, Newer Roof
4223 147th St SW, Lynnwood Details
3 months ago
SOLD! Move-In Ready Condo in Lake Stevens: New Flooring, Updated Baths, Attached Garage
8916 Meridian Pl NE Unit A201, Lake Stevens Details
4 months ago
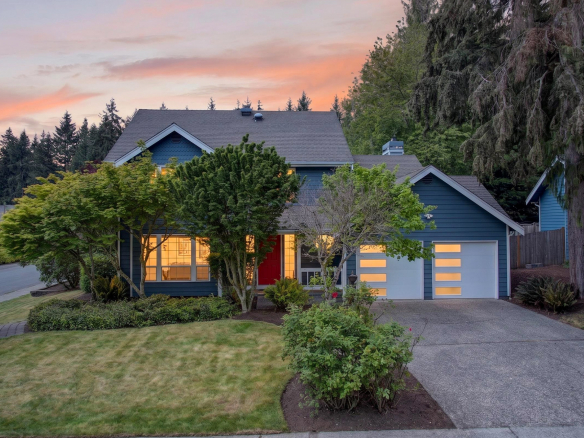
SOLD! Fully Updated 3 Bedroom Two Story Redmond Home with Modern Finishes & Sunny West-Facing Backyard
13505 174th Ave NE, Redmond Details
5 months ago
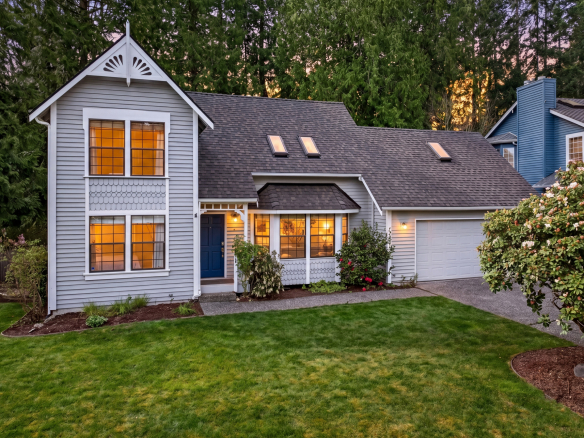
SOLD! English Hill Two-Story in Redmond. Main-Floor Guest Bedrooms, Versatile Loft, New Roof, One Block to Awarding Winning Sunrise Elementary
13831 173rd Ave NE, Redmond Details
6 months ago
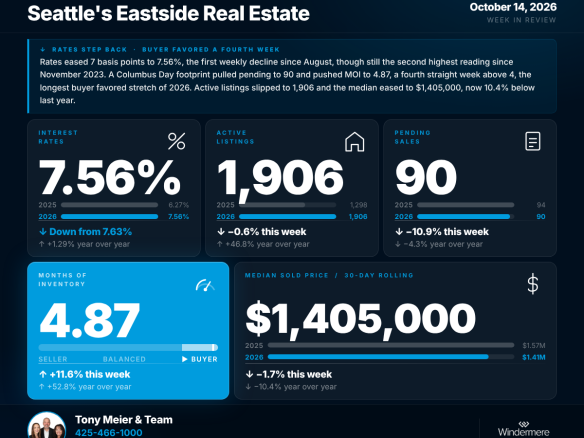
Rates eased 7 bp to 7.56%, the first decline since August 19th, while MOI rose to 4.87 for a fourth straight week above 4. Columbus Day week pulled pending to 90 and closings to 78, active listings slipped to 1,906, and the rolling median fell to $1,405,000, 10.4% below a year ago.
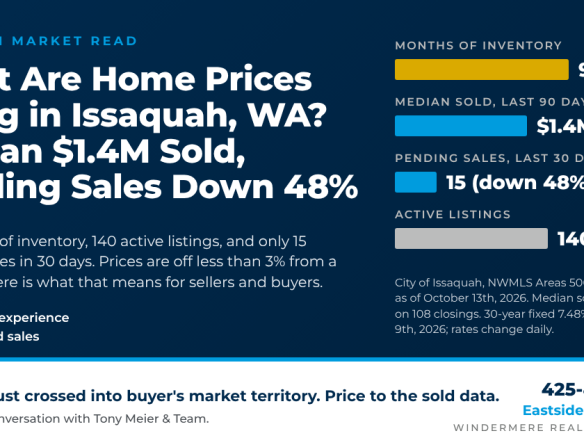
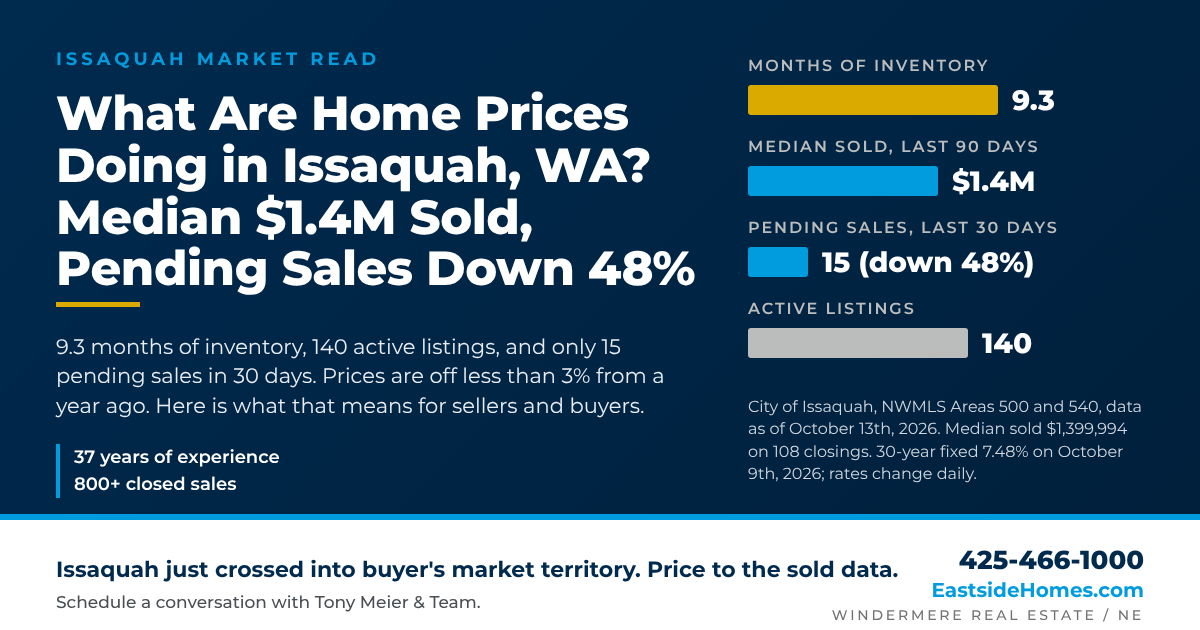
Issaquah's 90-day median sold price is $1,399,994, down 2.8% from a year ago, but pending sales fell 48% in a month and inventory hit 9.3 months.
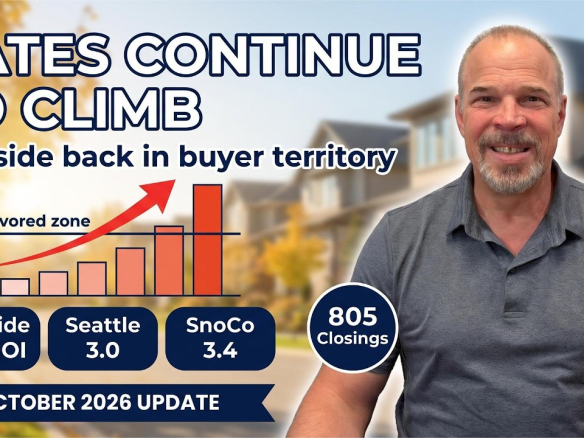
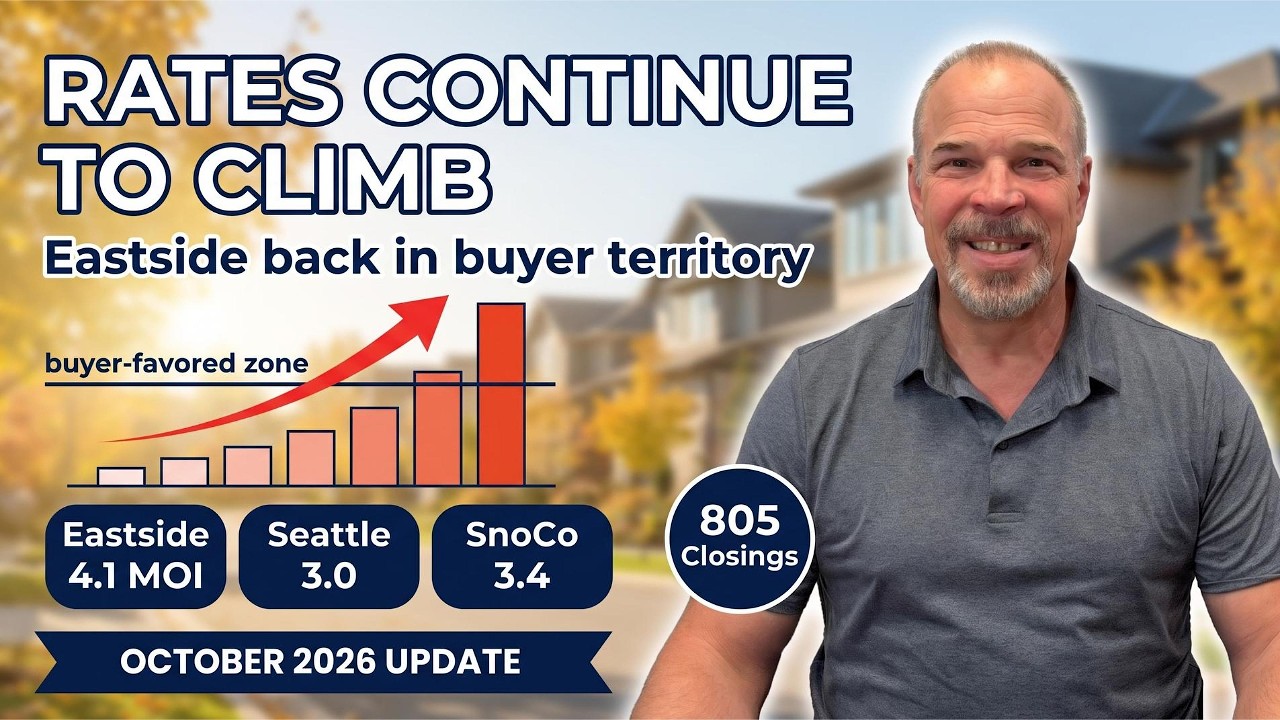
October 2026 Eastside, Seattle and Snohomish market update: rates jump to 7.59%, Eastside MOI hits 4.1 (buyer territory), and the Eastside median is down 9.52% year over year.
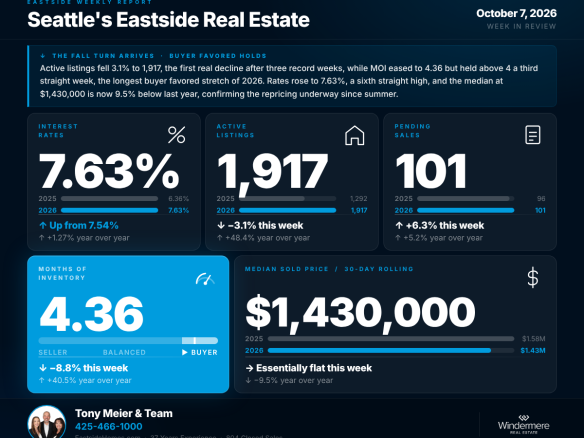
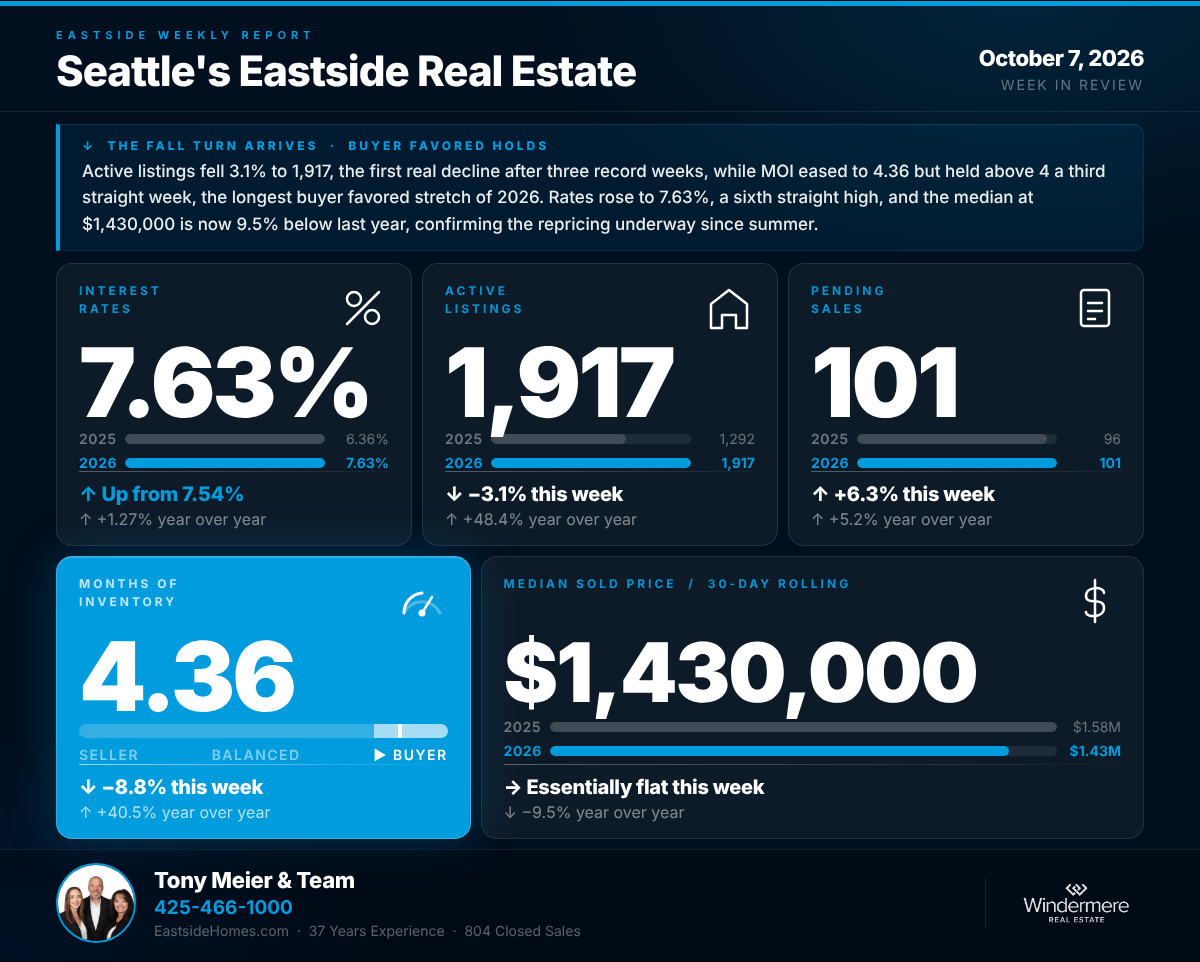
Active listings fell for the first time after three straight records, down 3.1% to 1,917, while pending sales rose to 101. MOI held above 4 for a third consecutive week, rates climbed to 7.63%, the highest since November 2023, and the rolling median sits 9.5% below a year ago at $1,430,000.

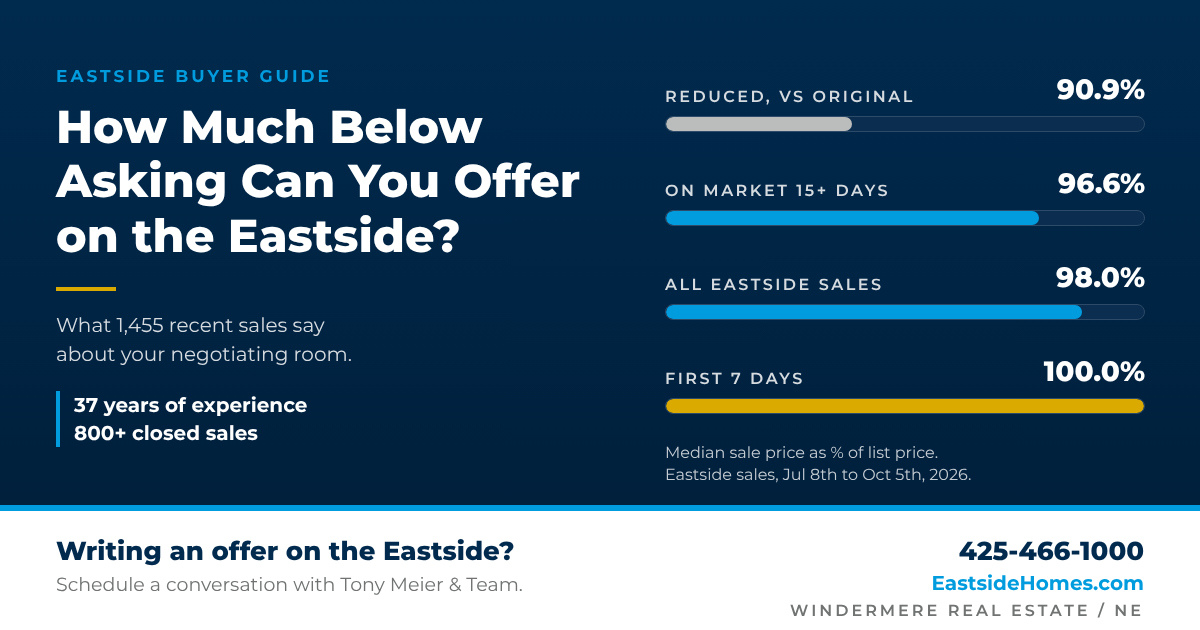
The typical Eastside home sells at 98.0% of list, but homes in their first week sell at full price while homes past 15 days sell near 96.6%. Here is how much room buyers really have, by area and price range.
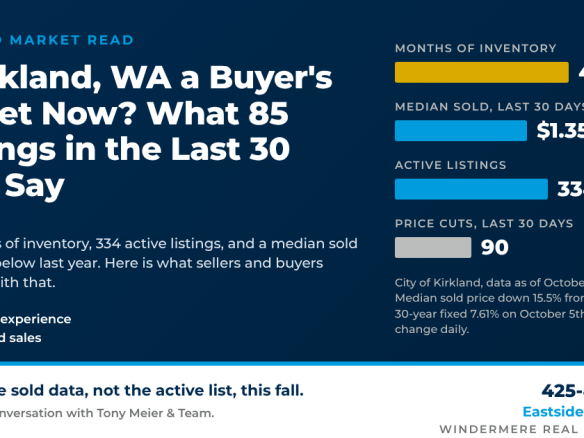
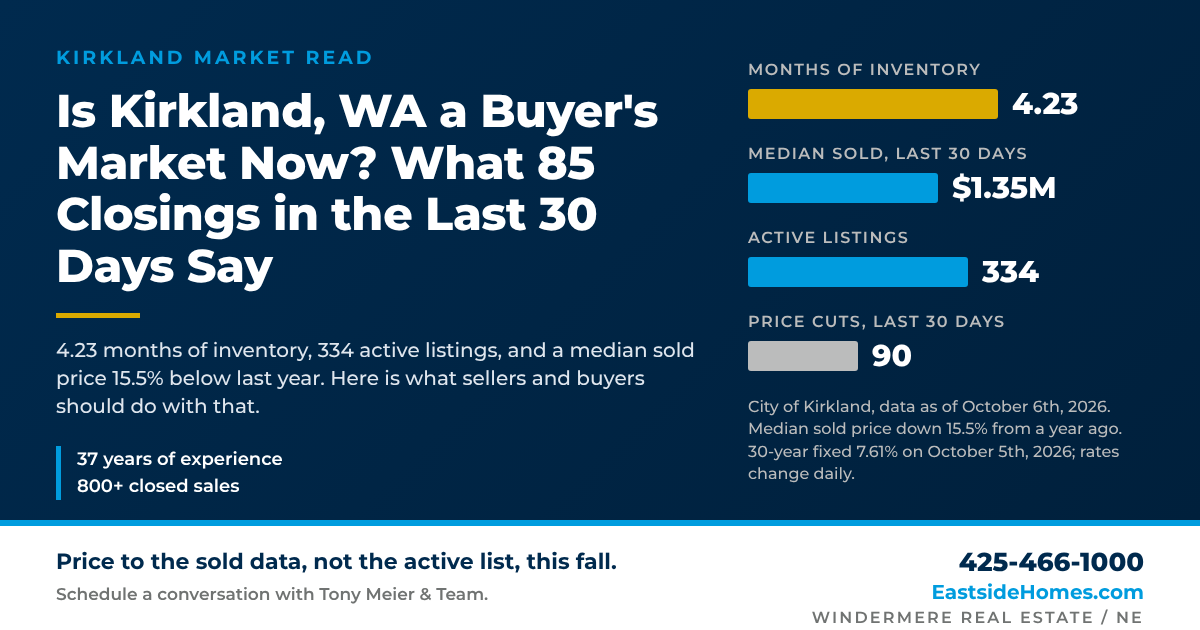
Kirkland hit 4.23 months of inventory on October 6th, 2026. Median sold $1,350,000, down 15.5% in a year. What sellers and buyers should do now.

Published on: October 6, 2026 Active listings increased 24.5% in September, while pending sales...
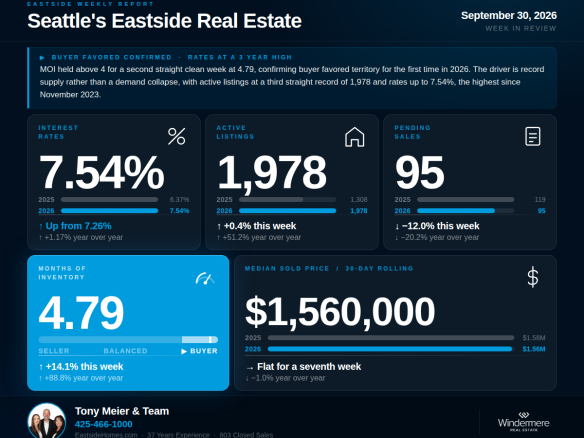
MOI held above 4 for a second consecutive clean week, the first time in 2026, confirming buyer-favored territory. Rates jumped to 7.54%, the highest since November 2023, and active listings set a third straight record at 1,978. Twenty years of NWMLS monthly data show the shift is driven by a return of supply, not a collapse in demand.
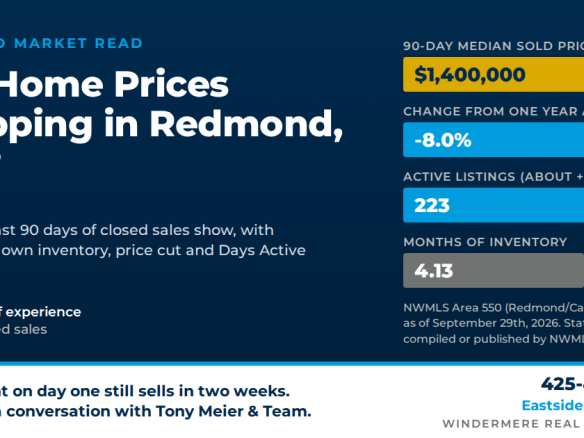
Redmond's 90-day median sold price is $1,400,000, down 8% from a year ago, while active listings are up about 76%. What it means for sellers and buyers.

On a $250,000 salary with 20% down and rates near 7.5%, most buyers can comfortably afford a Redmond home between about $890,000 and $1.06 million. Here's the math, and what changes it.
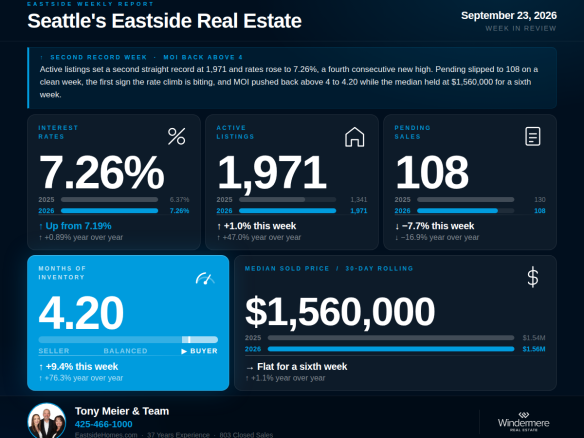
5 Min. Read Audio Version Tony Meier | Windermere Real Estate | 37 Years Experience |...
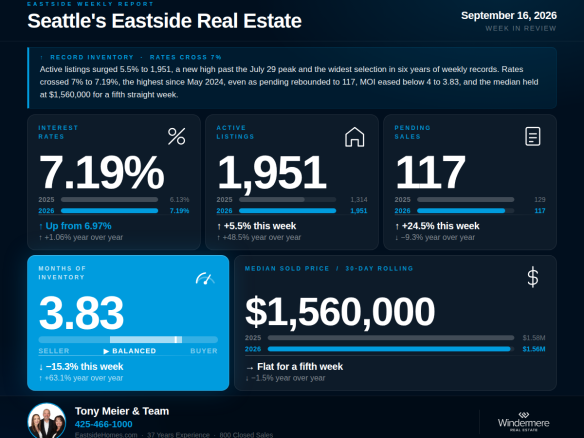
Active listings surged to 1,951, a new 2026 high seven weeks after the July peak and the highest weekly count in six years of tracking, while rates crossed 7% for the first time since May 2025, landing at 7.19%, up 1.06% year over year. Record selection meets the most expensive financing in 28 months.

If you're a seasoned homeowner thinking about selling your current home and buying your next one,...
Published on: September 3, 2026 Northwest Multiple Listing Service (NWMLS) today released its...
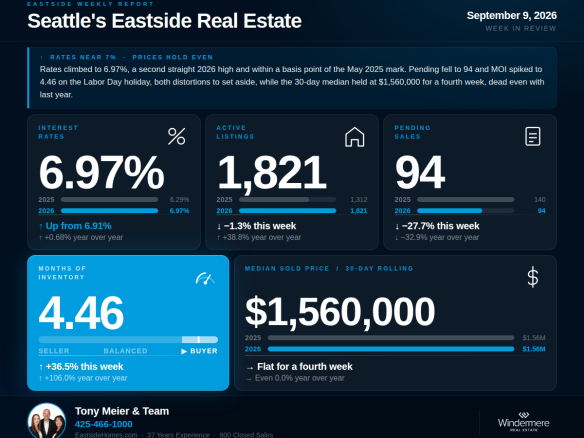
5 Min. Read Audio Version Last week we flagged that this reading would carry Labor Day...
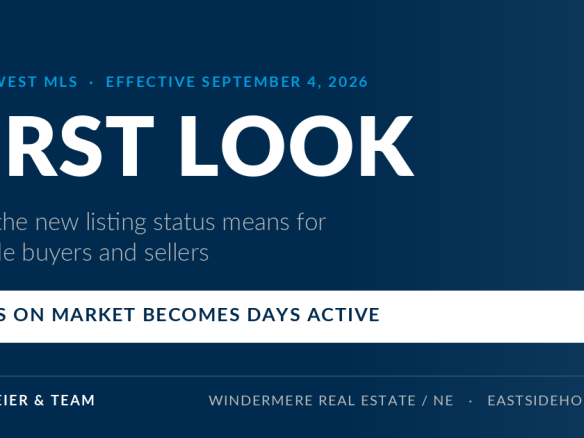
Northwest MLS launches First Look September 4, 2026. How the new 21-day listing status works, what changed about days on market, and what it means for you.
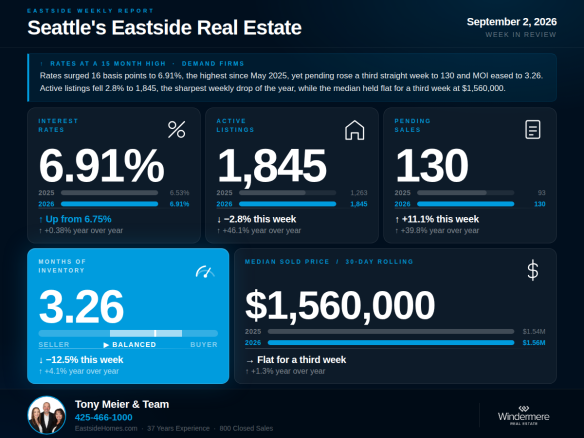
5 Min. Read Audio Version Tony Meier | Windermere Real Estate | 37 Years Experience | 800...
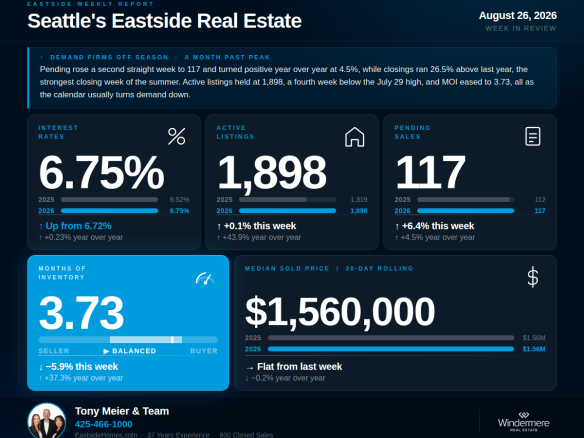
5 Min. Read Audio Version Tony Meier | Windermere Real Estate | 37 Years Experience | 800...
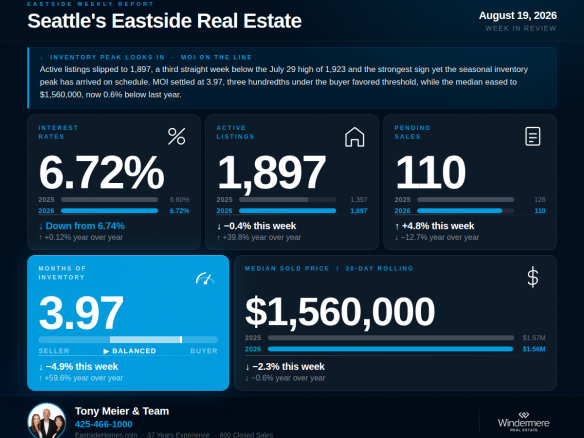
5 Min. Read Audio Version Tony Meier | Windermere Real Estate | 37 Years Experience | 800...
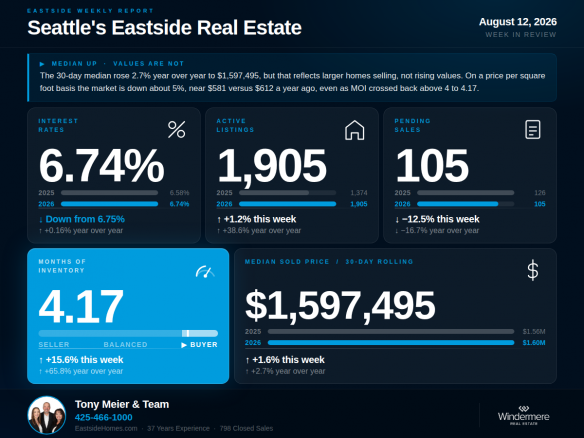
The 30-day median is up 2.7% year over year, but price per square foot is down about 5%. Larger homes are selling, masking a like-for-like value decline. Pending fell to 105, MOI crossed above 4 for the fifth time this year, and the inventory peak question remains open.

If you're a seasoned homeowner thinking about selling your current home and buying your next one,...
5 Min. Read Audio Version Tony Meier | Windermere Real Estate | 37 Years Experience | 798...
Published on: August 4, 2026 Northwest Multiple Listing Service (NWMLS) today released its July...
5 Min. Read Audio Version Tony Meier | Windermere Real Estate | 37 Years Experience | 798...
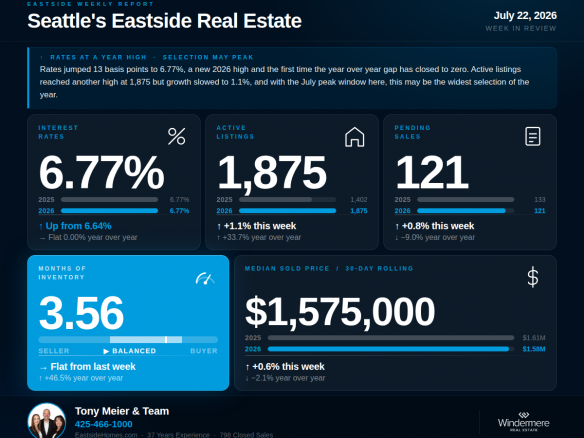
Rates jumped to 6.77%, a new 2026 high and the highest in nearly a year — the last time they were higher was July 28, 2025. The buyer's year-over-year rate advantage has closed to zero. Meanwhile inventory growth slowed sharply as the July peak window arrives, meaning selection may be peaking too.
5 Min. Read Audio Version Tony Meier | Windermere Real Estate | 37 Years Experience |...
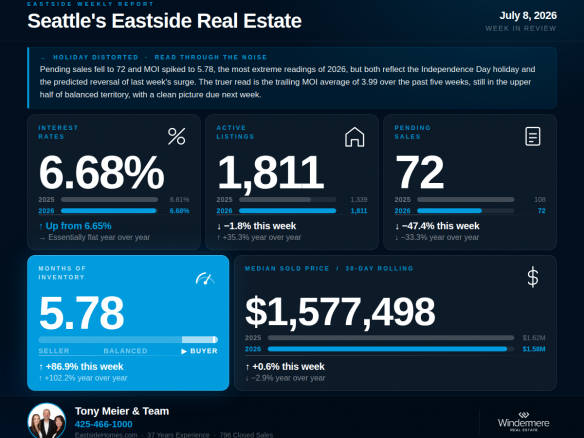
This week's headline numbers are the most extreme readings of 2026, but they arrive with the Independence Day holiday firmly stamped on them. Pending fell to 72, MOI jumped to 5.78, and active listings declined for the first time all year. A clean read of underlying market conditions will not be available until next week.
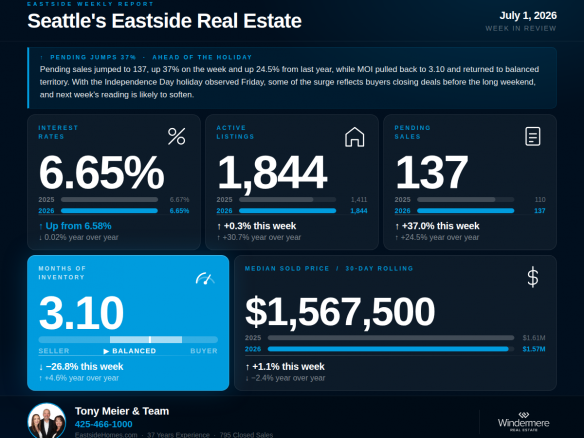
Pending sales jumped 37% this week to 137, MOI pulled back to 3.10 returning to balanced territory, and active listings barely grew for the first time all year. But pre-holiday timing complicates the read, and next week's Independence Day suppression is likely to reverse the pending signal.
5 Min. Read Audio Version Tony Meier | Windermere Real Estate | 37 Years Experience |...
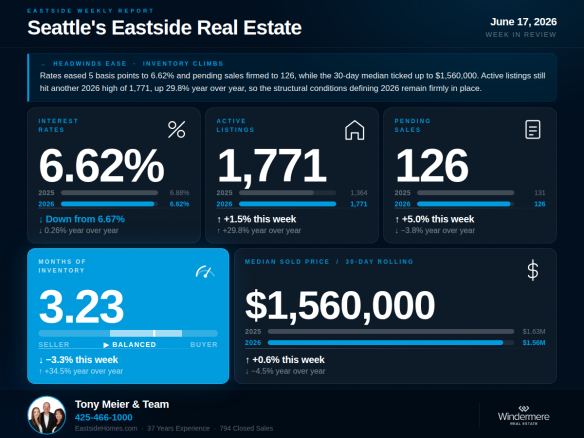
The data this week reads in mixed directions: rates eased to 6.62%, pending sales firmed modestly to 126, and active listings climbed to 1,771 — another 2026 high. Four short-term signals moved in sellers' favor this week, but the structural conditions defining 2026 remain in place.
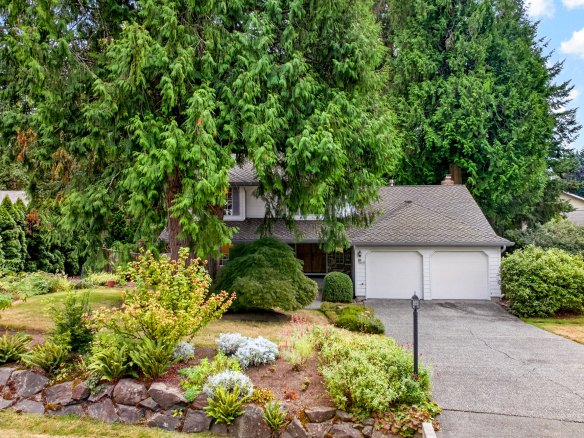
Tony & Team, we can't thank you enough for representing us in the sale of our home. Tony,...
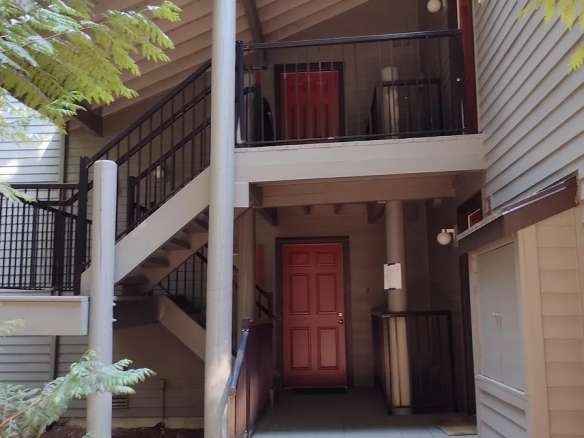
Not every sale needs to be dramatic. Most of the work in a smooth transaction happens quietly, in...
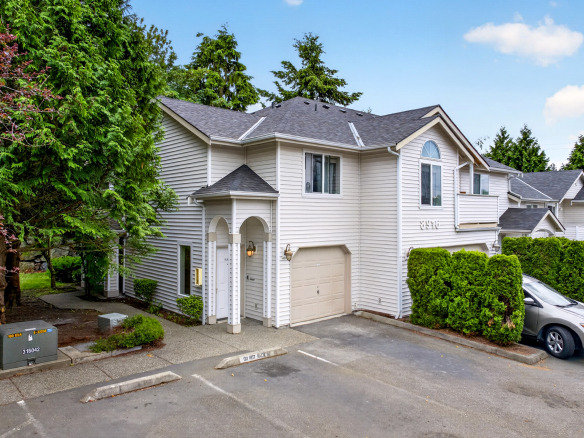
When a market slows, the difference shows up in the details: how quickly you learn what buyers are...
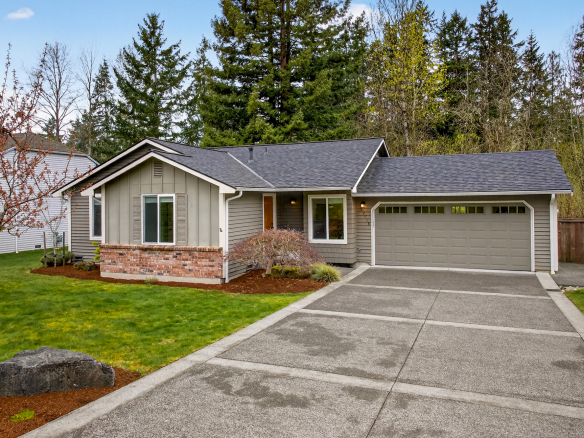
Glenterra sellers Evan and Sarah Gilbertson share their experience selling with Tony Meier & Team.
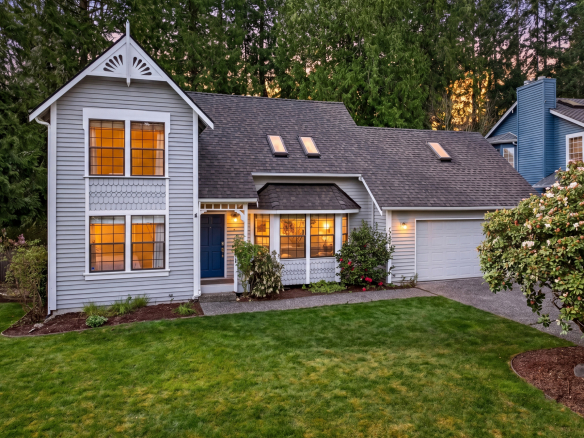
Sunrise sellers Shilpa Nagde and Anurag Gomsale share their experience working with Tony Meier & Team.

We had an exceptional experience working with Tony Meier and team, and we couldn't be happier with...
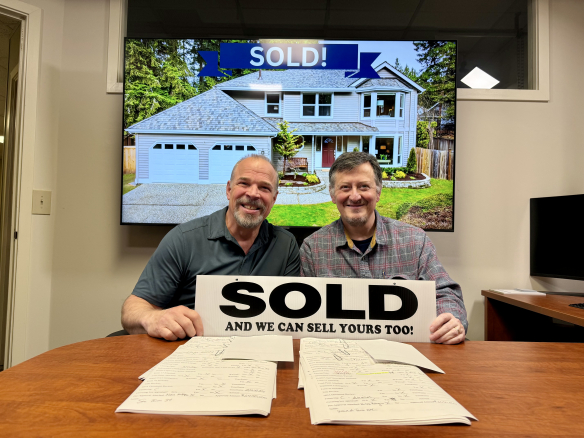
When it was time to sell my house I decided to have Tony Meier and his team help me because many of...
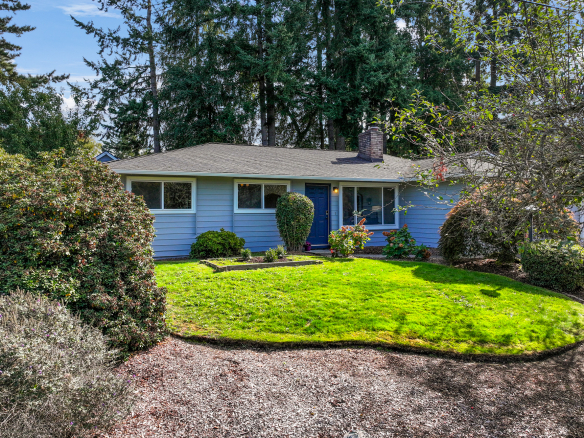
I've worked with Tony on buying two houses and selling one. I've also worked with Tony when...
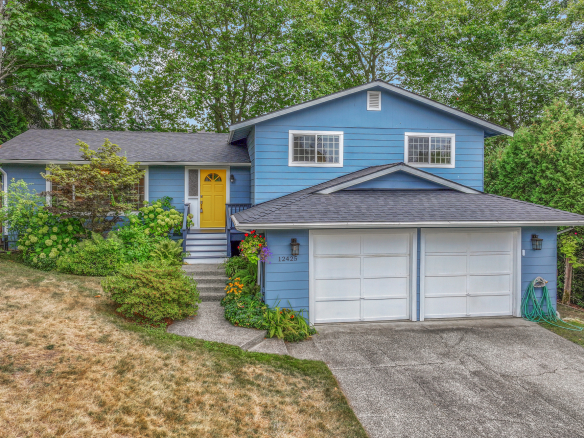
Thanks to Tony Meier & Team, we found our dream property in a great location! Then, with...

We had a fantastic experience working with Tony to sell our home. From the very beginning, Tony...
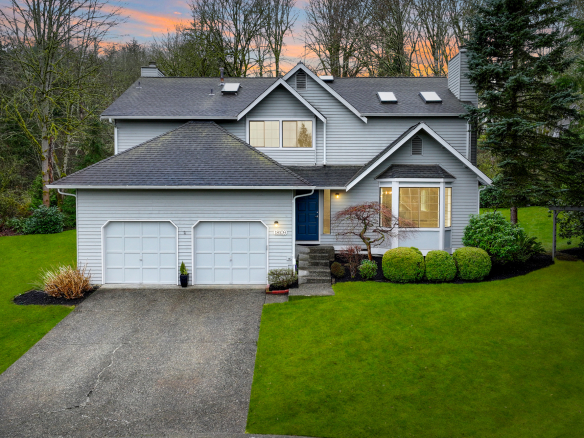
Tony is a consummate professional. If you want to sell your house quickly and at the maximum...
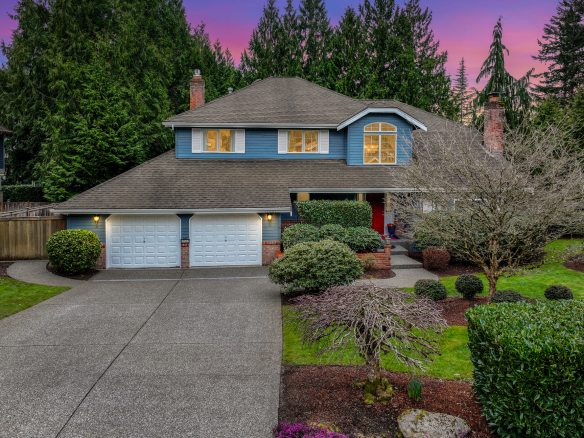
We had the pleasure of working with Tony and his team to sell our home in English Hill, and we...
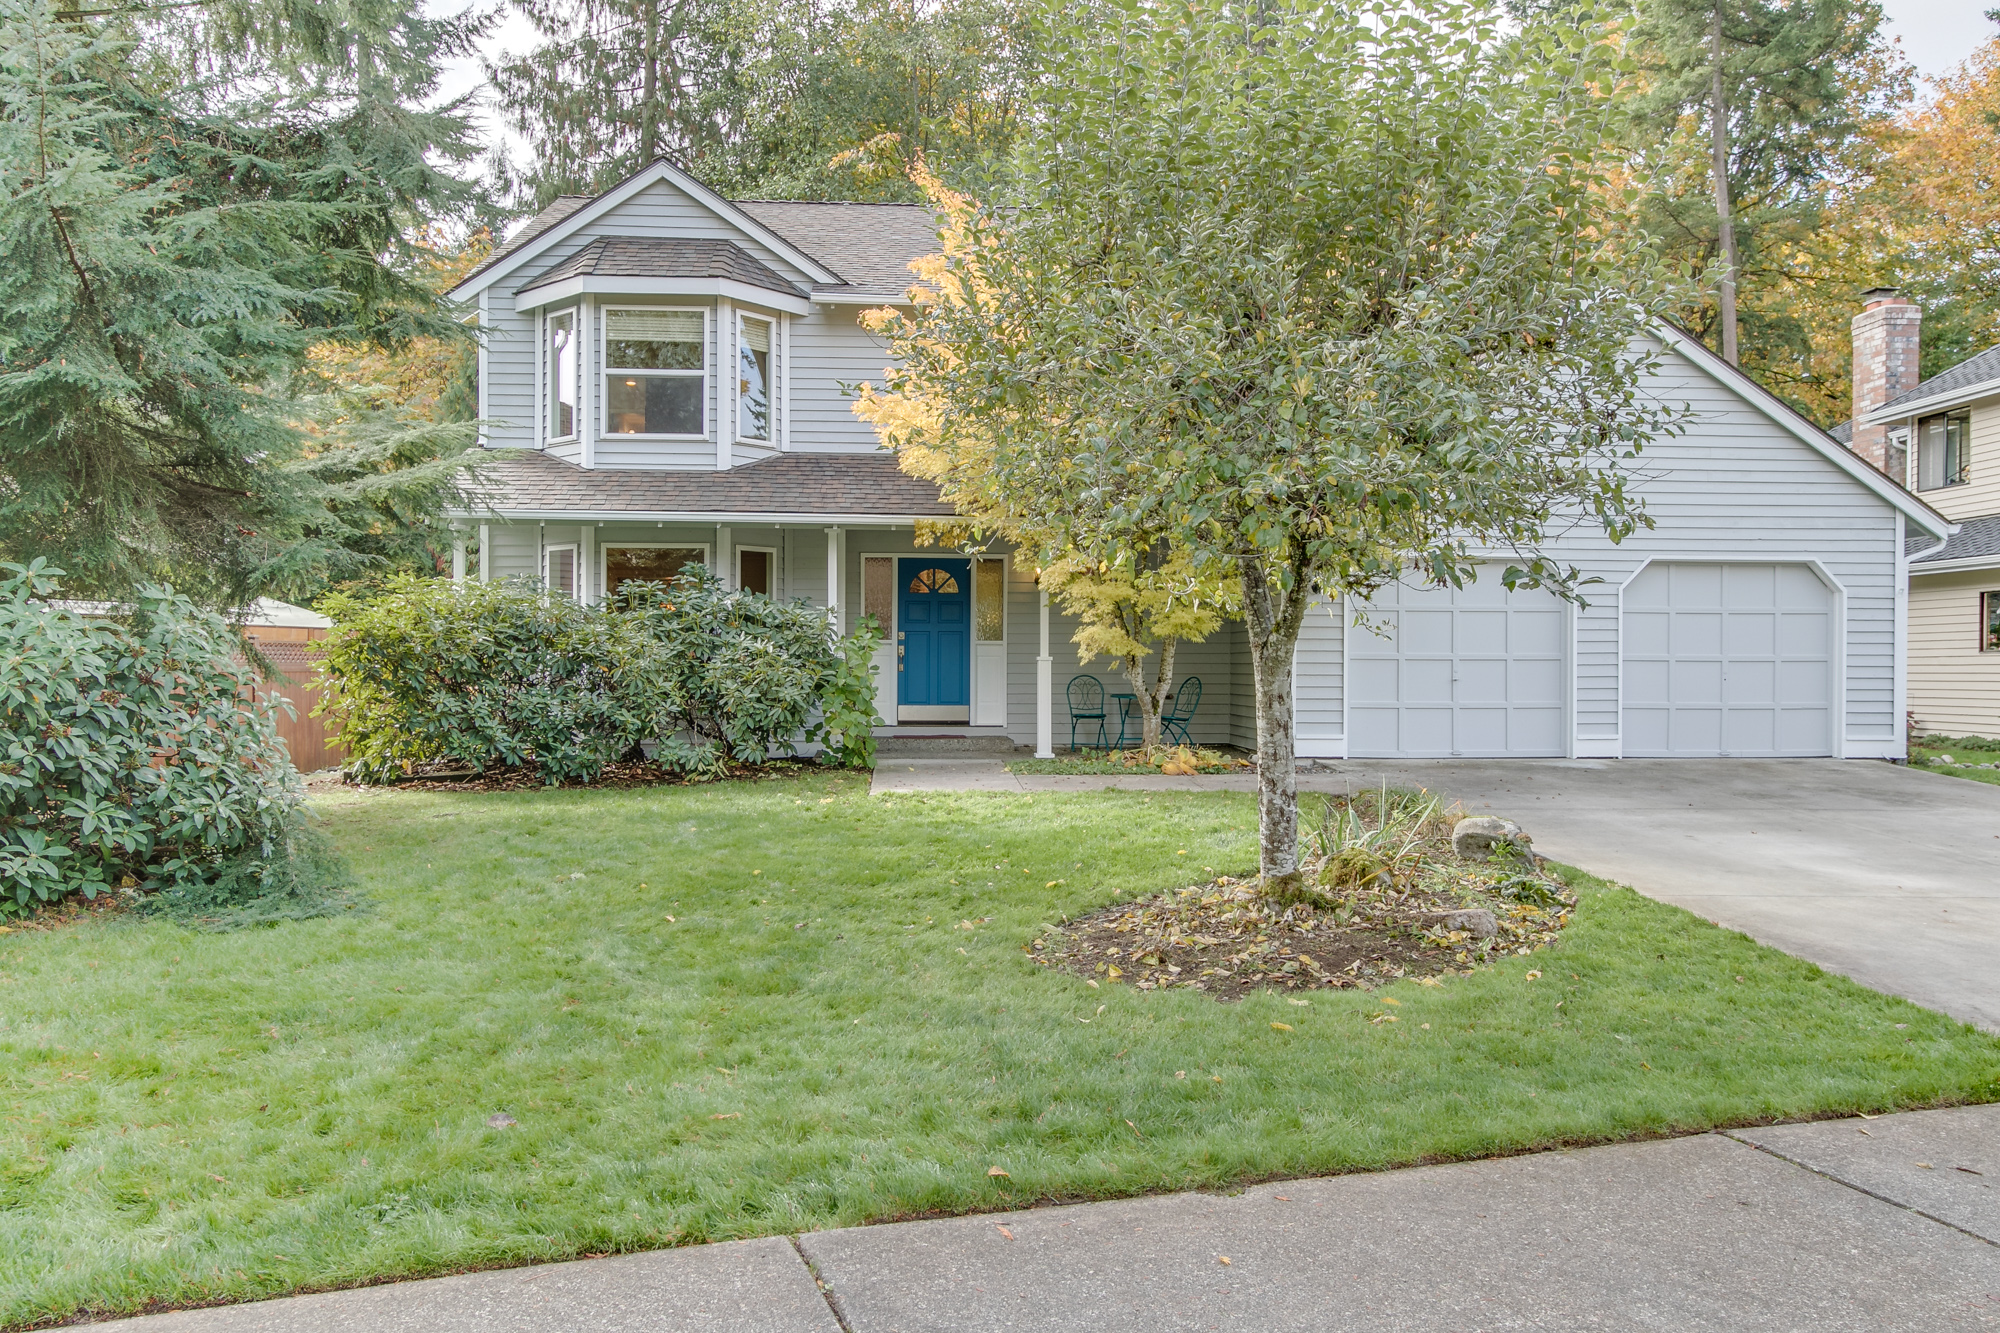
I can hardly think of more demanding customers than the two of us, but Tony rose up to the...
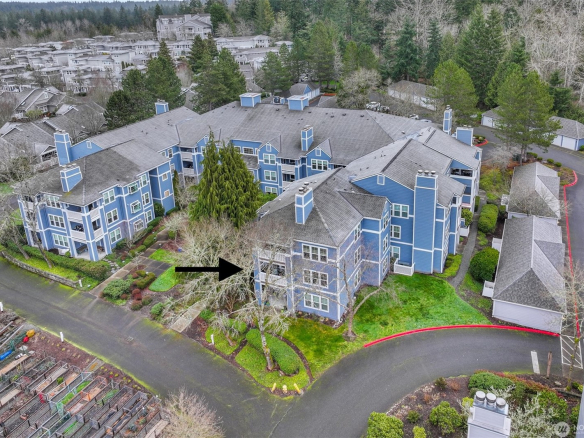
Tony was exceptional in assisting us in the sale of our home in a very difficult market. He helped...
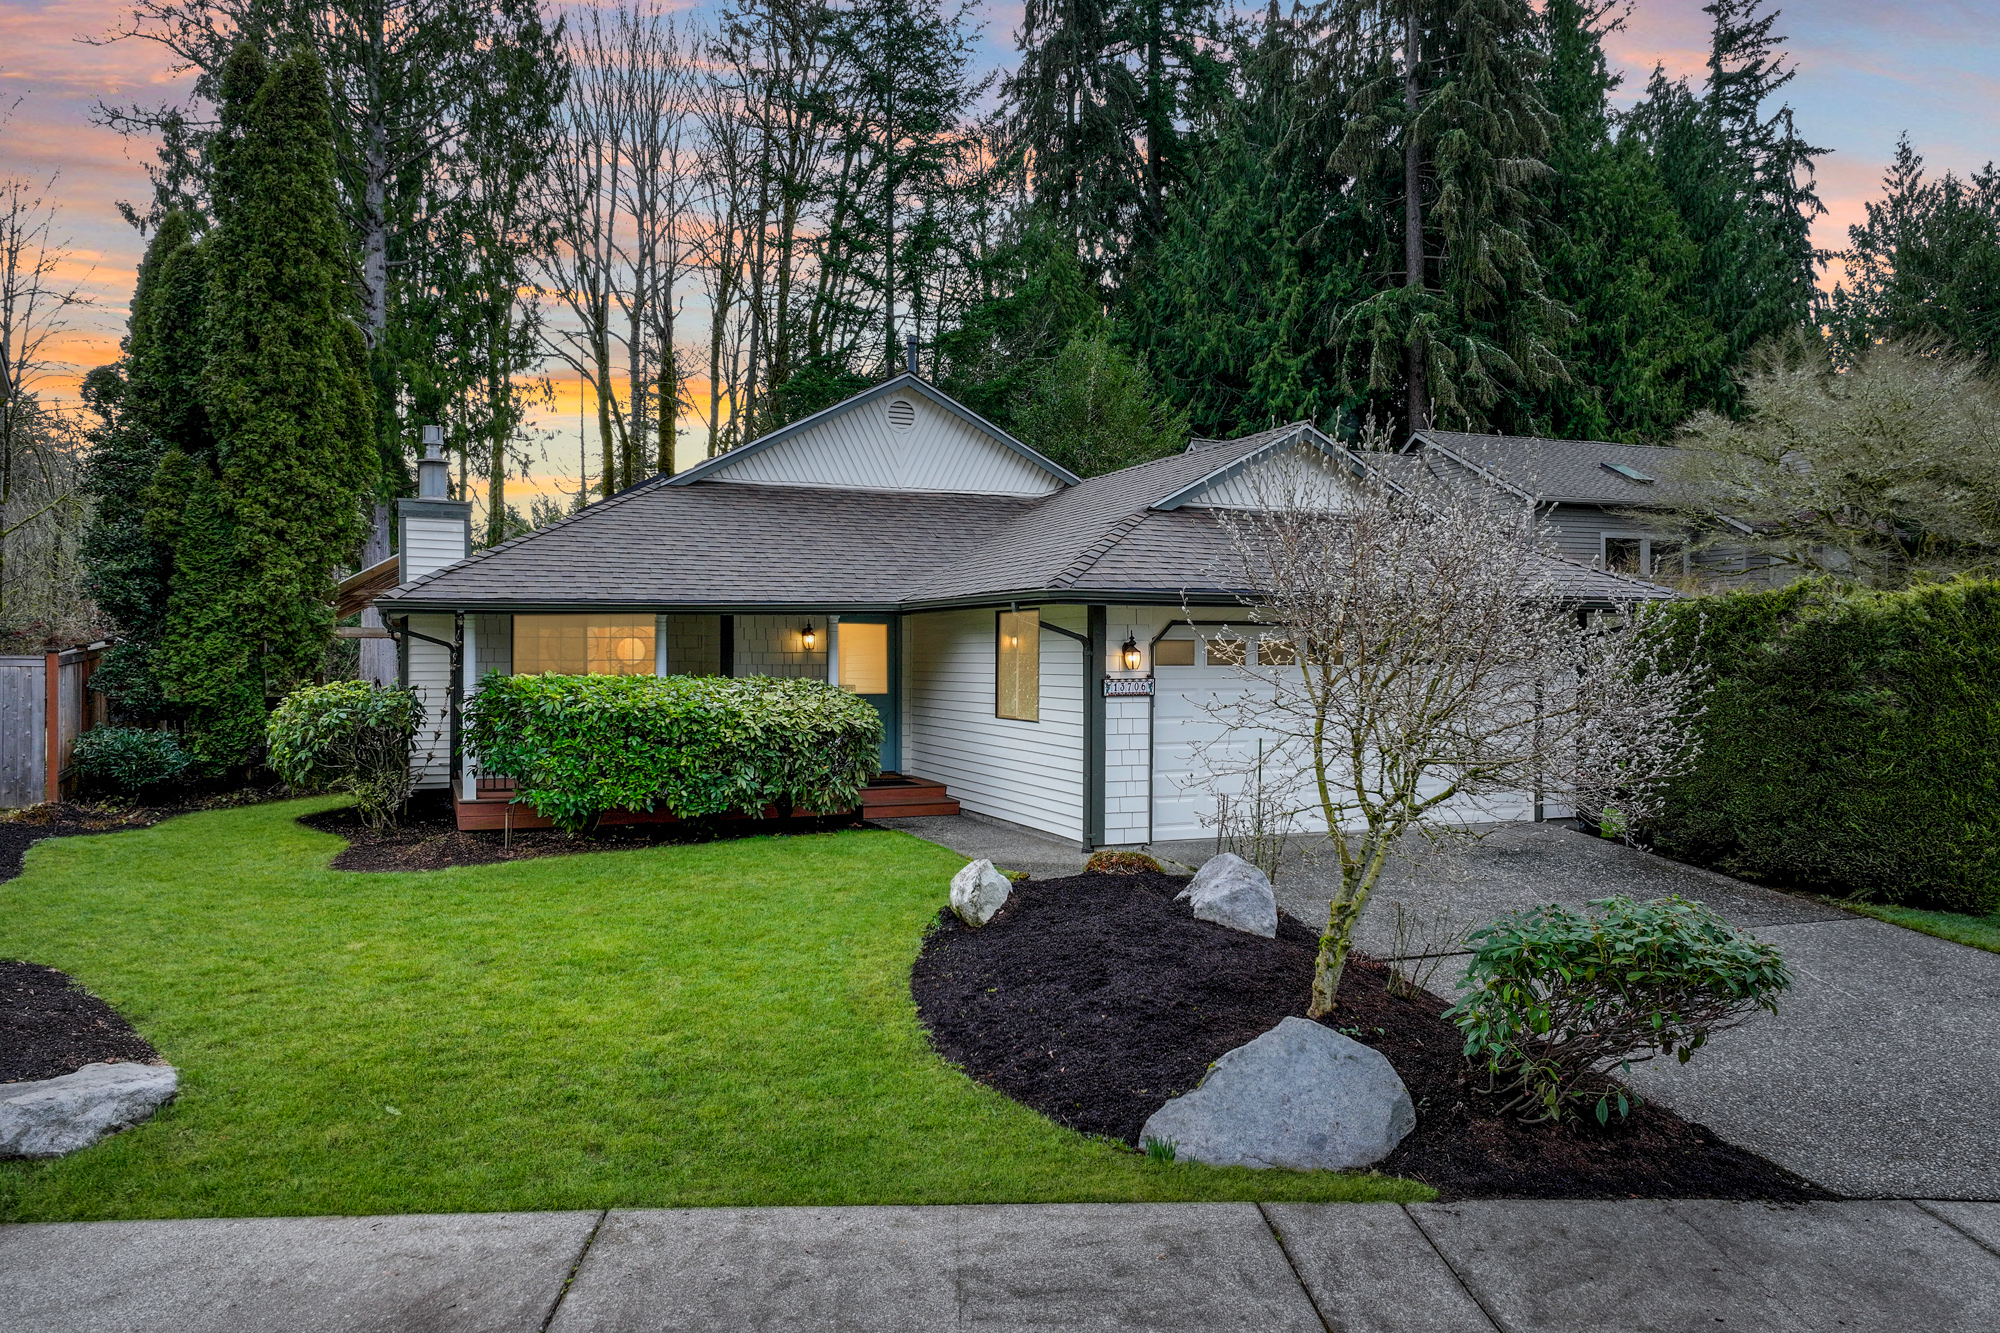
Tony Meier has represented us as both a buyer and a seller in English Hill this year. As we...

For over 20 years, Tony, Wendi, and Rachel have been our trusted friends and neighbors—but...

I had the pleasure of working with Tony Meier to sell my English Hill home. Tony took the time...
Thank you so much for all your help and support in the home buying process. Your care, kindness...

Thank you for the team ! "Excellent reputation in the real estate business, reliability and...
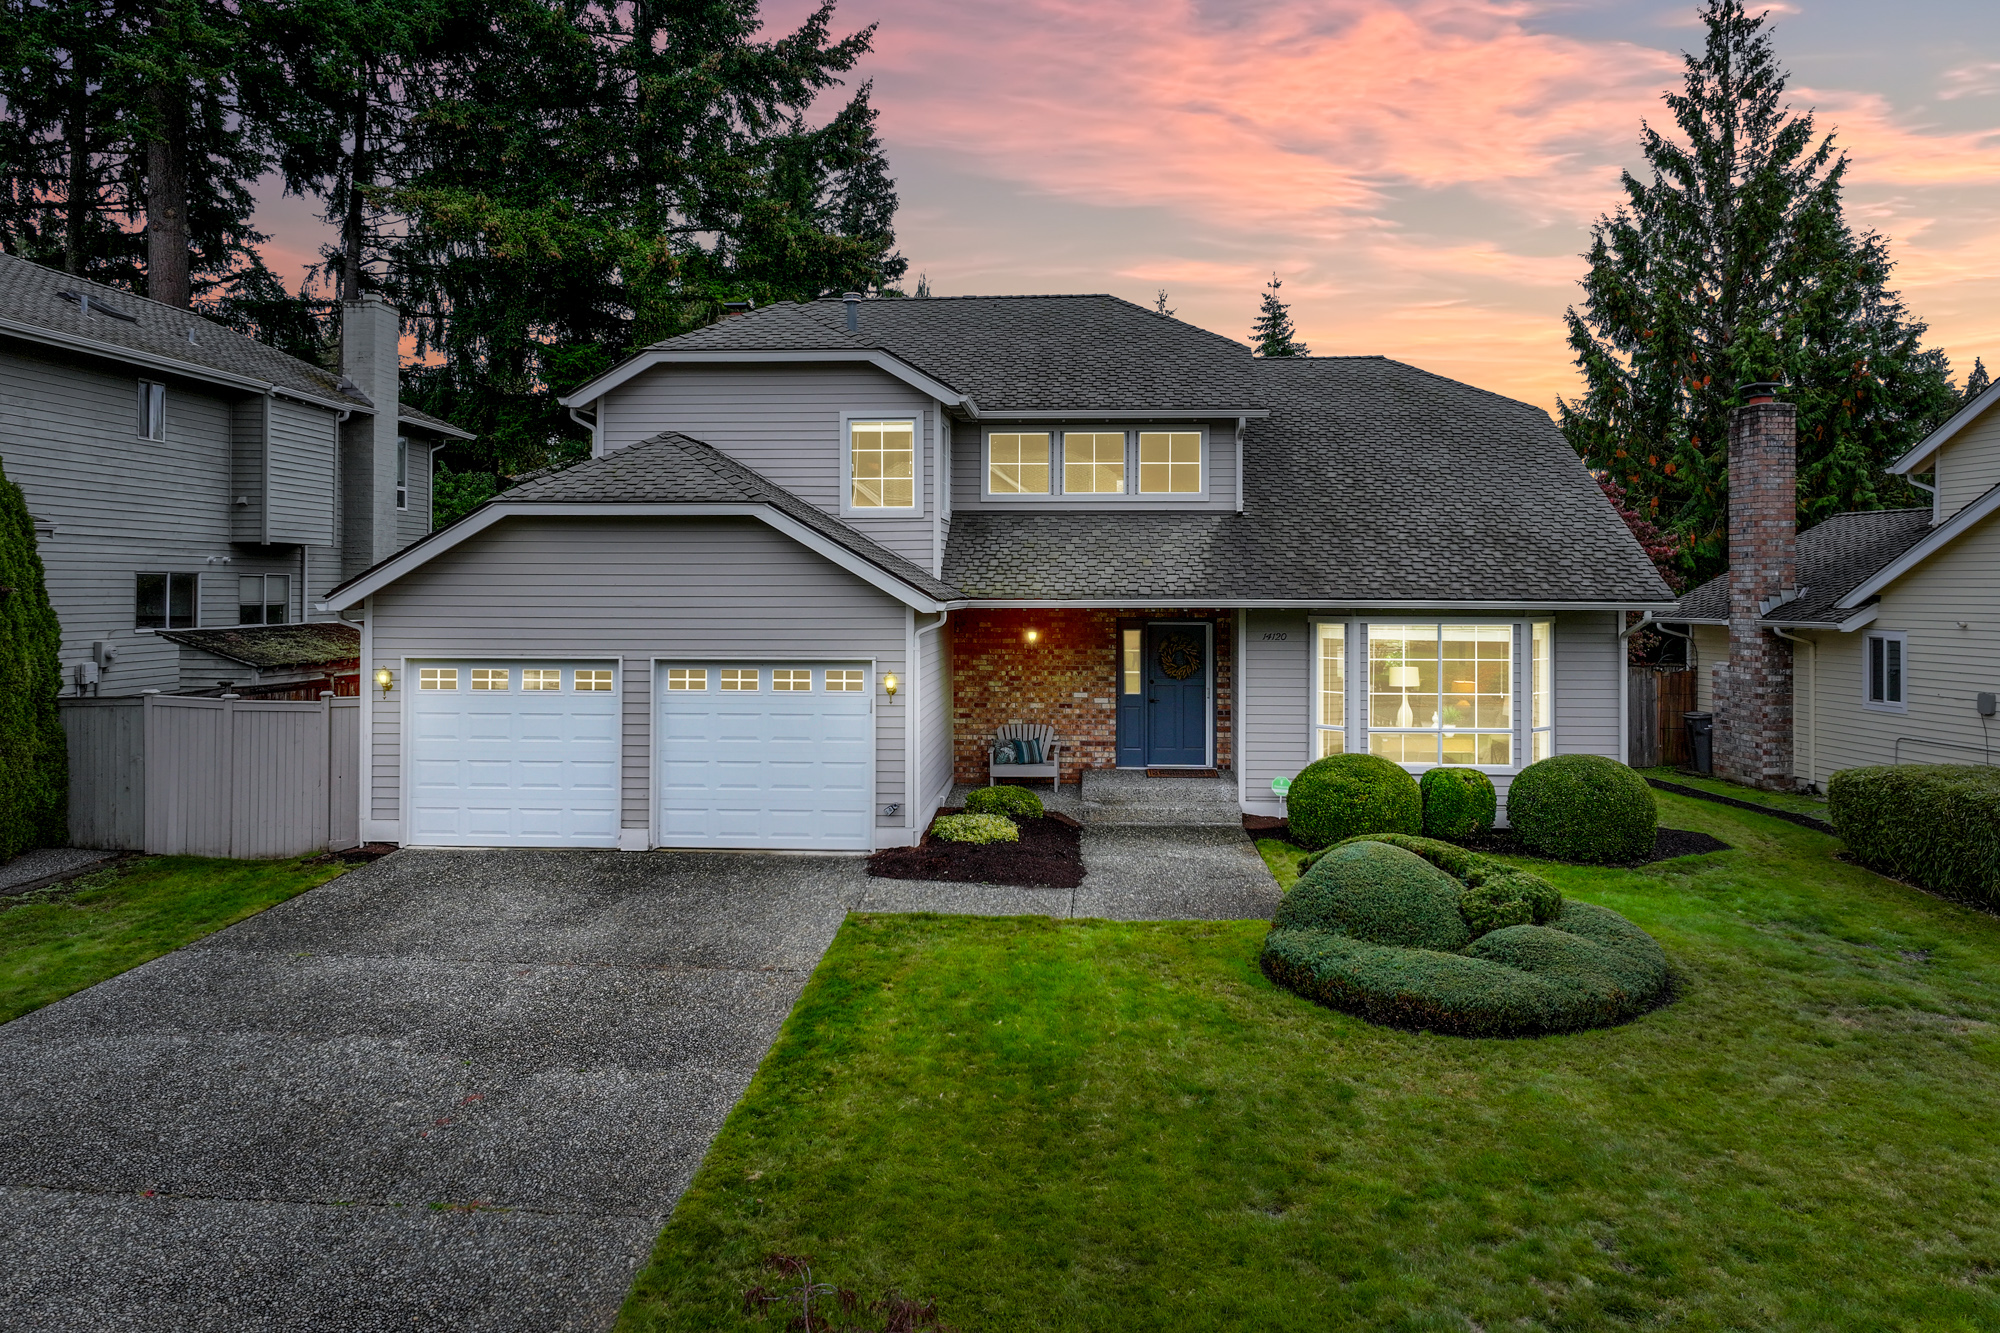
Selling our home in English Hill was a major milestone, and we couldn’t be happier that we...

We have used Tony Meier for two home purchases, and one home sale (and currently working with him...

“Tony and team made our first home buying experience extremely smooth and stress free. His...

"Tony and his team are amazing. Trust what he tells you and do what he says. We did the changes/...

"Tony Meier and Team were extremely helpful in selling our home quickly and efficiently within a...

"It's never easy to say goodbye to a house full of memories and a neighborhood you love. But when...

"My husband Rob and I have always known we would use Tony & his team when the time came to sell...

"We are thrilled to express our gratitude to Tony for his exceptional guidance in our first home...
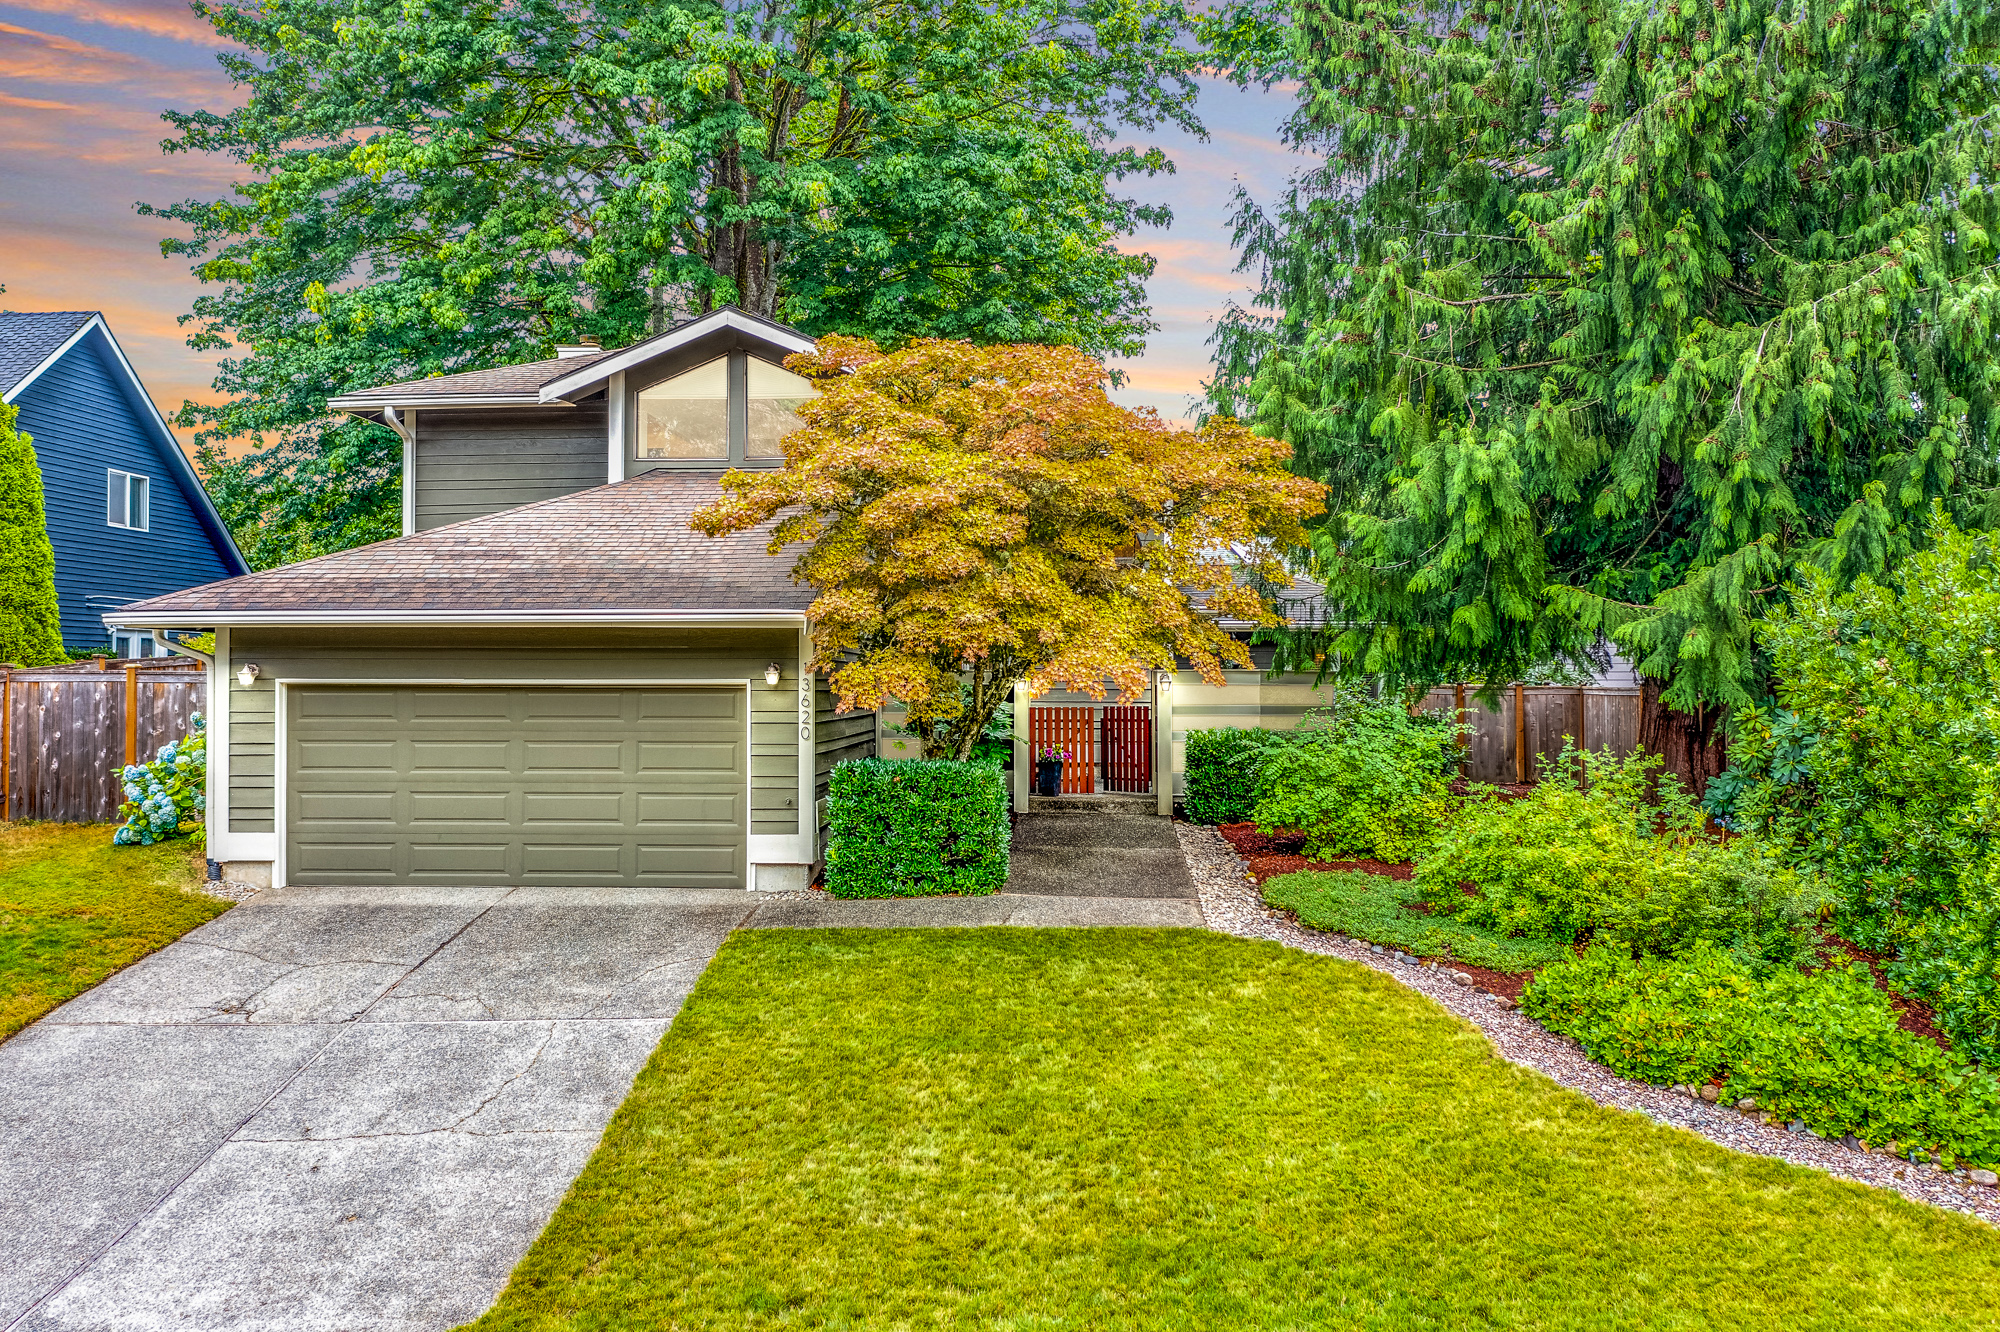
"Tony and Team provided us with resources and support for a smooth and pleasant property sale of...

"Tony and his team made the process of selling our house as easy as it could possibly be. He had...
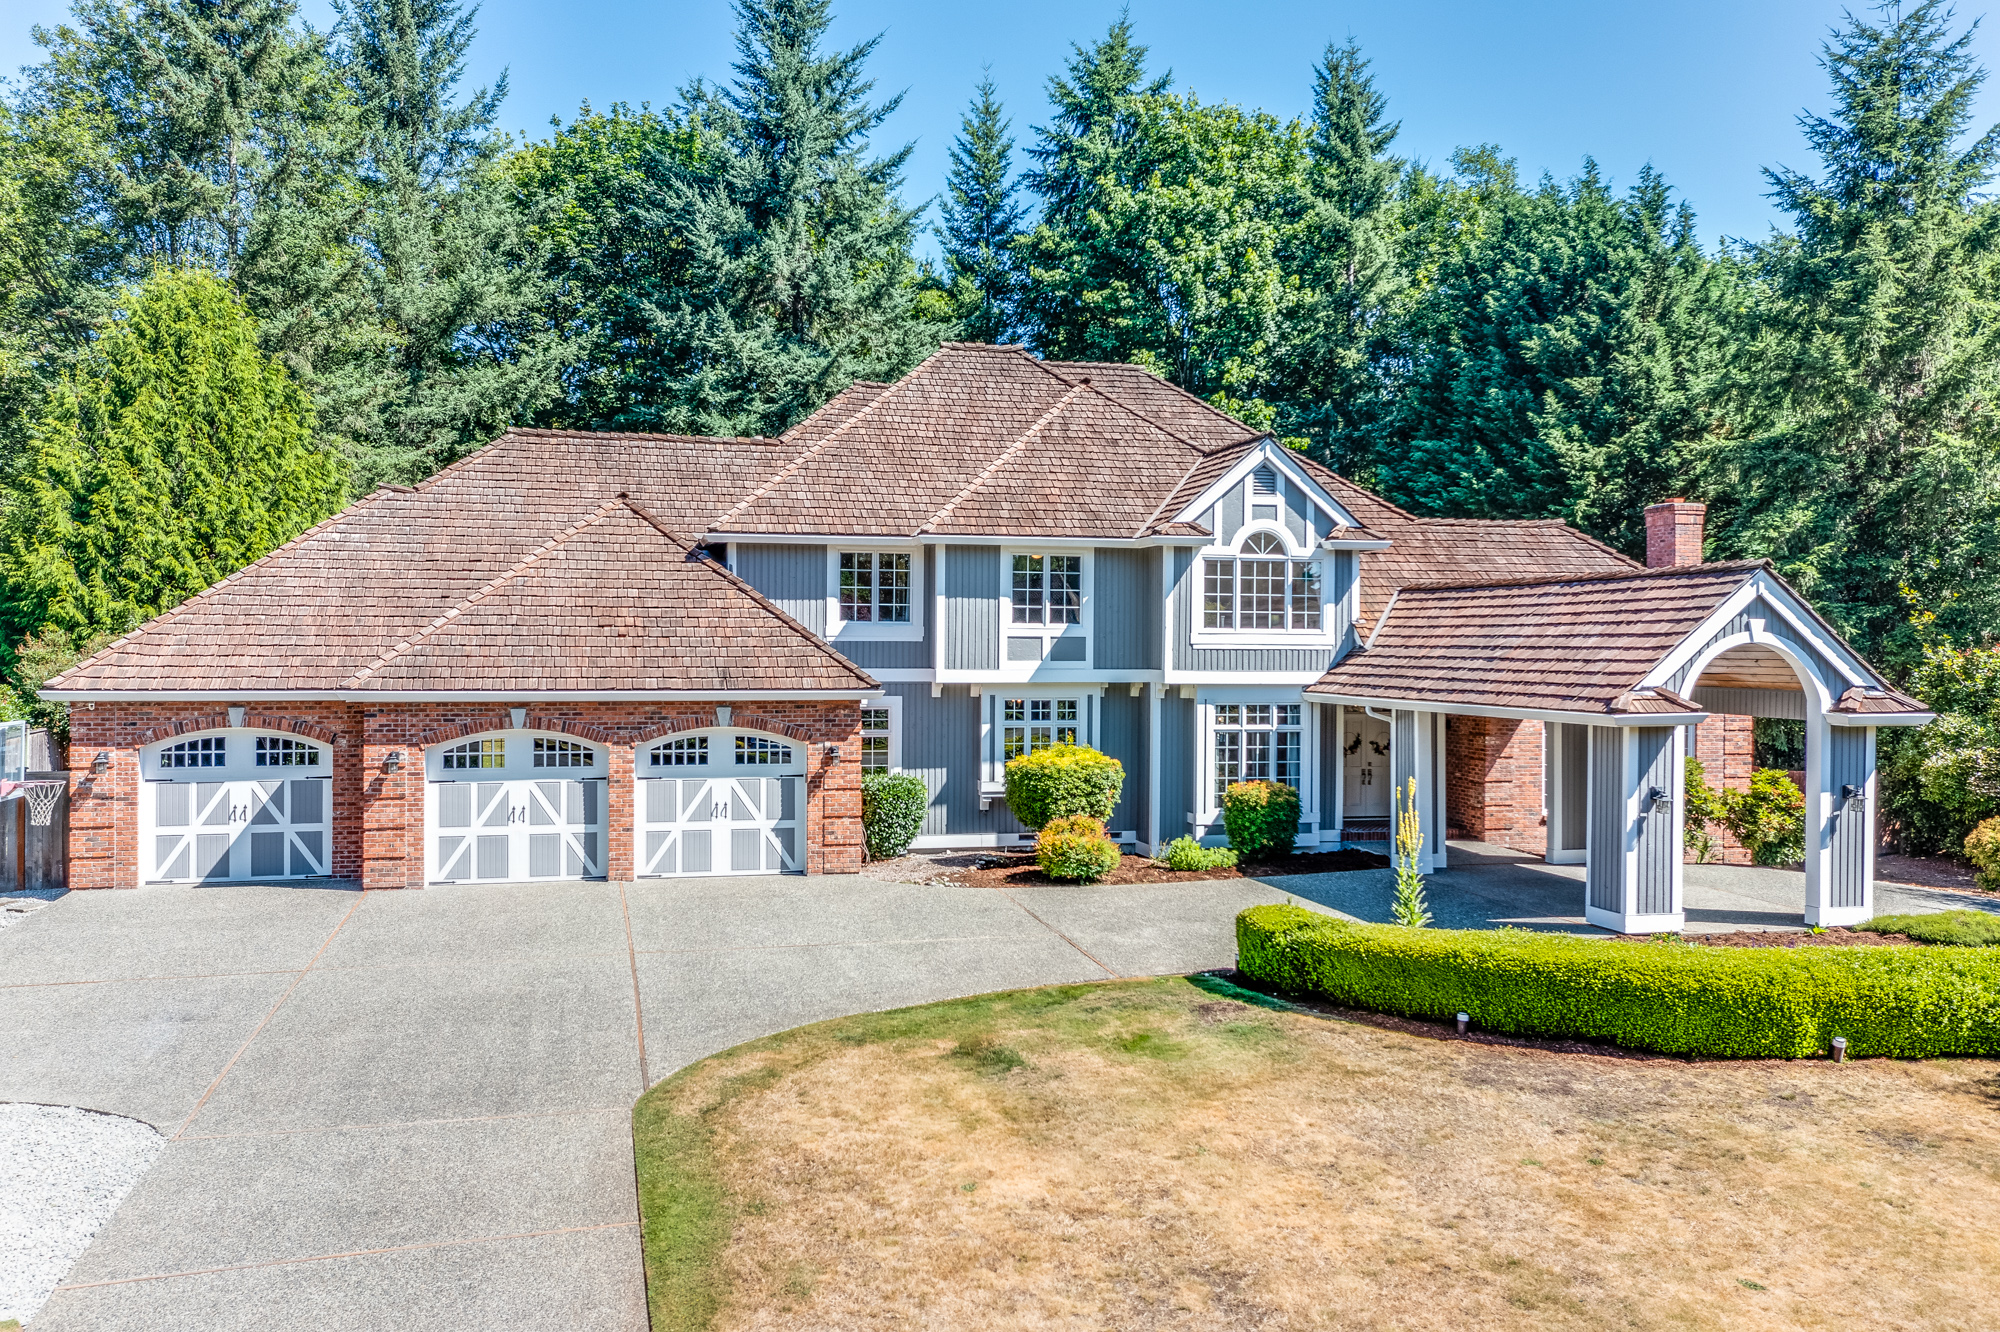
"Tony and his team did an amazing job in helping us sell our home. Tony has a deep understanding of...
Compare listings
Compare