4 Min. Read
Audio Version
Tony Meier | Windermere Real Estate | 37 Years Experience | 803 Closed Eastside Sales
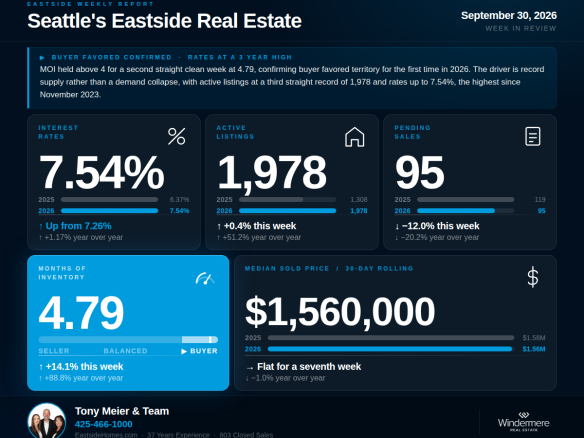
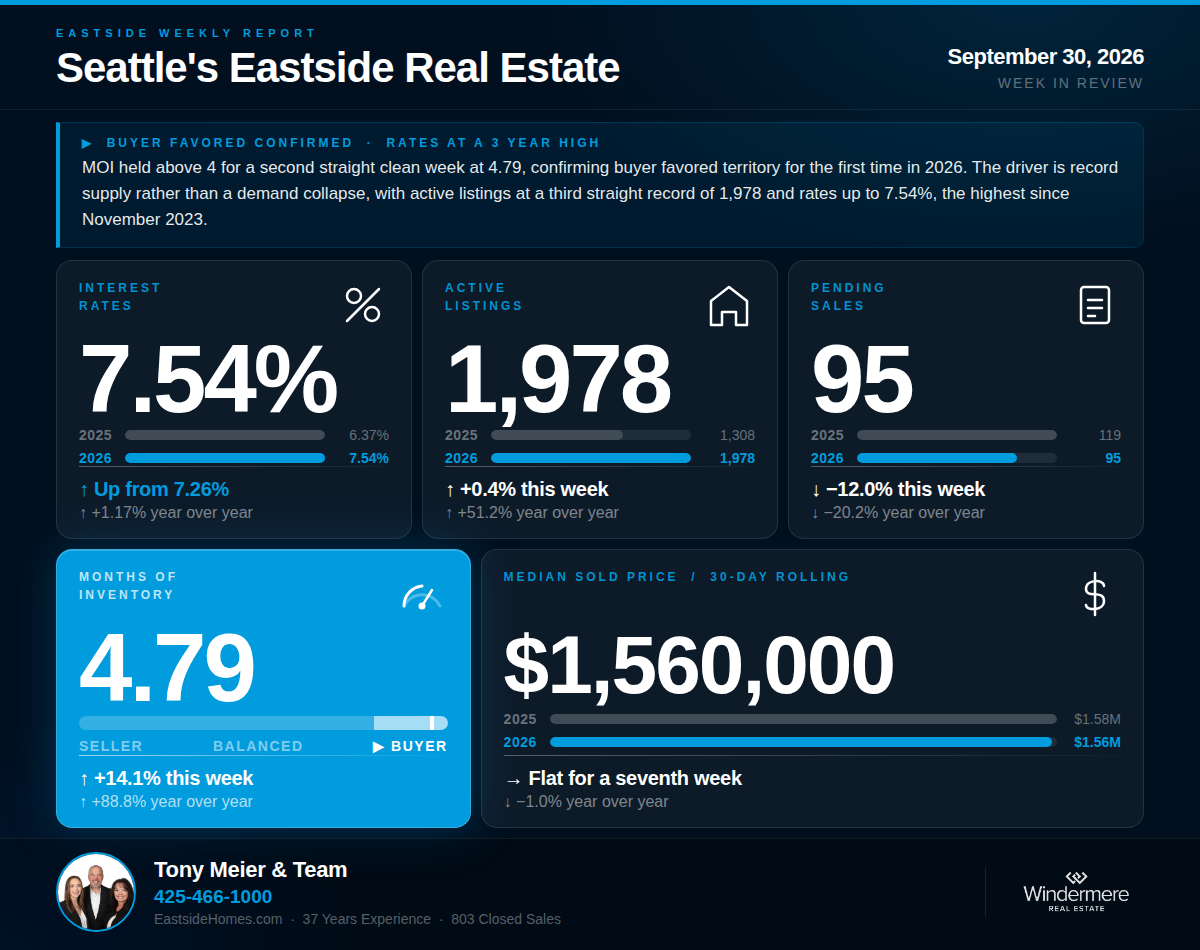
The question we said would define the fall got its answer. MOI held above 4 for a second consecutive clean week, the first time in 2026, confirming buyer-favored territory by the standard we have applied all year. Both forces behind it accelerated: rates jumped 28 basis points to 7.54%, the highest since November 2023, and active listings set a third straight record at 1,978. Pending fell to 95. Twenty years of NWMLS monthly data add the key context: this shift is being driven by a return of supply, not a sudden collapse in demand.
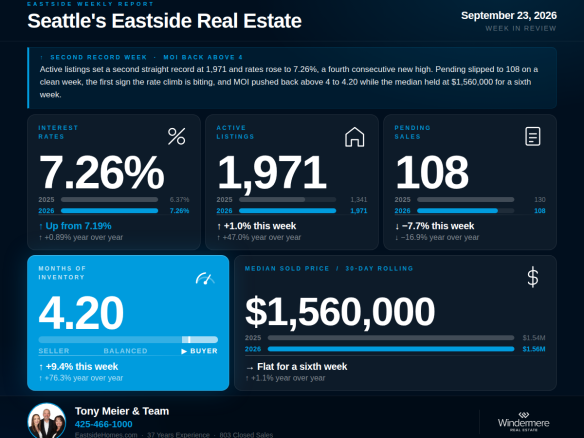
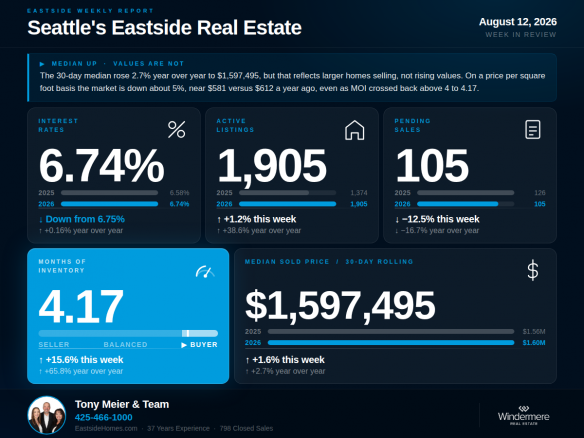
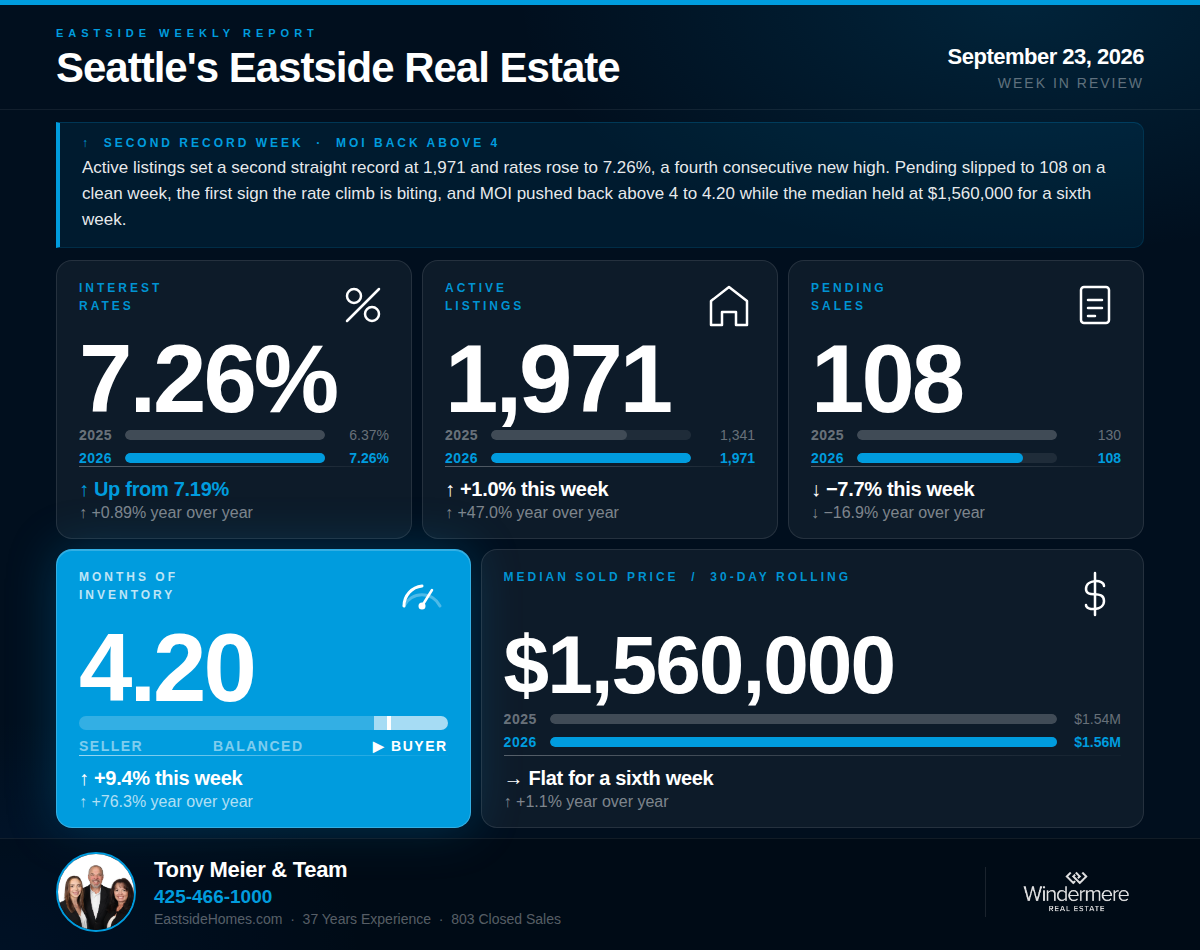
Rates rose to 7.54% this week, up 28 basis points, the largest single-week jump of 2026 and a fifth straight new high. It is the highest reading since November 2023 and above every weekly reading from 2024 and 2025. The six-week climb totals 79 basis points. Against the pre-conflict baseline of 5.99%, that is roughly $1,550 more per month on a $1.5M home. Rates are 1.17% above a year ago.
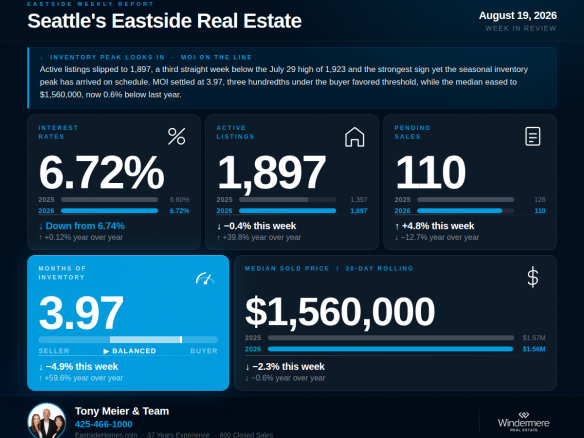
Active listings rose 0.4% to 1,978, a third consecutive record for our six-year weekly series and 51.2% above the 1,308 of a year ago. The monthly record puts that in perspective: August closed at 1,868, the highest August count since 2011, and no month has carried 1,978 listings since then. Growth has slowed from 5.5% to 1.0% to 0.4%, and history says relief is ahead: in each of the past 19 years, active listings fell from August to December, typically by about half.
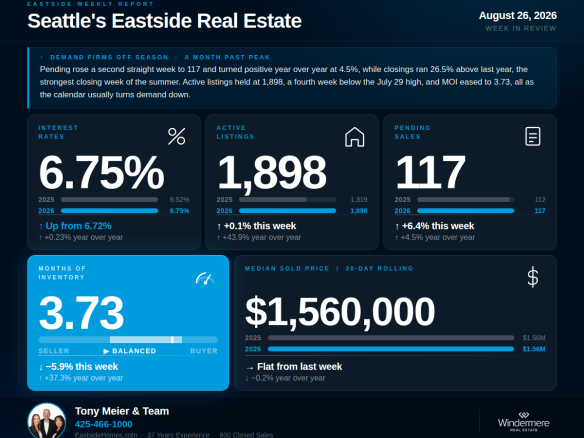
Pending sales fell to 95, down 12.0% from last week and 20.2% from the 119 of a year ago. It is the second straight clean-week decline and the lowest non-holiday reading since early April. Since the rate surge began in late August, clean-week pending has stepped from 130 to 117 to 108 to 95, a 27% slide. The longer view matters: August's monthly pending count was actually up 4% from last year, and the last four Augusts rank among the five weakest in 20 years, alongside only 2008. Thin demand is not new. What is new is a rate surge pushing it lower just as supply peaks.
MOI rose to 4.79, up 14.1% from last week and 88.8% above the 2.54 of a year ago. This is the second consecutive week above 4, the first back-to-back buyer-favored readings of 2026, and neither week carried a holiday distortion. The five-week average of 4.12 sits above the line as well. With record supply and rate-pressured demand behind it, this crossing has more staying power than the seven before it.
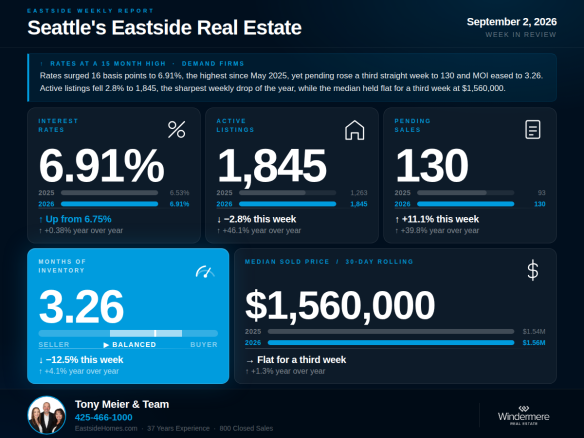
The weekly 30-day median held at $1,560,000 for a seventh consecutive week, 1.0% below a year ago. The monthly figures tell a softer story: August's median closed at $1.45M, 6% below last August and 16% below the April 2022 high of $1.72M, and the January through August average is running 6.9% below 2025, the largest year-to-date decline since 2023. The two measures are built differently, but together they suggest the weekly stability is lagging rather than lasting. Closed sales came in at 110, down 17.3% from the 133 of a year ago.
We have done extensive analysis on what this shift means for sellers in each Eastside sub-market and would welcome the opportunity to walk you through what the data shows for your specific area and home.
If we can help you think through what this means for your move, we are here.
Tony Meier & Team — Windermere Real Estate / NE, Kirkland, WA
Source: NWMLS listing data, compiled and analyzed by Tony Meier & Team through Eastside Market Watch. Statistics not compiled or published by Northwest Multiple Listing Service.
Audio Version
Tony Meier | Windermere Real Estate | 37 Years Experience | 803 Closed Eastside Sales
The question we said would define the fall got its answer. MOI held above 4 for a second consecutive clean week, the first time in 2026, confirming buyer-favored territory by the standard we have applied all year. Both forces behind it accelerated: rates jumped 28 basis points to 7.54%, the highest since November 2023, and active listings set a third straight record at 1,978. Pending fell to 95. Twenty years of NWMLS monthly data add the key context: this shift is being driven by a return of supply, not a sudden collapse in demand.
💰 Interest Rates — 7.54%
↑ Up 28 bp from last week's 7.26% | ↑ Up 1.17% year over yearRates rose to 7.54% this week, up 28 basis points, the largest single-week jump of 2026 and a fifth straight new high. It is the highest reading since November 2023 and above every weekly reading from 2024 and 2025. The six-week climb totals 79 basis points. Against the pre-conflict baseline of 5.99%, that is roughly $1,550 more per month on a $1.5M home. Rates are 1.17% above a year ago.
🏡 Active Listings — 1,978
↑ Up 0.4% from last week | ↑ Up 51.2% year over yearActive listings rose 0.4% to 1,978, a third consecutive record for our six-year weekly series and 51.2% above the 1,308 of a year ago. The monthly record puts that in perspective: August closed at 1,868, the highest August count since 2011, and no month has carried 1,978 listings since then. Growth has slowed from 5.5% to 1.0% to 0.4%, and history says relief is ahead: in each of the past 19 years, active listings fell from August to December, typically by about half.
📝 Pending Sales — 95
↓ Down 12.0% from last week | ↓ Down 20.2% year over yearPending sales fell to 95, down 12.0% from last week and 20.2% from the 119 of a year ago. It is the second straight clean-week decline and the lowest non-holiday reading since early April. Since the rate surge began in late August, clean-week pending has stepped from 130 to 117 to 108 to 95, a 27% slide. The longer view matters: August's monthly pending count was actually up 4% from last year, and the last four Augusts rank among the five weakest in 20 years, alongside only 2008. Thin demand is not new. What is new is a rate surge pushing it lower just as supply peaks.
📦 Months of Inventory — 4.79
↑ Up 14.1% from last week's 4.20 | ↑ Up 88.8% year over yearMOI rose to 4.79, up 14.1% from last week and 88.8% above the 2.54 of a year ago. This is the second consecutive week above 4, the first back-to-back buyer-favored readings of 2026, and neither week carried a holiday distortion. The five-week average of 4.12 sits above the line as well. With record supply and rate-pressured demand behind it, this crossing has more staying power than the seven before it.
🏠 Median Sold Price (Rolling 30-Day) — $1,560,000
→ Flat for a seventh week | ↓ Down 1.0% year over yearThe weekly 30-day median held at $1,560,000 for a seventh consecutive week, 1.0% below a year ago. The monthly figures tell a softer story: August's median closed at $1.45M, 6% below last August and 16% below the April 2022 high of $1.72M, and the January through August average is running 6.9% below 2025, the largest year-to-date decline since 2023. The two measures are built differently, but together they suggest the weekly stability is lagging rather than lasting. Closed sales came in at 110, down 17.3% from the 133 of a year ago.
🔍 The Big Picture — What This All Means
The standoff broke toward buyers. Two clean weeks above 4, record supply, financing at a three-year high, and demand sliding on the rate lag. The 20-year record clarifies the cause: buyer demand has been historically thin since 2023, and the market absorbed it while inventory was scarce. Now supply is back to levels last seen in 2011, and prices are beginning to adjust. Two questions will define the fourth quarter: whether 7.54% is a spike or a plateau, and how quickly the seasonal inventory decline, which has arrived in each of the past 19 years, relieves the pressure.🏠 For Sellers
Sellers, buyer-favored conditions are now confirmed, and the record explains why: supply is at its highest level since 2011, demand remains near two-decade August lows, and buyers are absorbing the most expensive financing since November 2023. Price to the evidence from day one: the newest per-square-foot comparables, not August's, and not the 2024 and 2025 closings. There is perspective too. Active listings have fallen from August to December in each of the past 19 years, typically by about half, and the 2023 price decline was followed by a double-digit gain in 2024. Soft stretches here have not been permanent, but pricing to the old market extends them for the individual seller.We have done extensive analysis on what this shift means for sellers in each Eastside sub-market and would welcome the opportunity to walk you through what the data shows for your specific area and home.
🔑 For Buyers
Buyers, this is your strongest negotiating position of 2026: confirmed buyer-favored conditions, a record 1,978 homes to choose from, and August prices 6% below last year. The obstacle is 7.54% financing, roughly $1,550 a month more than in February on a typical purchase. Solve the rate first, because buydowns, adjustable products, and lender credits are worth more now than at any point in years. Then move while selection is wide, because history says inventory falls by about half between August and December. The leverage is in the negotiation, not the waiting.If we can help you think through what this means for your move, we are here.
Tony Meier & Team — Windermere Real Estate / NE, Kirkland, WA
Source: NWMLS listing data, compiled and analyzed by Tony Meier & Team through Eastside Market Watch. Statistics not compiled or published by Northwest Multiple Listing Service.