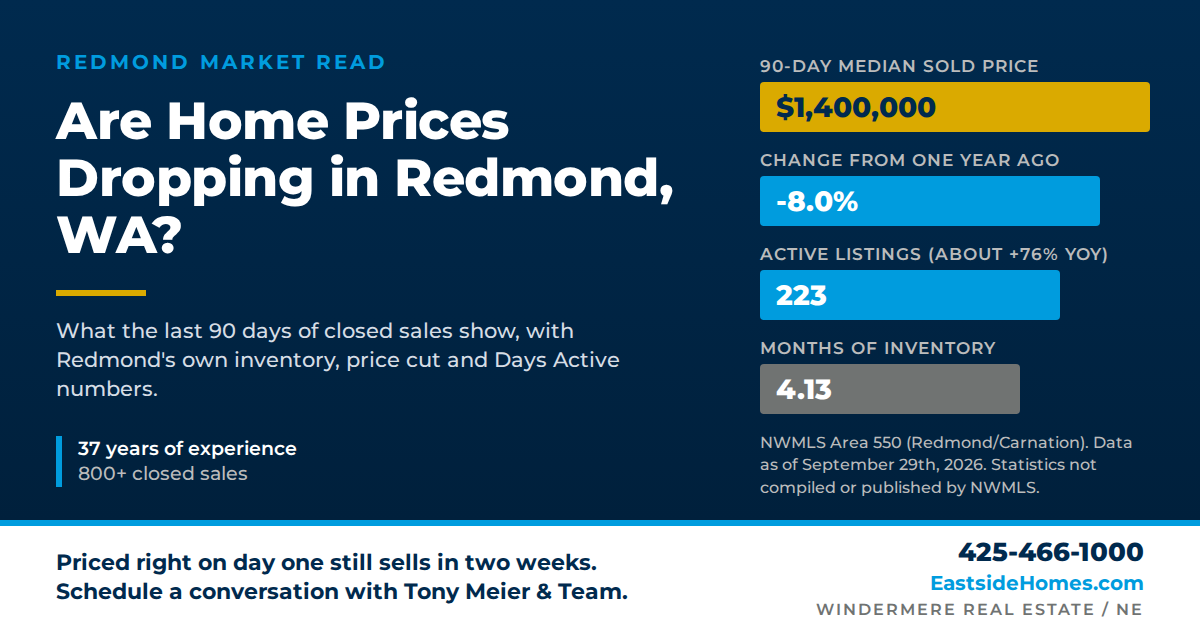
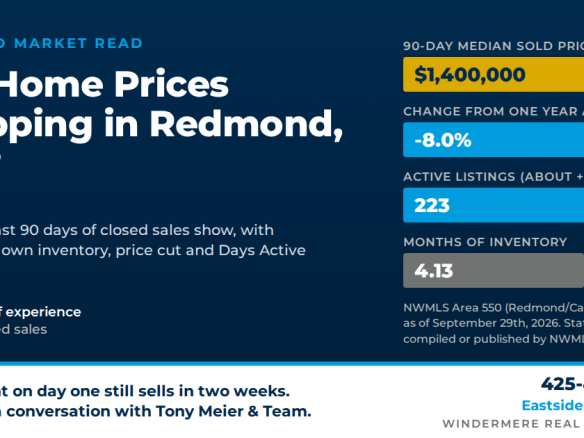
Yes, modestly. The median sold price in Redmond, WA over the last 90 days is
$1,400,000, down 8.0% from $1,521,500 in the same window a year ago and down 6.3% from a month ago. The bigger change is not price. It is supply. Redmond has 223 active listings as of September 29th, 2026, up about 76% from a year ago, and the city's Months of Inventory (MOI) moved from 2.91 (Balanced) to 4.13 (Buyer's Market) in one month. Homes are still selling, at a median of 97.92% of list price, but sellers now compete with far more listings than they did last fall, and the 30-year fixed rate sits at 7.5%.
These are Redmond's own numbers for NWMLS Area 550 (Redmond/Carnation) as of September 29th, 2026, from Eastside Market Watch, Tony Meier & Team's daily database of every NWMLS listing on the Eastside.
Redmond Sold Prices: Now, One Month Ago, One Year Ago
Only 70 homes closed in Redmond in the last 30 days, so that median swings with the mix. The 90-day figure (178 closings) is the steadier read.
| Redmond (Area 550) |
Now (Sep 29th, 2026) |
1 Month Ago |
1 Year Ago |
| Median sold price, 90 days |
$1,400,000 |
$1,494,750 |
$1,521,500 |
| Median sold price, 30 days |
$1,378,500 |
$1,410,000 |
$1,552,500 |
| Closed sales, 90 days |
178 |
174 |
188 |
| Sold to list price, 90 days |
97.92% |
98.28% |
98.40% |
| Sold over list price, 90 days |
10.1% |
9.2% |
18.6% |
| 30-year fixed rate |
7.50% |
6.81% |
6.31% |
Two things stand out. The share of Redmond homes selling over list price has fallen by nearly half in a year, from 18.6% to 10.1%. Yet buyers still pay close to asking on the homes they choose. A 97.92% sold-to-list ratio is not a distressed market. It is a market where the price has to be right on day one.
How Redmond Is Repricing
Price is the last thing to move. Inventory, price reductions, and Days Active (DA) move first, and all three are moving in Redmond right now.
| Redmond (Area 550) |
Now |
1-Month Change |
1-Year Change |
| Active listings |
223 |
+12.6% (from 198) |
about +76% (from about 127) |
| Price reductions, last 30 days |
55 (25% of actives) |
57 a month ago |
n/a |
| Median list price (active) |
$1,700,000 |
+6.3% |
0.0% |
| List price per sq ft (active) |
$608 |
+0.3% |
-5.6% |
| Median Cumulative Days Active (CDA), sold in 90 days |
28.5 |
from 17.5 |
from 11.5 |
| Pending sales, last 30 days |
54 |
-20.6% (from 68) |
-1.8% (from 55) |
| Months of Inventory (MOI) |
4.13 (Buyer's Market) |
from 2.91 (Balanced) |
from 2.31 (Balanced) |
New listings keep arriving (132 in the last 30 days, up 59% from a year ago), pendings slipped 20.6% in a month, and the homes that sold took a median 28.5 days to go pending, up from 11.5 a year ago. One in four active listings has cut its price in the last 30 days. The median asking price, $1,700,000, sits $300,000 above the median price that actually closed. That gap is where the repricing is happening. Redmond is tracking the wider Eastside (90-day median $1,460,000, down 6.7% year over year, MOI 4.52), and its pending momentum reads Steady, so this is a market repricing, not one that has stalled.
What 7.5% Does to a Redmond Payment
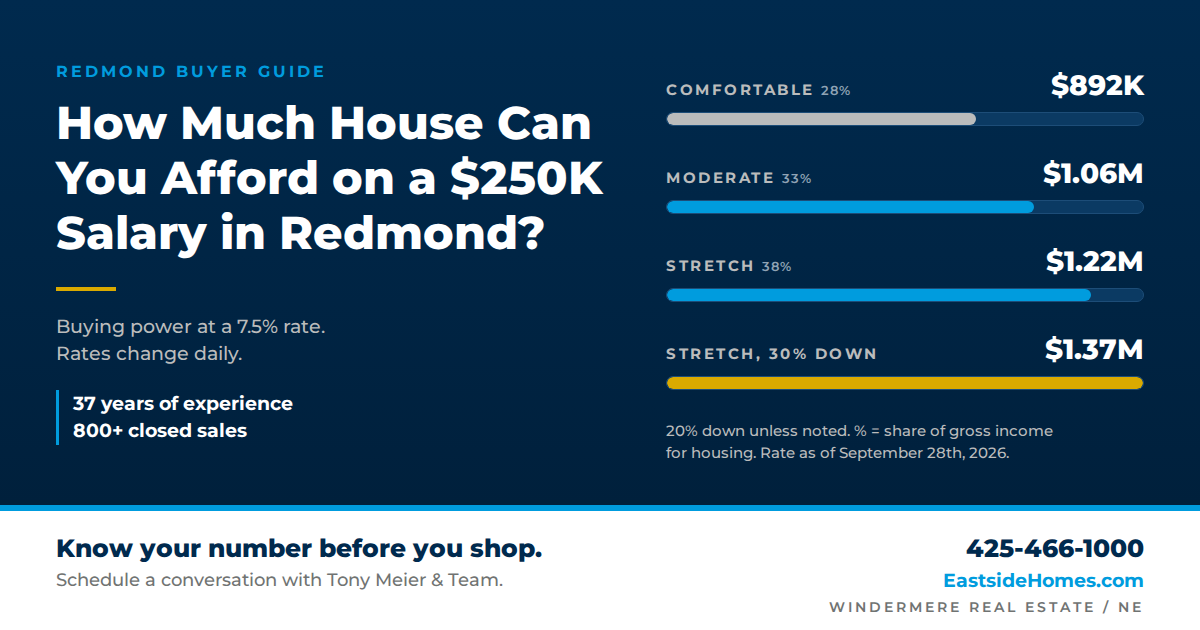
On a $1,400,000 purchase with 20% down, principal and interest on a $1,120,000 loan is about $7,831 per month at 7.5%, versus about $6,940 at last year's 6.31%. That is roughly $891 more per month for the same house, before taxes and insurance. Rates change daily; 7.5% is the Mortgage News Daily 30-year fixed average as of September 28th, 2026.
Here's What I Suggest
If you are selling in Redmond: price to the last 90 days of closed sales, not to what the house down the street is asking. The 55 listings that cut price this month launched above the market and are chasing it; the 10% that sold over list did the opposite. Prepare fully before the first photo and expect the first 14 days to decide your outcome.
If you are buying in Redmond: you have 223 homes to choose from, and one in four sellers has already moved on price. Ask for Days Active and price history before you write. A rate buydown or seller credit is a realistic ask on a listing past 30 days.
Tony Meier & Team brings 37 years of experience and 800 closed sales to every Redmond conversation, with more than $250 million in closed volume since 2020 across 200 transactions. Call or text
425-466-1000 or visit
EastsideHomes.com for a pricing read on your specific home.
Related Reading
How Much House Can You Afford on a $250K Salary in Redmond?
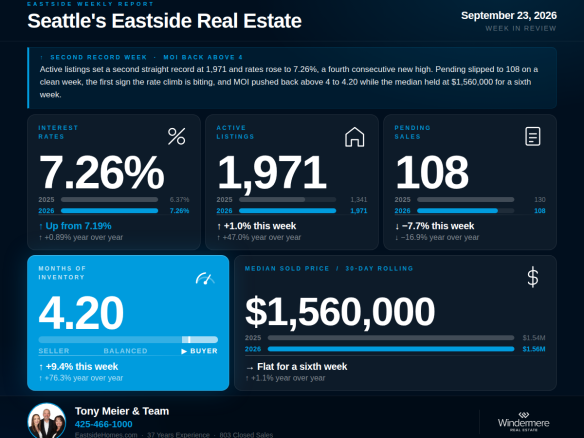
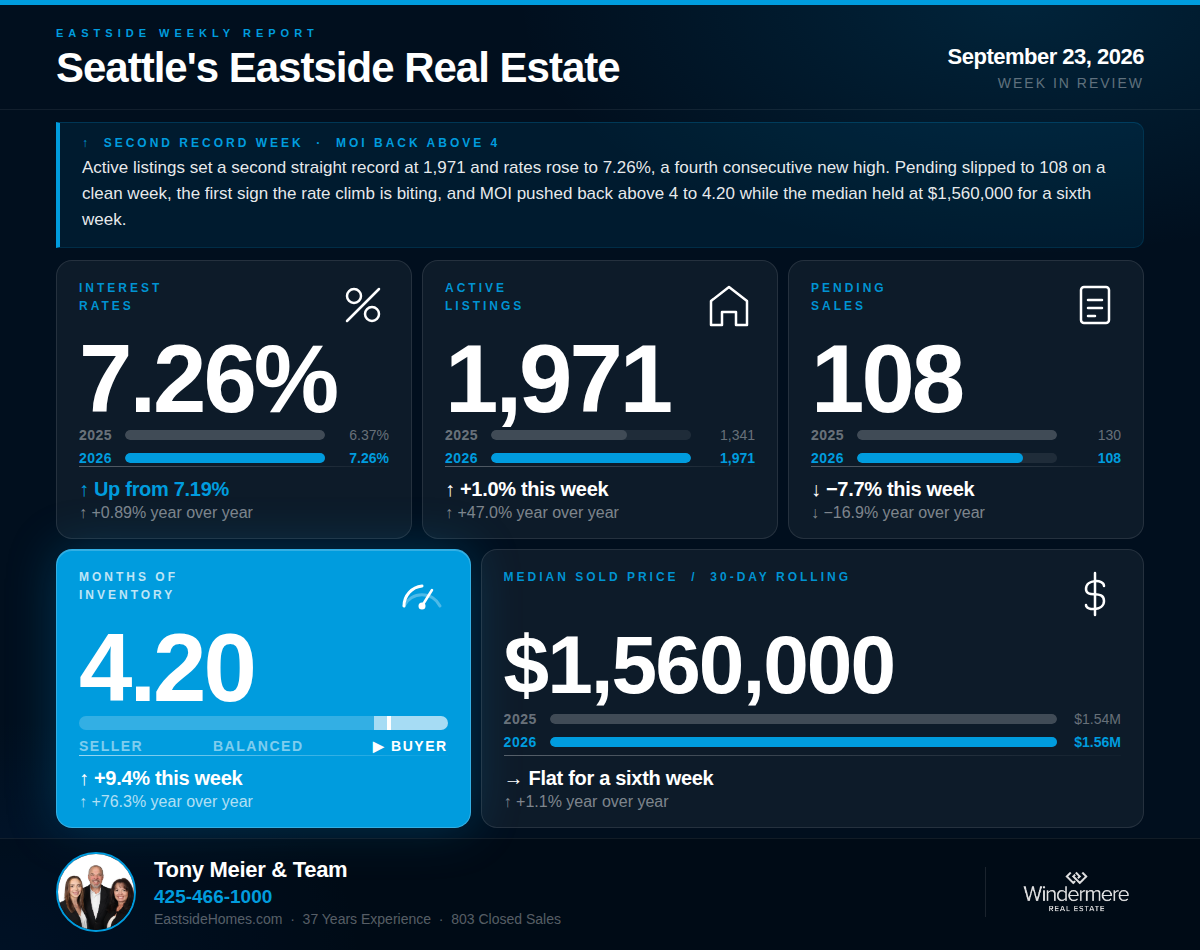
Another Record for Inventory, Another High for Rates: Eastside Real Estate Update 09-23-26
Is Redmond, WA Expensive to Live?
Frequently Asked Questions
What is the median home price in Redmond, WA right now?
The median sold price for the 90 days ending September 29th, 2026 was $1,400,000 across 178 closed sales in NWMLS Area 550. The 30-day median was $1,378,500 on 70 closings.
Are Redmond home prices dropping or just flattening?
The 90-day median is down 8.0% from a year ago, so prices have eased, yet sellers still receive 97.92% of list. The larger shift is inventory: about 76% more active listings than last September.
Is Redmond a buyer's market in fall 2026?
By Months of Inventory, yes. Redmond's MOI is 4.13, above the 4.0 Buyer's Market threshold, up from 2.91 a month ago. Pending momentum is Steady: supply has grown faster than sales, demand has not collapsed.
How long does it take to sell a house in Redmond?
Homes that closed in the last 90 days had a median of 28.5 Cumulative Days Active before going pending, up from 11.5 days a year earlier. Homes priced to the recent comps still move in the first two weeks.
Data as of September 29th, 2026, from Eastside Market Watch (Tony Meier & Team) for NWMLS Area 550 (Redmond/Carnation). Active listing prices are as of the latest feed and are provisional; sold figures are final. One-year active counts are reconstructed and approximate. Mortgage rate is the Mortgage News Daily 30-year fixed average as of September 28th, 2026; rates change daily. Payment examples are estimates for principal and interest only. Statistics not compiled or published by NWMLS.
Tony Meier & Team | Windermere Real Estate / NE | Kirkland, WA
425-466-1000 | tony@windermere.com | EastsideHomes.com