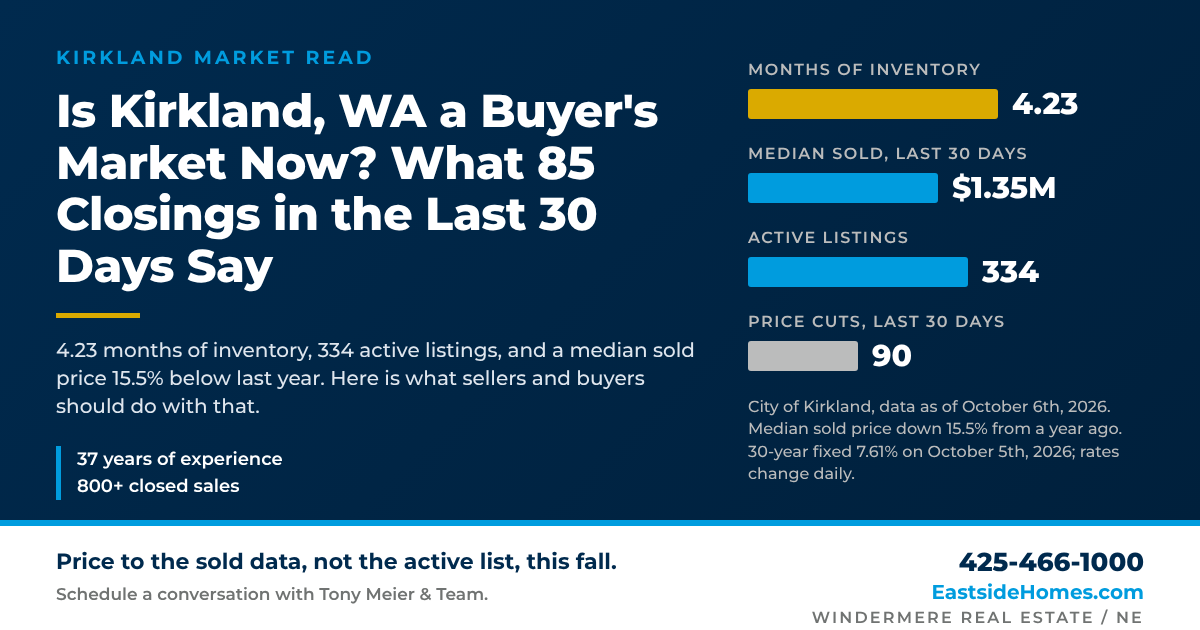
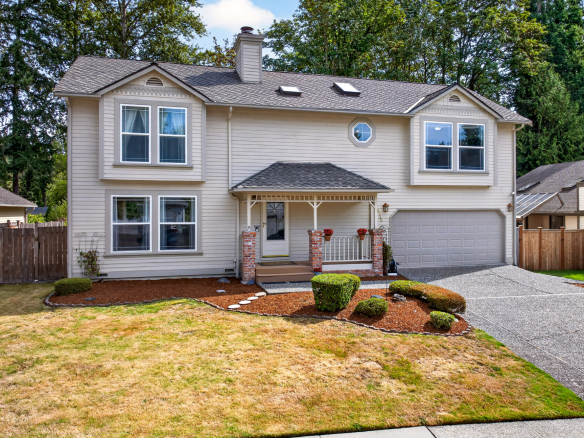
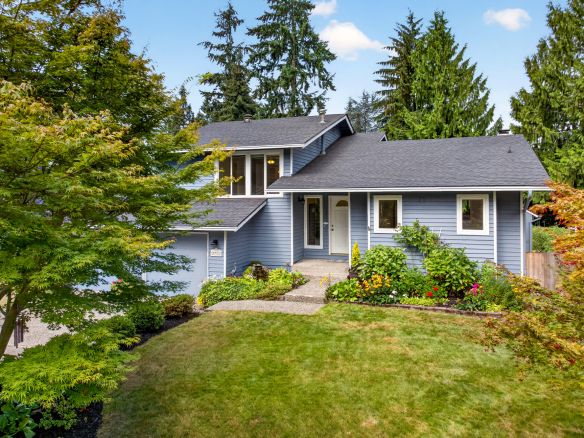
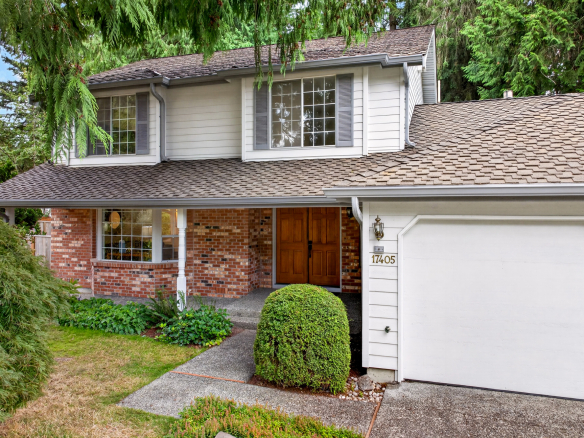
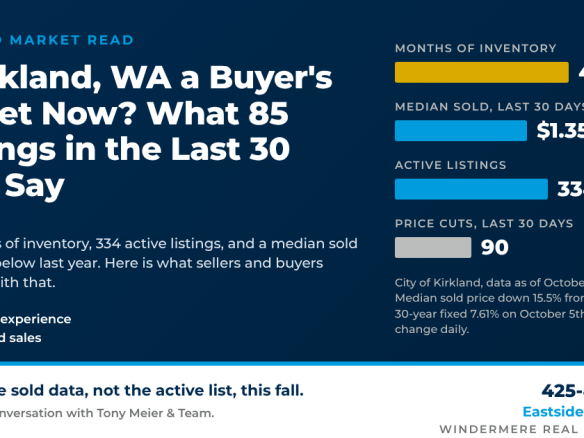
Yes. By the numbers, Kirkland is a buyer's market as of October 6th, 2026. The city carries 4.23 months of inventory, with 334 active listings against 79 homes going pending in the last 30 days. The median sold price for the 85 closings in the last 30 days was $1,350,000, down 15.5% from $1,597,500 a year ago, and 90 of those 334 active listings have reduced their price in the last 30 days. The figures come from Eastside Market Watch, Tony Meier & Team's daily database of every NWMLS listing on the Eastside, and they cover the City of Kirkland, which spans NWMLS Area 560 (Kirkland/Bridle Trails) and the Kirkland portion of Area 600 (Juanita/Woodinville).
What "Buyer's Market" Means in Kirkland
We label the market with months of inventory (MOI): active and contingent listings divided by the trailing 30-day pending pace. Under 2 months favors sellers, 2 to 4 is balanced, and above 4 favors buyers. Kirkland sat at 2.78 months a year ago and 3.47 one month ago, both balanced. It crossed to 4.23 this week. Demand is steady rather than collapsing: the last three 30-day slices ran 89, 89, and 79 pendings. What changed is supply. Active listings are up 8.1% in a month and about 58% in a year, and 220 new listings arrived in the last 30 days, 63% more than the prior 30.
| Kirkland |
Now |
1 month ago |
1 year ago |
| Months of inventory |
4.23 (Buyer's) |
3.47 (Balanced) |
2.78 (Balanced) |
| Active listings |
334 |
309 |
about 211 |
| Pendings, last 30 days |
79 |
89 |
76 |
| Median sold price, last 30 days |
$1,350,000 |
$1,302,500 |
$1,597,500 |
| Median sold price, last 90 days |
$1,357,500 |
$1,450,000 |
$1,650,000 |
| 30-year fixed rate |
7.61% |
6.89% |
6.29% |
Prices: Down From Last Year, Flat From Last Month
The 30-day median of $1,350,000 is 15.5% below the same window a year ago, and the 90-day median of $1,357,500 (248 closings) is 17.7% below last year's $1,650,000. Both windows agree, so this is not a one month mix quirk. Month to month, the 30-day median edged up 3.6%. Negotiation has shifted too. Sellers closed at a median 98.08% of list price over the last 90 days, and only 10.1% of sales closed above list, versus 17.4% a year ago. In the last 30 days that share fell to 4.7%: a year ago nearly one in five Kirkland sales had a bidding war, today it is about one in twenty.
How Kirkland Is Repricing
Every seller needs to see this part: not just what homes are selling for, but how the homes still for sale are adjusting to find a buyer.
| Repricing measure |
Now |
1-month change |
1-year change |
| Active listings |
334 |
+8.1% |
about +58% |
| Price reductions, last 30 days |
90 |
+36.4% (from 66) |
n/a |
| Median list price (active) |
$1,524,500 |
+1.6% |
-15.1% |
| List price per sq ft (active) |
$702 |
+1.7% |
-6.1% |
| Median Cumulative Days Active (CDA), sold last 90 days |
27 |
+28.6% (from 21) |
+74% (from 15.5) |
Read the two tables together. Homes that are selling trade at a median of $1,350,000. Homes still for sale are listed at a median of $1,524,500, and asking price per square foot nudged up this month while sold prices did not. That gap is why 90 listings, about 27% of everything active, cut their price in the last 30 days, and why the median Days Active (DA) for a home that eventually sells has stretched from 15.5 days a year ago to 27 today. The 30-year fixed rate at 7.61% as of October 5th, 2026, up 72 basis points in a month, does the rest. Rates change daily.
Here's What I Suggest
If you are selling in Kirkland this fall, price to the sold data, not the active list. Homes that launched near the 90-day median and showed well are still going pending in a few weeks. Homes that launched at a 2025 number are the ones in the price reduction column, and a cut after 30 days rarely recovers the buyers who passed in week one. Launch on a Wednesday, hold one concentrated open house, and build your net sheet at today's rate.
If you are buying, this is the most selection Kirkland has offered in years, and with 4.7% of sales closing above list you can write an offer with an inspection contingency and a realistic price. Prioritize homes with a long CDA and a recent reduction; those sellers have already accepted the market. Lock your rate when you go pending and ask about a buydown.
Thinking about a Kirkland move in either direction? Call or text Tony Meier & Team at 425-466-1000, or start at
EastsideHomes.com. We will pull the current numbers for your neighborhood and price band before you decide.
Related reading:
Buyer-Favored Territory Confirmed as Rates Hit a Three-Year High,
Eastside Crosses Into Buyer Territory for the First Time Since 2011, and
Are Home Prices Dropping in Redmond, WA?
Frequently Asked Questions
Is Kirkland a buyer's market or a seller's market right now?
A buyer's market by the inventory measure. Kirkland has 4.23 months of inventory as of October 6th, 2026, above the 4 month line that separates balanced from a buyer's market. A year ago it was 2.78 months.
Are home prices dropping in Kirkland?
Compared with last year, yes. The median sold price over the last 30 days is $1,350,000, down 15.5% from $1,597,500 a year ago, and the 90-day median is down 17.7%. Month to month, prices are roughly flat.
How long does it take to sell a house in Kirkland?
The median home that closed in the last 90 days spent 27 Cumulative Days Active before going pending, up from 15.5 days a year ago. Homes priced to the sold data still move faster.
Should I wait to sell my Kirkland home until the market improves?
Nobody can promise a better spring. Today the data shows 334 competing listings, 220 new ones in the last 30 days, and a 7.61% rate. If you need to sell in the next 12 months, a correctly priced launch now faces less competition than it may in March, when new listings typically surge.
Data as of October 6th, 2026, from Eastside Market Watch (Tony Meier & Team) for the City of Kirkland, which spans NWMLS Area 560 (Kirkland/Bridle Trails) and the Kirkland portion of Area 600 (Juanita/Woodinville). Active listing counts and list prices are as of the latest NWMLS feed and are provisional; the year-ago active count is reconstructed and approximate. Sold figures are final. The 30-year fixed rate is the Mortgage News Daily reading for October 5th, 2026, and rates change daily. Source: NWMLS listing data, compiled and analyzed by Tony Meier & Team through Eastside Market Watch. Statistics not compiled or published by Northwest Multiple Listing Service.
Tony Meier & Team | Windermere Real Estate / NE | 37 years of experience, 803 closed residential sales | $254M+ in closed volume since 2020 across 203 transactions | 219 sales serving the English Hill Area, resident since 2001 | 425-466-1000 | EastsideHomes.com