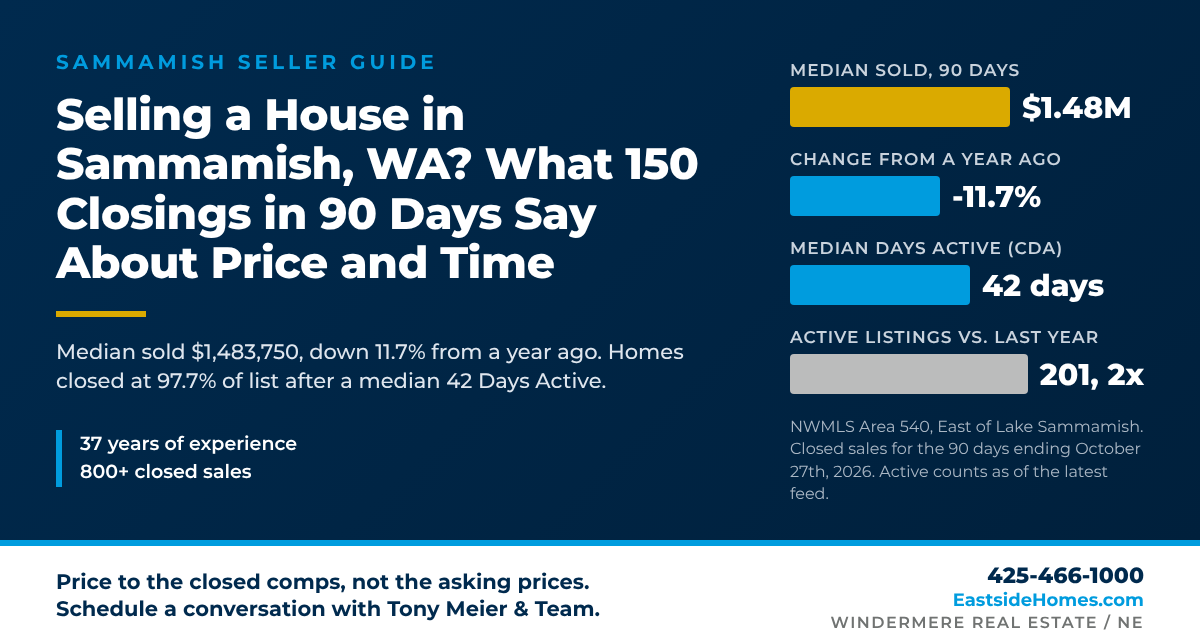
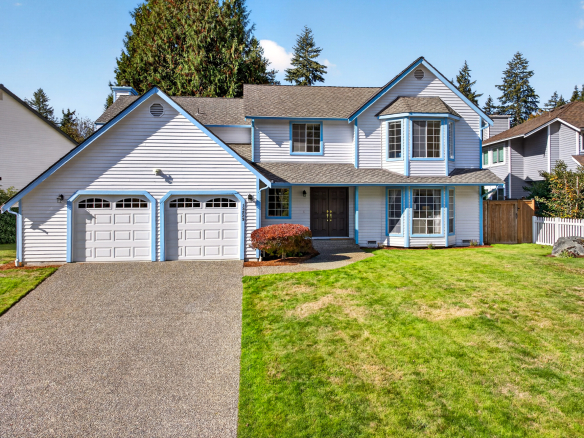
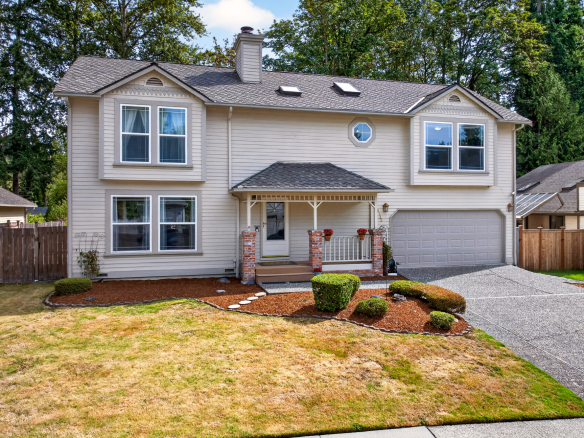
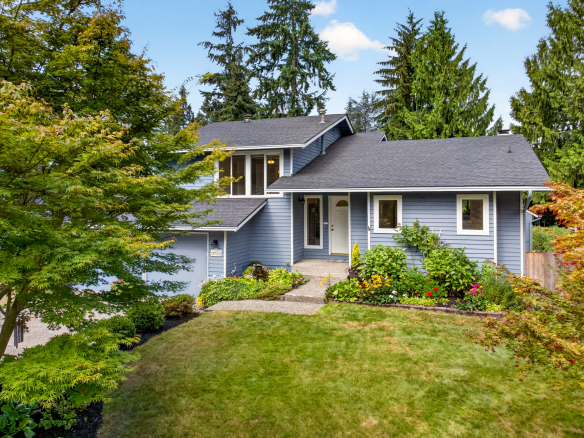
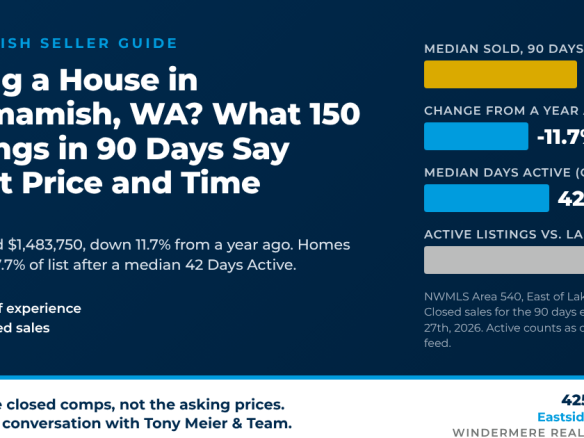
If you are selling a house in Sammamish, WA this fall, plan on a buyer paying close to the closed comps, not the asking prices around you, and plan on waiting longer than sellers did a year ago. Across the 150 Sammamish homes that closed in the last 90 days, the median sold price was $1,483,750, down 11.7% from $1,680,000 a year ago. Those homes closed at a median 97.7% of their final list price after a median 42 Cumulative Days Active (CDA), ten days longer than the 32 days a year earlier. Meanwhile the median asking price on the 201 active Sammamish listings is $1,699,000, so the typical closed home is selling at about 87% of the typical asking price. Data as of October 27th, 2026, from Eastside Market Watch, Tony Meier & Team's daily database of every NWMLS listing on the Eastside, for NWMLS Area 540 (East of Lake Sammamish).
What Sammamish Homes Are Actually Selling For
Sammamish had 54 closings in the last 30 days, which is a small enough sample that the monthly median swings with the mix of homes that happen to close. The 90-day figures below are the ones to price from.
| Closed sales (Sammamish) |
Now |
1 month ago |
1 year ago |
| Median sold price, last 90 days |
$1,483,750 |
$1,600,000 |
$1,680,000 |
| Median sold price, last 30 days |
$1,445,000 |
$1,656,500 |
$1,725,000 |
| Closings, last 90 days |
150 |
154 |
175 |
| Sold price as % of list, last 90 days |
97.7% |
97.6% |
97.7% |
| Share sold over list, last 90 days |
12.0% |
9.7% |
11.4% |
| Median CDA, closings in last 90 days |
42 days |
33 days |
32 days |
The sold-to-list ratio did not change: buyers paid about 97.7% of the final asking price a year ago and they pay the same today. What changed is the price sellers had to reach before an offer arrived, and how long that took. The 42-day median CDA is the longest of any major Eastside city right now.
How Sammamish Is Repricing
This is the table to read before you set a list price. Active list prices are as of the latest feed and provisional until re-verified against live MLS data; the one-year active count is reconstructed, so read it as about 96.
| Active market (Sammamish) |
Now |
1-month change |
1-year change |
| Active listings |
201 |
-18.6% (from 247) |
+109.4% (from about 96) |
| Price reductions, last 30 days |
47 |
-40.5% (from 79) |
n/a |
| Median list price |
$1,699,000 |
+1.1% (from $1,680,000) |
-1.4% (from $1,722,500) |
| List price per square foot |
$562 |
-0.9% (from $567) |
-10.1% (from $625) |
| Median CDA, closings in last 90 days |
42 days |
+9 days (from 33) |
+10 days (from 32) |
Inventory is still roughly double last year's, but it is shrinking as the season turns: active listings fell 18.6% in a month, and only 75 new Sammamish listings launched in the last 30 days against 126 the month before. Asking prices have barely moved, though. The median list price of $1,699,000 sits more than $215,000 above the median closed price, and 47 of the 201 active listings, about one in four, took a price cut in the last 30 days to start closing that gap.
Where Demand Stands
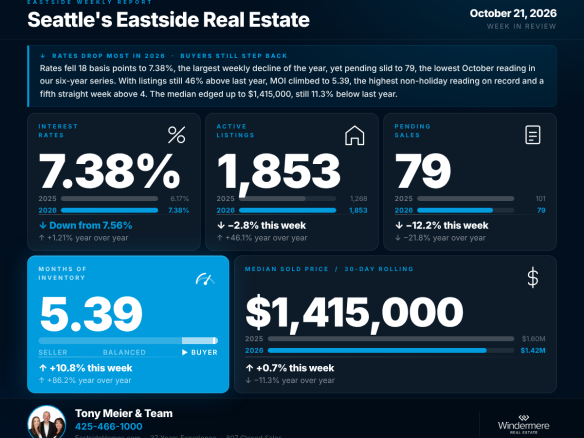
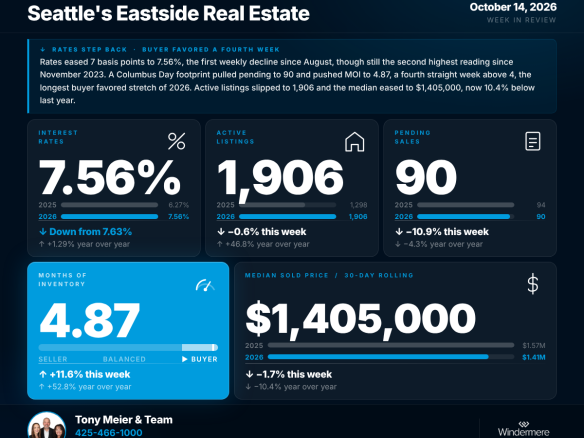
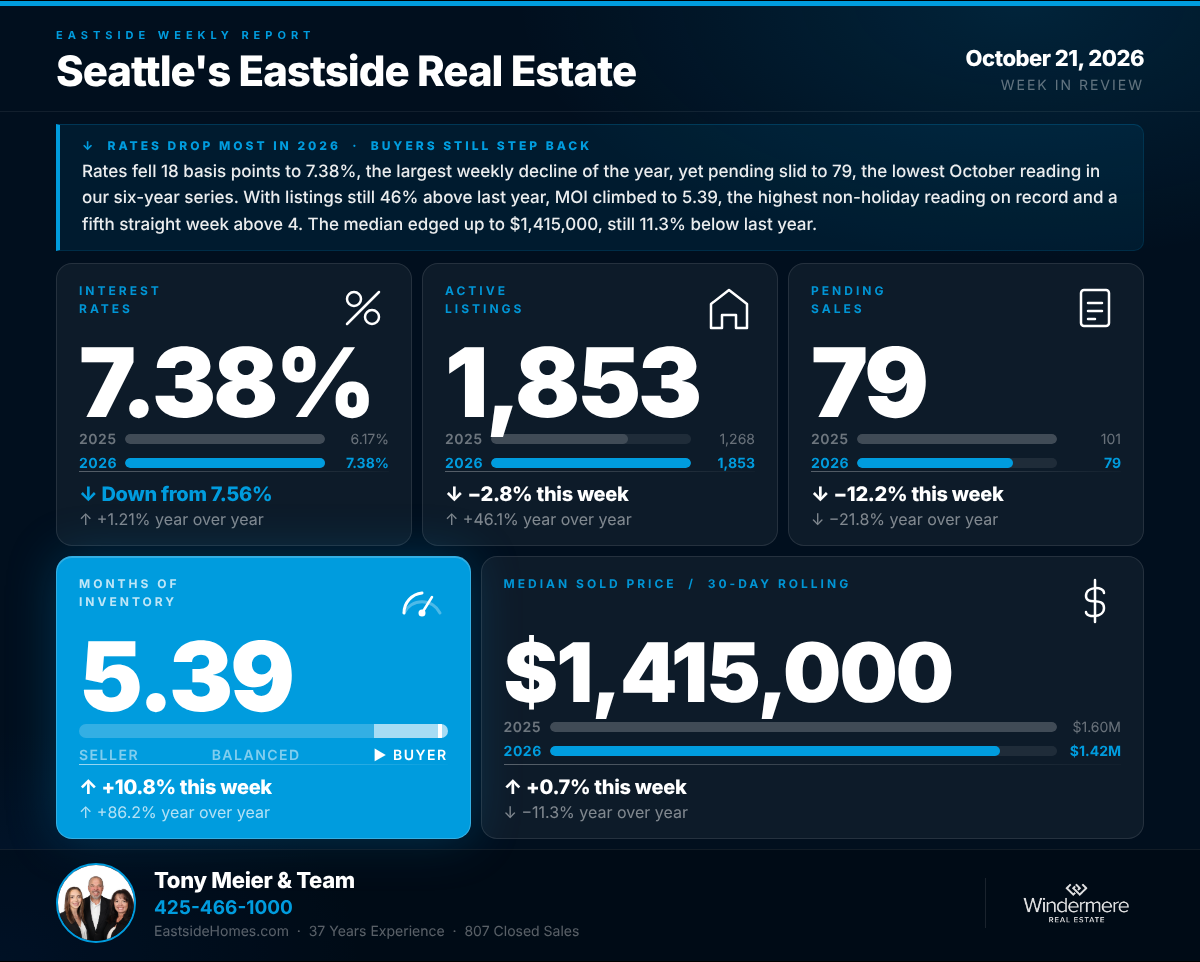
Forty-four Sammamish homes went pending in the last 30 days, down 24.1% from 58 a month earlier, though still above the 36 of a year ago. The last three 30-day windows ran 47, 58, then 44, which our momentum model reads as Steady. With 201 active listings against that pace, Sammamish sits at 4.57 months of inventory, a Buyer's Market on our thresholds (0 to 2 Seller's, 2 to 4 Balanced, 4 and up Buyer's), compared with 2.67 months and Balanced a year ago. The 30-year fixed rate is 7.33% as of October 26th, 2026, down from 7.43% a month ago but well above 6.156% a year ago. Rates change daily.
Here's What I Suggest
If you are selling in Sammamish: the 150 closed sales are your pricing guide, not the 201 asking prices. Homes that launch near the closed comps are the ones in the 12% that sell over list; homes that launch near the median asking price are the ones taking a cut after a month. Launch on a Wednesday, hold one concentrated Saturday open house, and treat the first weekend as the whole window. Fewer new listings each week means less competition for a well-priced home right now.
If you are buying in Sammamish: you have about twice last year's selection, a quarter of it with a recent price reduction, in a market closing at 97.7% of list. Ask for the price-change history on any home past 30 days of CDA before you write. Related reads:
What Are Home Prices Doing in Issaquah, WA?,
Are Home Prices Going Down in Bellevue, WA?, and
How Much Below Asking Can You Offer on the Eastside?
Want to know what these numbers mean for your Sammamish home or your search? Call or text Tony Meier & Team at 425-466-1000 or visit EastsideHomes.com. With 37 years of experience, 807 closed residential sales, and $258M+ in closed volume across 207 transactions since 2020, we can show you exactly where your home sits against the last 90 days of closings.
Frequently Asked Questions
What is the average home price in Sammamish, WA?
The median closed price over the last 90 days is $1,483,750, down 11.7% from a year ago. The median asking price on active listings is higher, at $1,699,000.
How long does it take to sell a house in Sammamish?
The median CDA for homes that closed in the last 90 days is 42 days, up from 32 days a year ago, pulled up by listings that launched high and reduced.
Is Sammamish a buyer's market right now?
Yes by inventory. Sammamish has 4.57 months of inventory, above the 4-month Buyer's Market line, against 2.67 months and Balanced a year ago.
Data as of October 27th, 2026, from Eastside Market Watch (Tony Meier & Team) for NWMLS Area 540 (East of Lake Sammamish). One-month comparisons are to September 27th, 2026, and one-year comparisons to October 27th, 2025. Active list prices are as of the latest feed and are provisional until verified against live MLS data; the one-year active count is reconstructed. Months of inventory is (Active + Contingent + First Look) divided by the trailing 30-day pending pace. The 30-year fixed rate of 7.33% is the Mortgage News Daily reading for October 26th, 2026; rates change daily. Source: NWMLS listing data, compiled and analyzed by Tony Meier & Team through Eastside Market Watch. Statistics not compiled or published by Northwest Multiple Listing Service.
Tony Meier & Team | Windermere Real Estate / NE | Kirkland, WA | 425-466-1000 | EastsideHomes.com | 219 closed sales serving the English Hill Area, English Hill resident since 2001