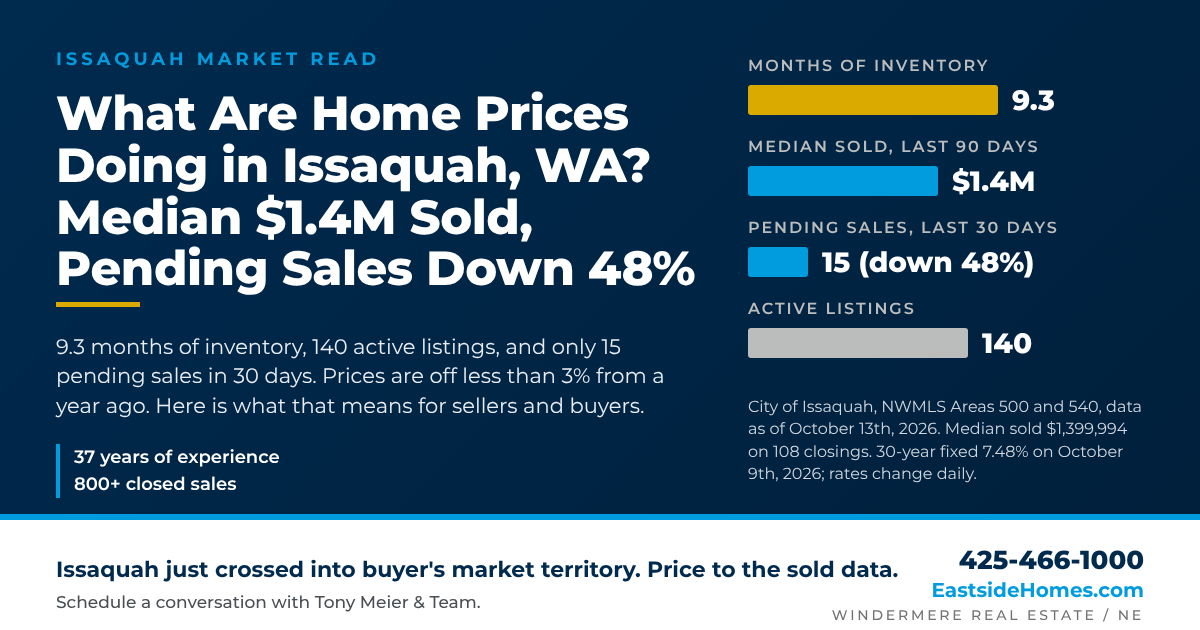
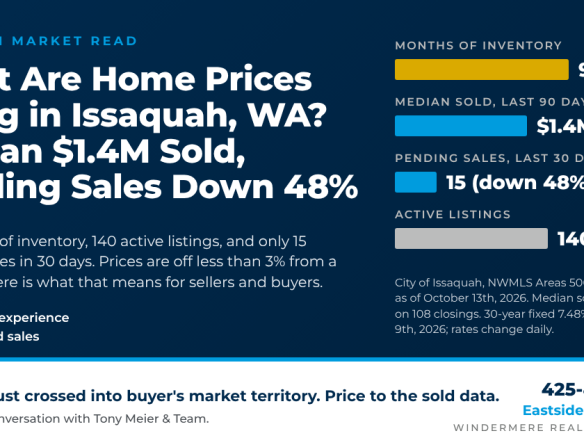
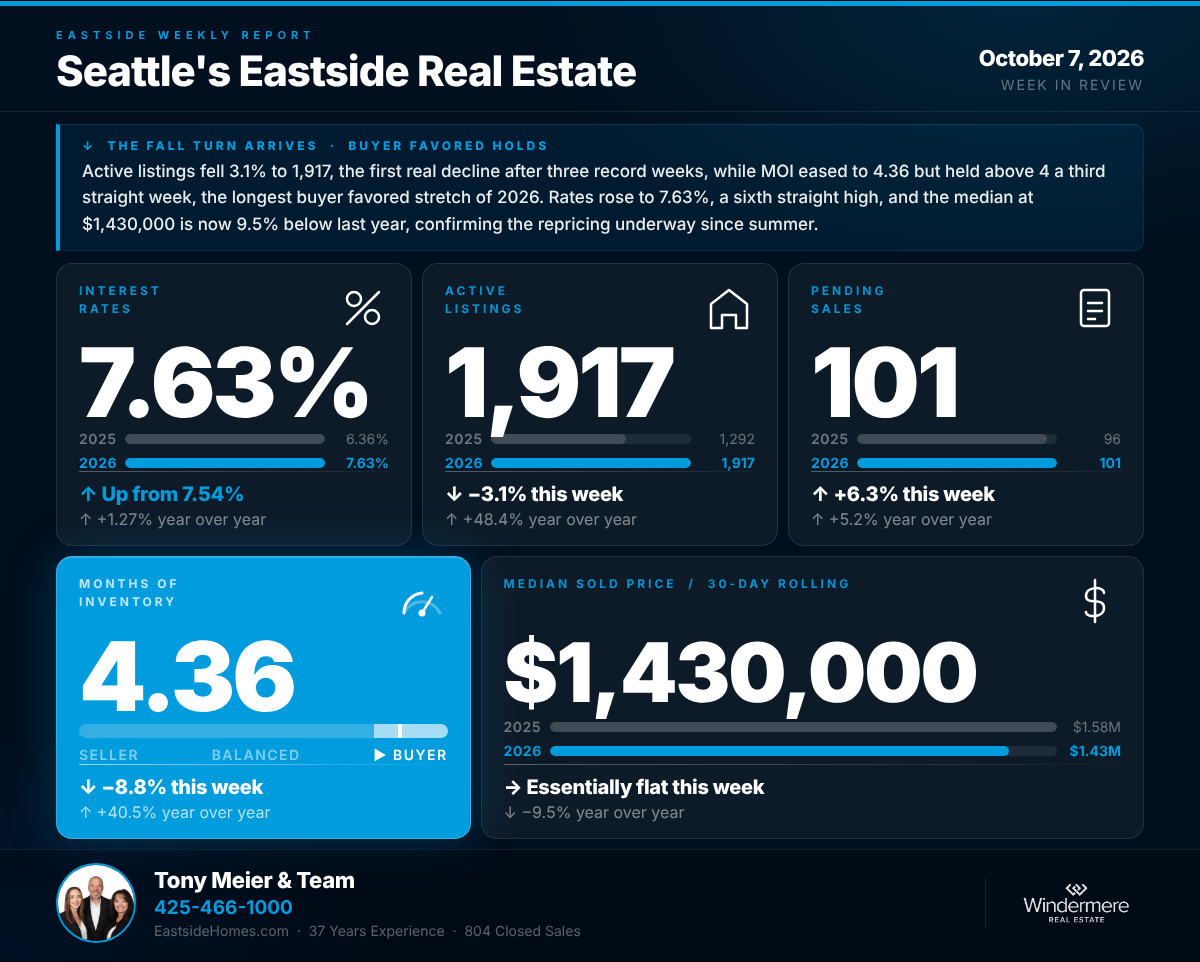
Issaquah home prices are holding close to last year's level, but the pace of sales just dropped sharply. The median sold price across the 108 Issaquah closings in the 90 days ending October 13th, 2026 was $1,399,994, down 2.8% from the same window a year ago. The bigger story is activity: only 15 Issaquah homes went pending in the last 30 days, down 48% from 29 a month earlier and half the 30 recorded a year ago. Against 140 active listings, that is 9.3 months of inventory (MOI), the slowest pace of any major Eastside city right now. The numbers below come from Eastside Market Watch, Tony Meier & Team's daily database of every NWMLS listing on the Eastside. Issaquah homes fall almost entirely in NWMLS Area 500 (South of I-90) and Area 540 (East of Lake Sammamish).
Issaquah Home Prices: Now vs One Month Ago vs One Year Ago
Thirty-day medians in a city this size swing with the mix of homes that happen to close, so we lead with the 90-day figures. The 30-day median of $1,250,000 (31 closings) sits below the 90-day median because of what closed, not because values fell 10% in a month.
| Issaquah |
Now (Oct 13th) |
1 month ago |
1 year ago |
| Median sold price, trailing 90 days |
$1,399,994 (108 sales) |
$1,415,000 |
$1,440,000 |
| Median sold price, trailing 30 days |
$1,250,000 (31 sales) |
$1,425,000 |
$1,187,500 |
| Median active list price |
$1,395,000 |
$1,356,500 |
$1,430,000 |
| Active listings |
140 |
136 |
about 92 |
| 30-year fixed rate (MND) |
7.48% (Oct 9th) |
7.12% |
6.26% |
Sold prices are off less than 3% year over year, a much smaller move than the headlines suggest. And the median asking price ($1,395,000) now sits almost exactly on the 90-day median sold price ($1,399,994): sellers still on the market have largely repriced to where buyers are actually closing.
Why Pending Sales Matter More Than Price Right Now
Price is a lagging number; pendings lead. In Issaquah they have stepped down three periods in a row: 42 pendings in the 30 days ending August 14th, 29 in the 30 days ending September 13th, and 15 in the 30 days ending October 13th. Our momentum read is Slowing. The 30-year fixed rate rising from 7.12% to 7.48% over the same month is the likely cause; on a $1.1 million loan that is about $270 more per month.
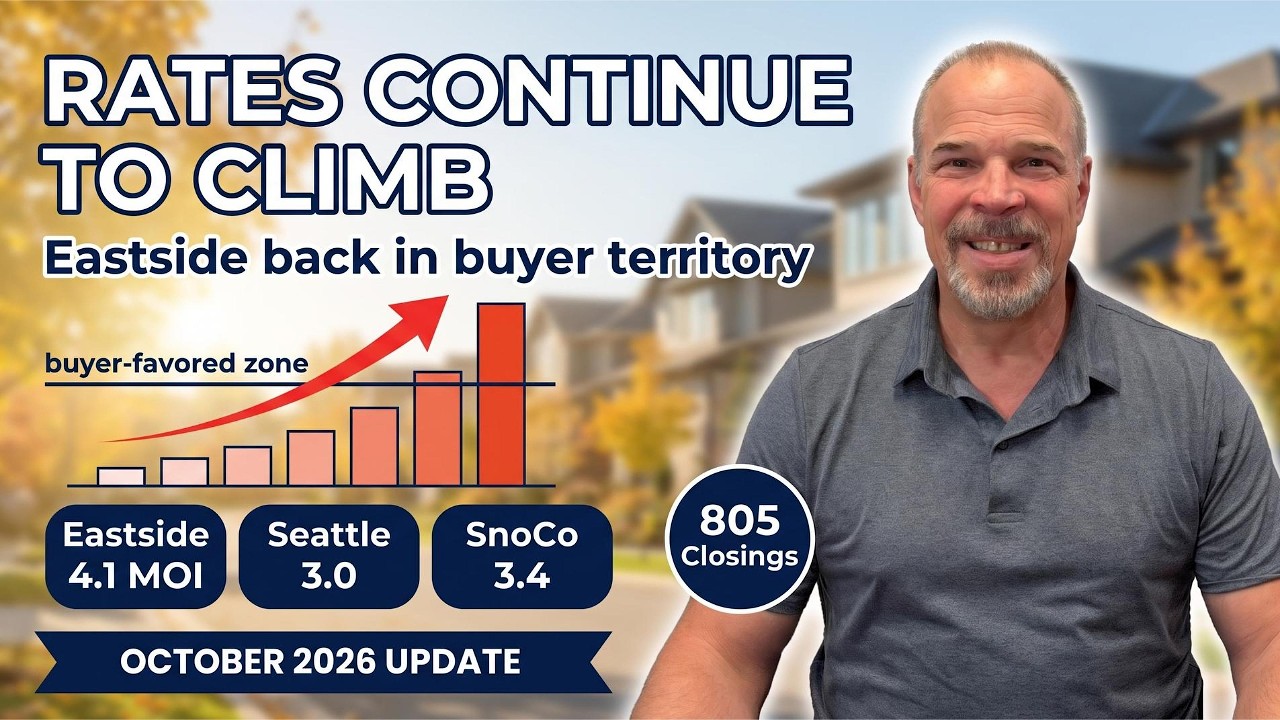
At 15 pendings against 140 active listings, Issaquah carries 9.3 months of inventory. A month ago it was 4.7; a year ago, 3.1. Anything above 4 months is a buyer's market by our definition, and Issaquah is now well past that line.
How Issaquah Is Repricing
| Measure |
Now |
vs 1 month ago |
vs 1 year ago |
| Active listings |
140 |
+2.9% |
about +52% |
| Price reductions on active listings, last 30 days |
35 |
38 (down 3) |
not tracked |
| Median list price |
$1,395,000 |
+2.8% |
-2.4% |
| List price per square foot |
$559 |
-0.2% |
-2.4% |
| Median Cumulative Days Active (CDA), 90-day closings |
18.5 days |
18 days |
15 days |
One in four active Issaquah listings took a price cut in the last 30 days (35 of 140). Active list prices are as of the latest Eastside Market Watch feed and are provisional until re-verified against the live MLS.
What Sellers Are Actually Getting
The homes that did close over the last 90 days did reasonably well: a median sale-to-list ratio of 98.7%, 17.6% sold above list, and a median Cumulative Days Active (CDA) of 18.5 days. That is the split market in one sentence. A well-priced Issaquah home still sells in under three weeks at close to asking, while the rest of the inventory sits and reprices. The difference is almost always the launch price.
Here's What I Suggest
If you are selling in Issaquah: price to the 90-day sold evidence, not to the spring. With 140 homes competing for 15 buyers a month, the first two weeks decide the outcome, and a reduction after that costs more than pricing right from the start. Launch midweek, hold one concentrated open house, and have your pre-inspection done before you go live.
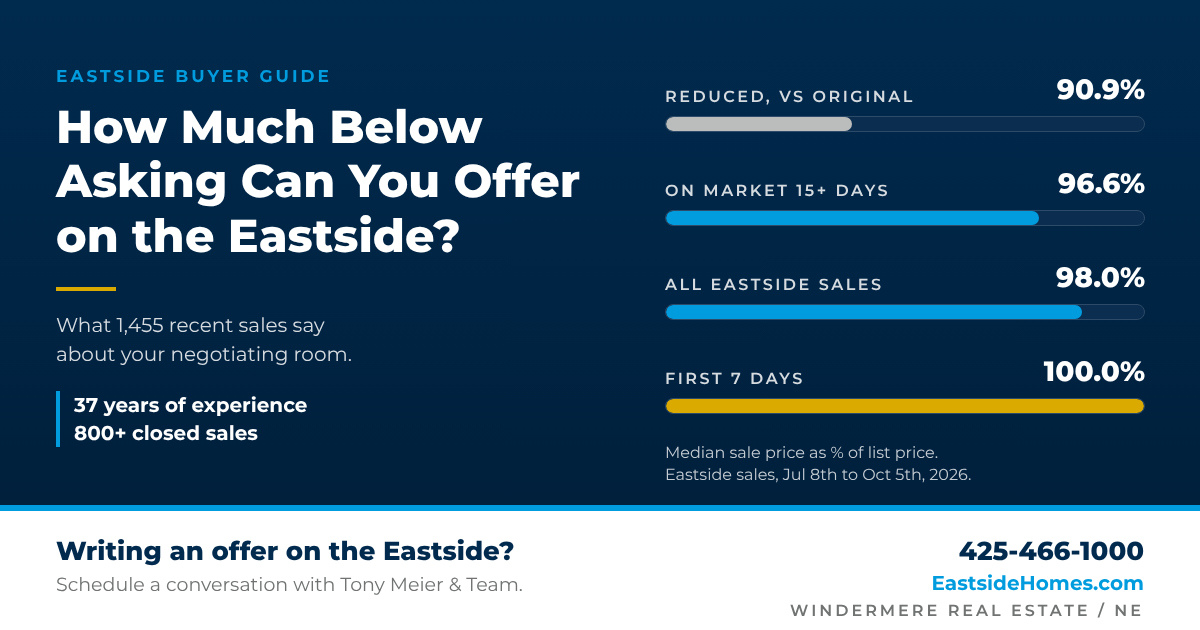
If you are buying in Issaquah: 9.3 months of inventory is leverage you did not have a year ago. Homes past 30 days on market are the ones to target for inspection contingencies, closing cost credits, and offers below asking; our post on
how much below asking Eastside buyers are actually paying has the numbers. If rates ease even half a point, the buyer pool refills quickly.
For the wider picture, see our
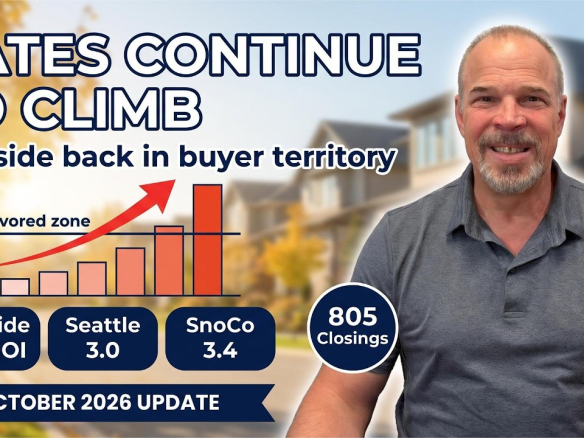
October 2026 Eastside, Seattle and Snohomish update and last week's look at
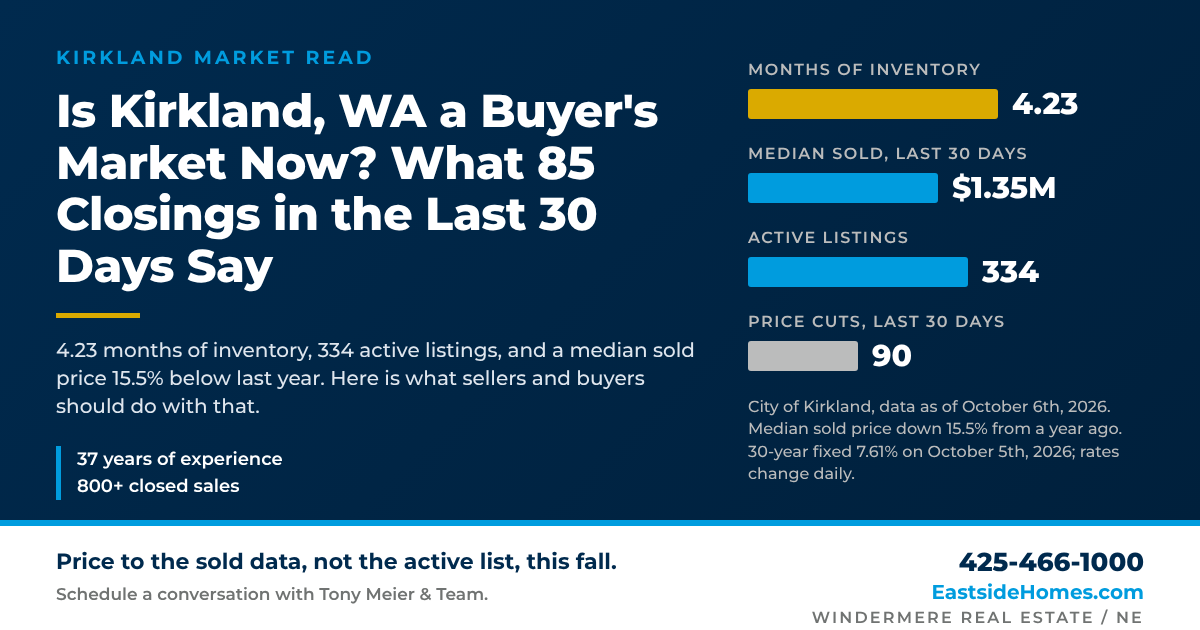
whether Kirkland is a buyer's market.
Want to know what these numbers mean for your home or your search? Call or text Tony Meier & Team at
425-466-1000 or visit
EastsideHomes.com. We bring 37 years of experience and 803 closed residential sales to every conversation, including $254M+ in closed volume across 203 transactions since 2020, 219 closed sales serving the English Hill Area, and a home on English Hill since 2001.
Frequently Asked Questions
What is the median home price in Issaquah, WA right now?
$1,399,994 across the 108 homes that closed in the 90 days ending October 13th, 2026. The 30-day median was $1,250,000 on 31 closings, a smaller sample that moves with the mix of homes sold.
Are home prices dropping in Issaquah?
Slightly. The 90-day median sold price is down 2.8% from a year ago and 1.1% from a month ago. The larger change is in how many homes are selling, not what they sell for.
Is Issaquah a buyer's market?
Yes, by inventory. 9.3 months is above the 4-month line we use for a buyer's market, and the momentum read is Slowing. Well-priced homes still sell quickly.
How long does it take to sell a house in Issaquah?
Homes that closed in the last 90 days had a median of 18.5 Cumulative Days Active (CDA) before going pending, up from 15 a year ago. Overpriced launches take far longer, and 35 active listings cut their price in the last 30 days.
Data as of October 13th, 2026, from Eastside Market Watch (Tony Meier & Team) for NWMLS Area 500 (South of I-90) and Area 540 (East of Lake Sammamish), city of Issaquah. One-year active counts are reconstructed and approximate. Active list prices are as of the latest feed and are provisional until re-verified against the live MLS; sold figures are final. Mortgage rate from Mortgage News Daily, 30-year fixed, October 9th, 2026; rates change daily. Source: NWMLS listing data, compiled and analyzed by Tony Meier & Team through Eastside Market Watch. Statistics not compiled or published by Northwest Multiple Listing Service.
Tony Meier & Team | Windermere Real Estate / NE | Kirkland, WA | 425-466-1000 |
EastsideHomes.com