
Published on:
Active listings increased 24.5% in September, while pending sales declined 15.1% and the median sales price remained nearly unchanged.
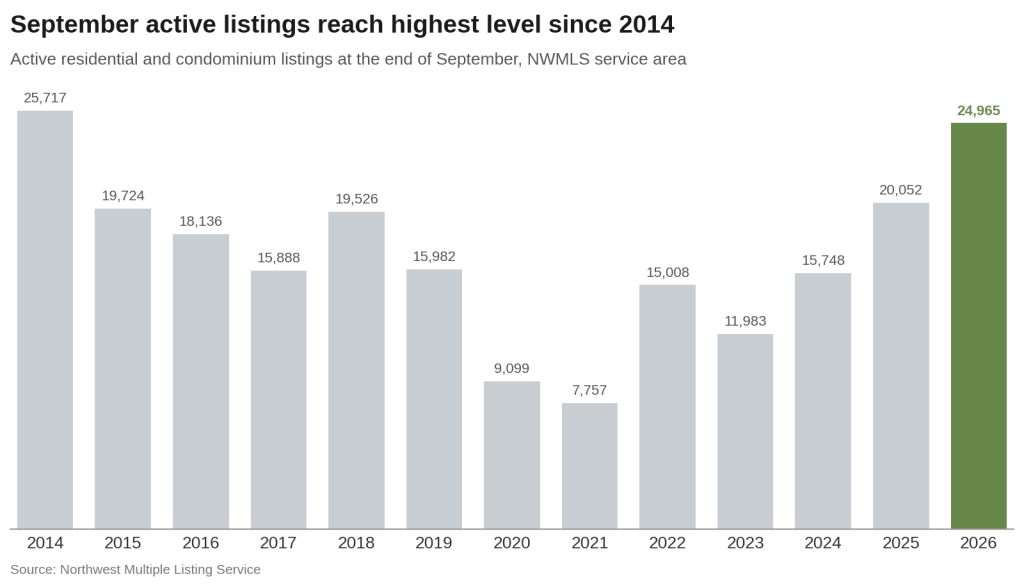
Homebuyers across the Northwest Multiple Listing Service (NWMLS) service area had more homes to choose from in September than at any point since September 2014. Active listings increased 24.5% from a year earlier to 24,965, giving buyers a wider selection of properties and more opportunities to find a home that fits their needs and preferences. Pending sales declined 15.1% to 6,231, while the median sales price was nearly unchanged at $625,000, down 0.9%.
Closed sales fell 8.9% to 5,623, also the lowest for any September since at least 2014, and months of inventory reached 4.44, the highest level since February 2014. September’s drop in pending sales was the sharpest year-over-year decline of 2026, and the NWMLS median price has been flat or below its year-earlier level every month this year.
Pending sales have declined year over year in seven of the first nine months of 2026, and September’s decline was more than double August’s 6.5% drop. For every 100 new listings added in September, buyers went under contract on about 62 homes, down from about 80 a year earlier.
Mortgage rates rose through the month. The average 30-year fixed rate climbed from 6.71% on September 3 to 7.03% on September 24, according to Freddie Mac. In the first week of October, it rose further to 7.28%.
“Recent months have demonstrated what economists call ‘downward stickiness’ in home prices,” said Steven Bourassa, director of the Washington Center for Real Estate Research. “Prices tend to rise quickly in a strong market but can be slower to fall when conditions weaken, in part because sellers may have the flexibility to wait rather than accept a lower price. Meanwhile, inventory continues to grow and sales have slowed, while higher mortgage rates are adding to affordability challenges for buyers. As a result, months of inventory has risen from 2.8 in March to 4.4 in September.”
Condo Market Sees Steeper Slowdown
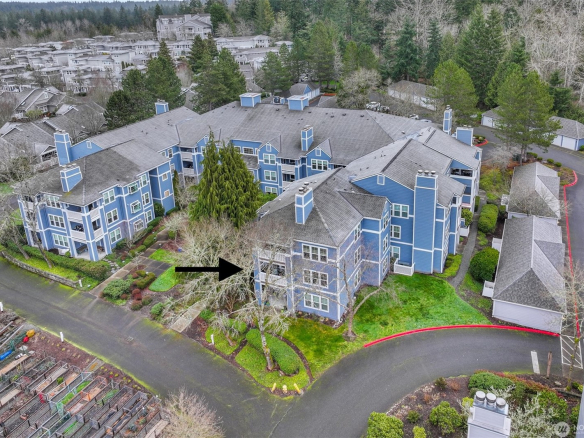
The slowdown was sharpest in the condo market. Condo pending sales fell 22.7% and closed sales fell 19.1%, compared with declines of 13.9% and 7.3% for single-family homes. The median condo price dropped 4.7% to $455,000, while the single-family median slipped 1.1% to $643,000. Condos had 6.29 months of inventory, compared with 4.20 for single-family homes.
In King County, home to 60% of the region’s active condo listings, condos had 7.05 months of inventory, closed sales fell 24.1%, and the median price dropped 6.0% to $496,000.
Puget Sound’s Core Drives the Inventory Build-Up
King, Snohomish and Pierce counties held 57% of all active listings in the NWMLS service area. Inventory in the three counties rose 31.2% to 14,294, compared with a 16.5% increase across the rest of the service area, while pending sales fell 16.4%. Months of inventory rose to 4.27 from 2.91 a year earlier.
Snohomish County posted the largest inventory increase of the three, up 44.2%, though at 3.85 months of inventory it remained tighter than King County (4.70). Pierce was the only one of the three to post a median price gain, up 2.7% to $575,000, while King’s median was unchanged at $850,000.
Kitsap County had the tightest supply in the service area, with 2.58 months of inventory, followed by Clallam County at 3.21. But new contracts are slowing in Kitsap too, where pending sales fell 19.2% from a year earlier.
Conditions were softest east of the Cascades, where the nine NWMLS counties combined had 7.21 months of inventory and closed sales fell 14.2%.
Showing Activity
NWMLS also tracks how often listings are shown. Brokers scheduled 104,936 showings through NWMLS-provided showing software in September, down 12.9% from a year earlier, while active listings increased 24.5%. On average, each listing that was shown in September received 4.2 showings, down from 5.2 a year earlier.
Keyboxes at listed properties were opened 150,847 times in September, down 6.5% from a year earlier. Each opening reflects broker access to a listed property, not necessarily a buyer tour.
Down Payment Assistance
Of all listings in the NWMLS database, 74.7% qualified for at least one down payment assistance program in September, up from 72.9% a year earlier.* Homebuyers searching on NWMLS.com can spot eligible listings by the “Down Payment Help” label next to the listing price.
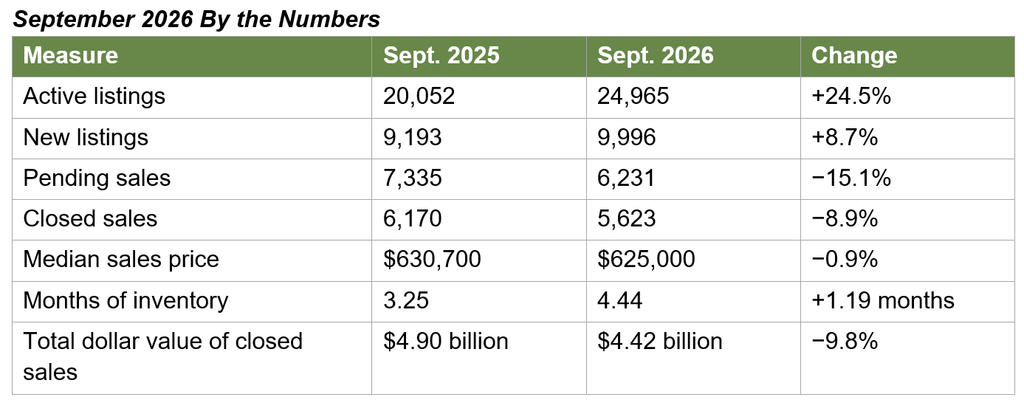
About the data: Figures cover residential and condominium listings in the NWMLS service area unless noted. Months of inventory is month-end active listings divided by closed sales for the month.
*Down payment assistance figures include all property types in the NWMLS database, including multifamily properties and manufactured homes in parks.