Record Inventory Meets 7% Rates: The Fall Market Changes Shape | Seattle’s Eastside Real Estate Update 09-16-26
Record Inventory Meets 7% Rates: The Fall Market Changes Shape | Seattle’s Eastside Real Estate Update 09-16-26
Tony Meier & Team. 37 years. 800 closed sales. $250M+ in closed volume since 2020.
5 Min. ReadAudio Version
Tony Meier | Windermere Real Estate | 37 Years Experience | 800 Closed Eastside Sales
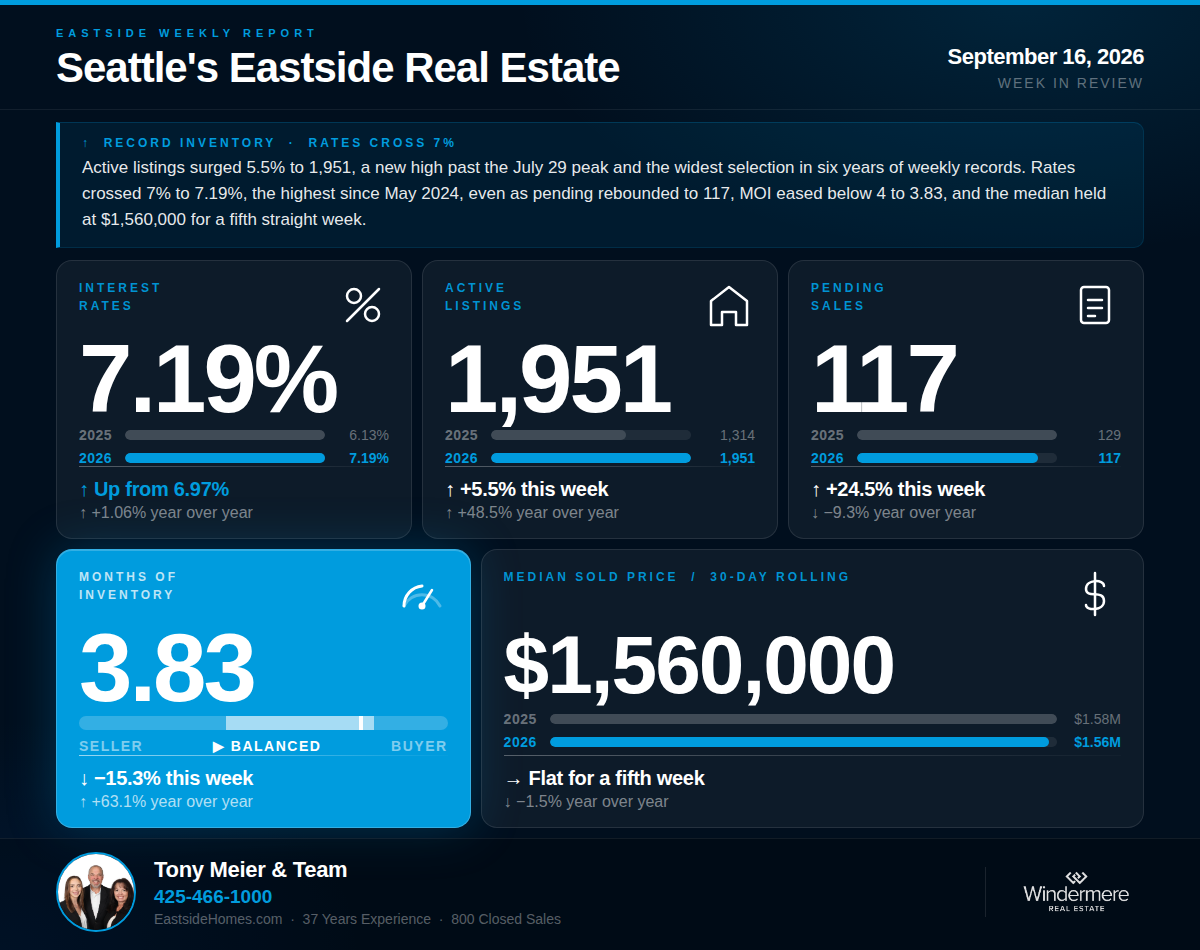
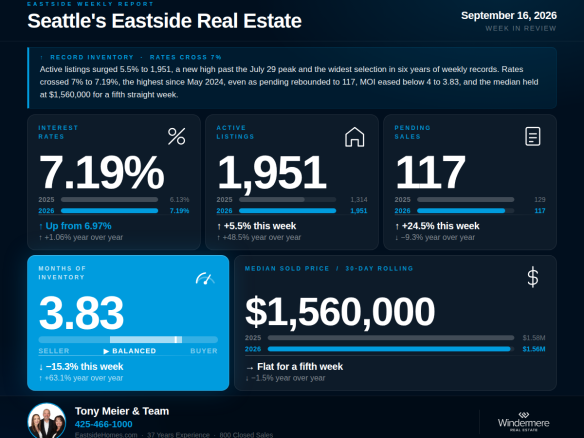
This week rewrites two numbers we thought were settled. Active listings surged 5.5% to 1,951, blowing past the July 29 peak of 1,923 and setting a new high for the year seven weeks after the seasonal script said the top was in. And rates crossed the 7% line for the first time since May 2025, landing at 7.19%, up 1.06% from a year ago and the highest reading since May 2024. The post-Labor Day listing wave arrived far bigger than usual, and it arrived into the most expensive financing in twenty-eight months. Pending rebounded to 117 on the post-holiday script, MOI settled back below 4 at 3.83, and the median held at $1,560,000 for a fifth consecutive week. Selection has never been wider in the six years we have tracked this weekly. Paying for it has rarely cost more.
💰 Interest Rates — 7.19%
↑ Up 22 bp from last week's 6.97% | ↑ Up 1.06% year over year
Rates surged to 7.19% this week, up 22 basis points from last week and through the 7% threshold for the first time since May 2025. The longer view is more striking: this is the highest weekly reading since May 2024, twenty-eight months ago, and rates now sit 1.06% above the comparable week in 2025. The three-week climb totals 44 basis points, the steepest of 2026, exceeding even the conflict-driven surge in March. The pre-conflict baseline of 5.99% is now 1.20 points below current rates. On a $1.5M home, this week's rate represents roughly $1,200 more per month in carrying costs than buyers faced in late February. Every affordability calculation on the Eastside just got rewritten.
🏡 Active Listings — 1,951
↑ Up 5.5% from last week | ↑ Up 48.5% year over year
Active listings jumped to 1,951 this week, up 5.5% from last week, the largest weekly increase of the year, and a new 2026 high that surpasses the July 29 peak we believed had closed the books on this year's inventory build. The driver is the post-Labor Day listing wave, and this year's version is enormous. Some September strength is normal: the fall wave also produced the annual highs of 2023 and 2024 in our weekly tracking. What is not normal is the level. At 1,951, this is the highest weekly active count in the six years of our weekly series, and in the twenty years of NWMLS monthly data, no September has carried more than 1,900 active listings since 2011. Year over year, inventory sits 48.5% above the 1,314 recorded during the comparable week in 2025.
📝 Pending Sales — 117
↑ Up 24.5% from last week | ↓ Down 9.3% year over year
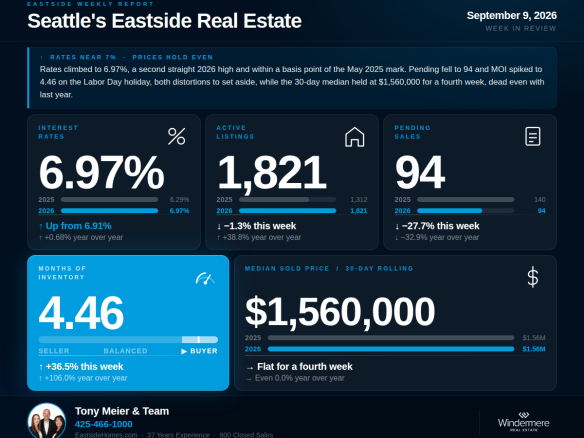
Pending sales rebounded to 117 this week, up 24.5% from the holiday-suppressed 94, following the recovery script that Memorial Day and July 4 both wrote earlier this year. Against last year, pending sits 9.3% below the 129 recorded during the comparable week in 2025, right in line with the 10 to 15 percent gap that has defined demand since June. The trailing five-week average is 114. The cleaner question is what happens over the next three weeks, because the 44-basis-point rate surge is exactly the kind of move that cooled demand with a lag in July, and that spike was a third this size.
📦 Months of Inventory — 3.83
↓ Down 15.3% from last week's 4.53 | ↑ Up 63.1% year over year
MOI settled at 3.83 this week, down 15.3% from last week's holiday-inflated reading, returning below the buyer-favored threshold exactly as the post-holiday pattern predicted. The trailing five-week average is 3.86, upper balanced territory. The composition shifted this week, though: MOI eased because pending rebounded, but the inventory surge means the ratio is now carrying nearly 2,000 homes in the numerator. If the rate spike slows demand while the fall listing wave keeps building, the next test of the buyer-favored line will come from both directions at once.
🏠 Median Sold Price (Rolling 30-Day) — $1,560,000
→ Flat for a fifth week | ↓ Down 1.5% year over year
The 30-day median held at $1,560,000 for a fifth consecutive week, now 1.5% below the $1,583,500 recorded at this same point in 2025. Five identical weekly readings through a holiday, a record inventory surge, and a 44-basis-point rate climb is price stability of a remarkable kind. The mid-August caveat stands: per-square-foot values run softer than the headline. Closed sales came in at 97, down 8.5% from the 106 recorded during the comparable week in 2025.
🔍 The Big Picture — What This All Means
The fall market just changed shape in one week. Sellers who were waiting for September delivered the largest listing wave in the weekly record, and buyers now face the widest selection ever in that record alongside the most expensive financing since May 2024. Something has to give. Either the demand that held firm through August absorbs 7.19% rates and record selection, or the July lag pattern repeats and pending softens into October just as inventory peaks for a second time. The five-week price plateau says the market has not yet picked a direction. The next three weeks of data will. One process note: last week's active listing count was revised upward in this week's file, from 1,821 to 1,850, which means inventory never actually declined as sharply as first reported.
🏠 For Sellers
Sellers, this week is a genuine turn, and candor matters: your competition just hit the highest level in our records, and the fall wave may not be done. The six-week decline in inventory that was working in your favor reversed in a single week. At the same time, buyers are absorbing 7.19% financing, which trims what every one of them can pay. This is now unambiguously a market that punishes aspirational pricing. The sellers who win this fall will be the ones priced to current per-square-foot comparables from day one, presented impeccably, and positioned to capture the serious buyers who remain active before the holiday slowdown. If your plans allow flexibility on timing, the depth of this listing wave is a real factor in the list-now-or-wait conversation.
We have done extensive analysis on what this shift means for sellers in each Eastside sub-market and would welcome the opportunity to walk you through what the data shows for your specific area and home.
🔑 For Buyers
Buyers, the selection you have been waiting for just arrived, and the bill came with it. At 1,951 active listings, choice is the widest in our six years of weekly records, and sellers know they are competing. But 7.19% financing changes what that leverage is worth: on a typical Eastside purchase, carrying costs are up roughly $1,200 a month from late February. The play this fall is precision. Stress-test your qualification at current rates today, price the buydown options with your lender because the spread between headline and structured rates is worth real money at these levels, and then use the record selection to negotiate hard on the right home. Prices have not moved in five weeks. Selection has never been better. The financing is the obstacle, and the buyers who solve it hold more leverage than anyone in this market.
If we can help you think through what this means for your move, we are here.
Tony Meier & Team — Windermere Real Estate / NE, Kirkland, WA
Thinking about a move on the Eastside?
Tony Meier & Team has closed 800 residential transactions with $250M+ in volume since 2020. Whether you are six months out or just curious about your home’s value, we would be glad to help you think it through.
Active listings surged to 1,951, a new 2026 high seven weeks after the July peak and the highest weekly count in six years of tracking, while rates crossed 7% for the first time since May 2025, landing at 7.19%, up 1.06% year over year. Record selection meets the most expensive financing in 28 months.
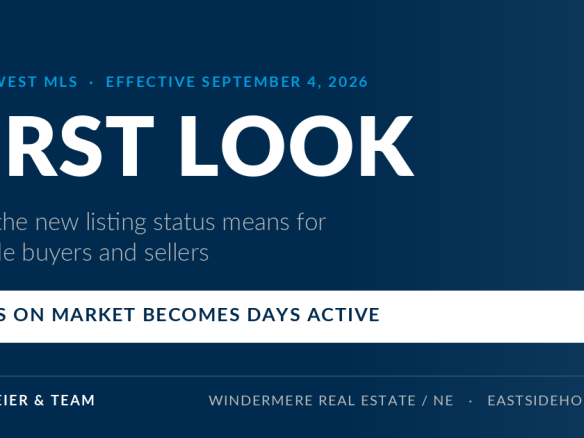
Northwest MLS launches First Look September 4, 2026. How the new 21-day listing status works, what changed about days on market, and what it means for you.
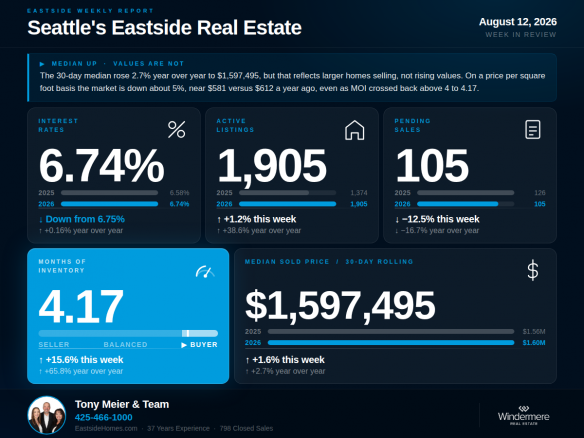
The 30-day median is up 2.7% year over year, but price per square foot is down about 5%. Larger homes are selling, masking a like-for-like value decline. Pending fell to 105, MOI crossed above 4 for the fifth time this year, and the inventory peak question remains open.
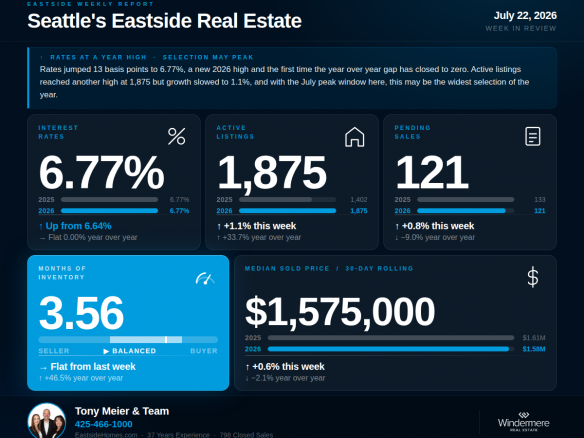
Rates jumped to 6.77%, a new 2026 high and the highest in nearly a year — the last time they were higher was July 28, 2025. The buyer's year-over-year rate advantage has closed to zero. Meanwhile inventory growth slowed sharply as the July peak window arrives, meaning selection may be peaking too.
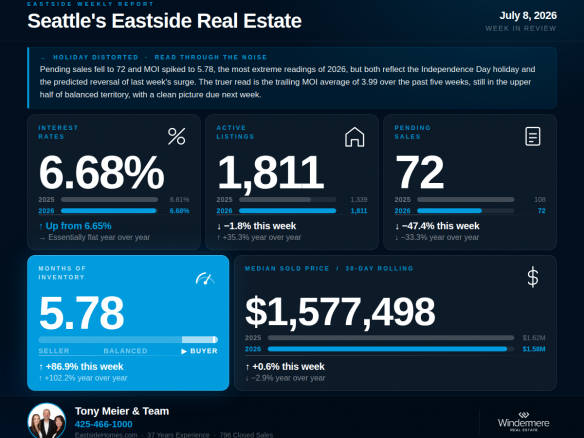
This week's headline numbers are the most extreme readings of 2026, but they arrive with the Independence Day holiday firmly stamped on them. Pending fell to 72, MOI jumped to 5.78, and active listings declined for the first time all year. A clean read of underlying market conditions will not be available until next week.
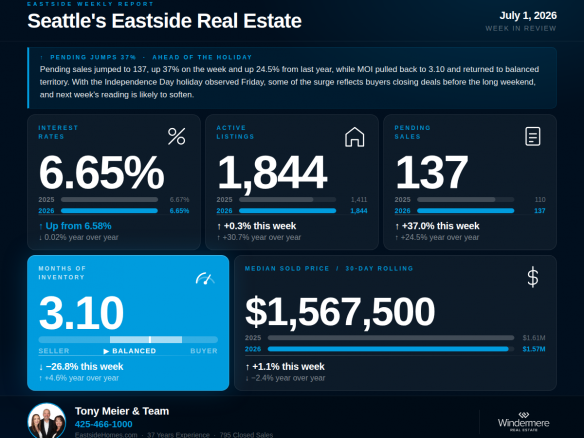
Pending sales jumped 37% this week to 137, MOI pulled back to 3.10 returning to balanced territory, and active listings barely grew for the first time all year. But pre-holiday timing complicates the read, and next week's Independence Day suppression is likely to reverse the pending signal.
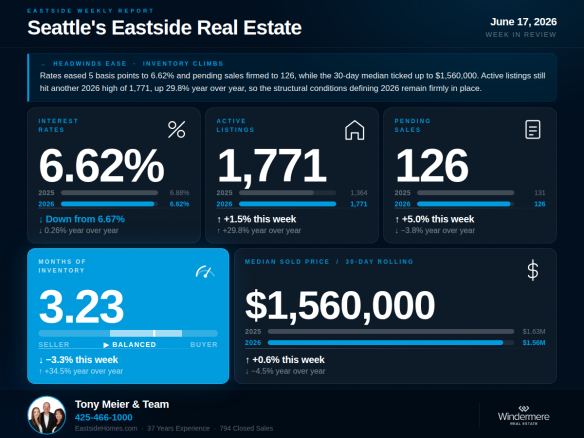
The data this week reads in mixed directions: rates eased to 6.62%, pending sales firmed modestly to 126, and active listings climbed to 1,771 — another 2026 high. Four short-term signals moved in sellers' favor this week, but the structural conditions defining 2026 remain in place.
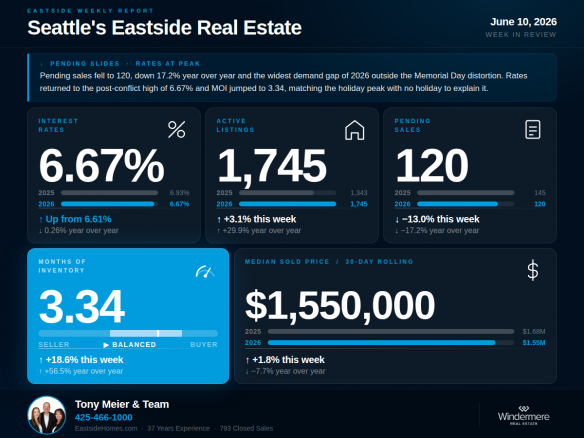
Three signals converged this week: pending sales fell sharply with the YOY gap widening to -17.2%, rates returned to the post-conflict high of 6.67%, and Months of Inventory jumped to 3.34 — the second-highest weekly reading of 2026, this time without holiday distortion to explain it.