5 Min. Read
Audio Version
Tony Meier | Windermere Real Estate | 37 Years Experience | 798 Closed Eastside Sales
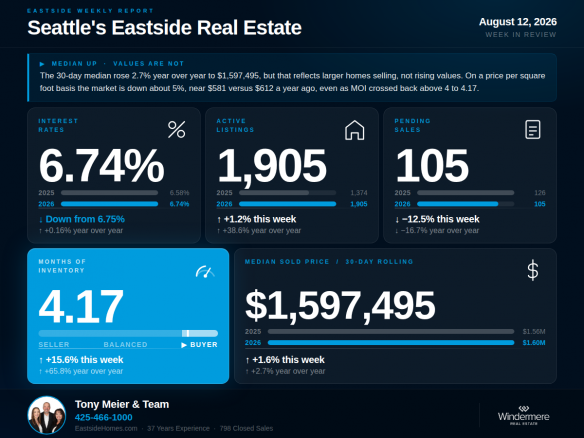
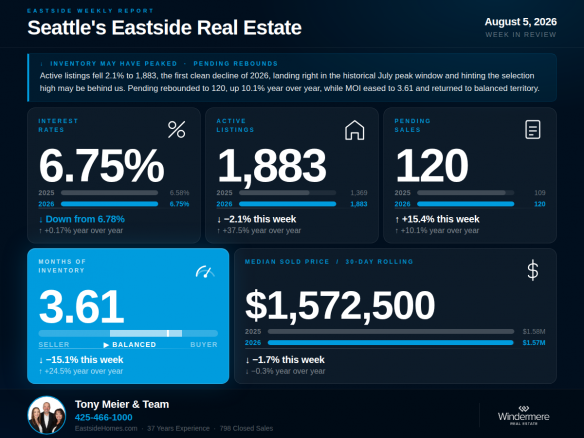
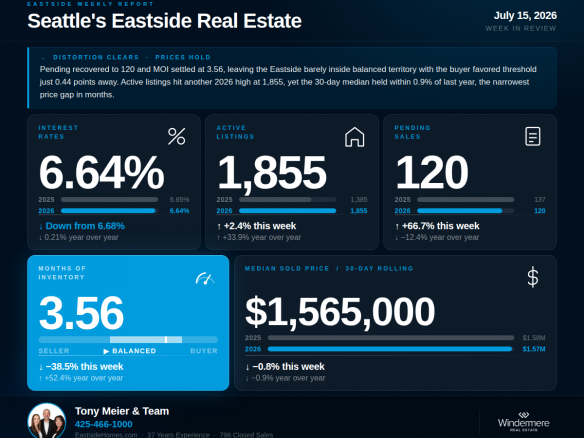
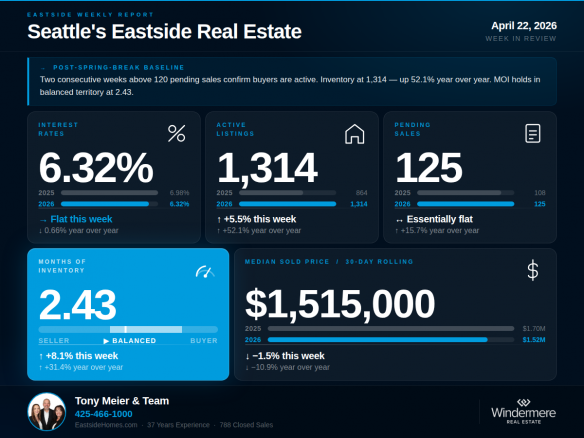
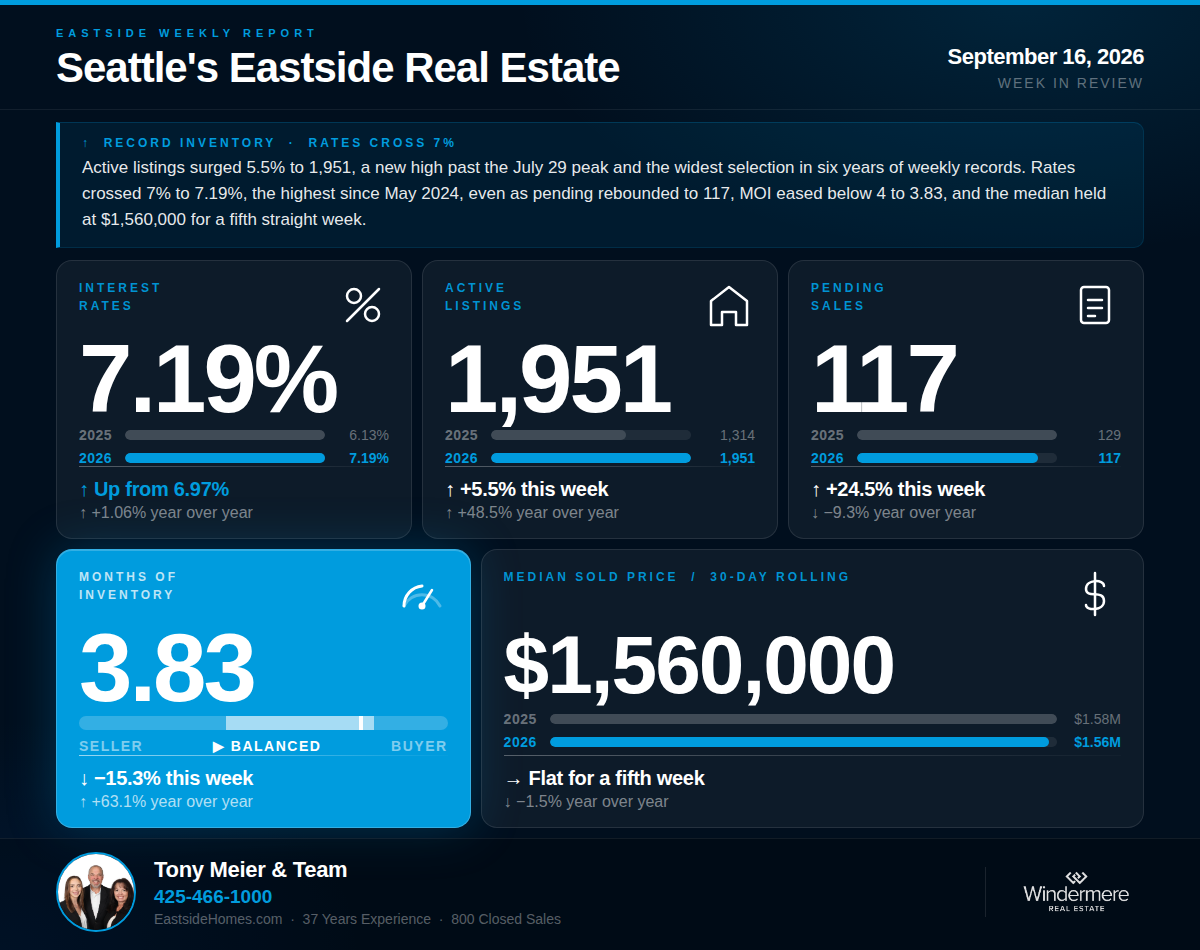
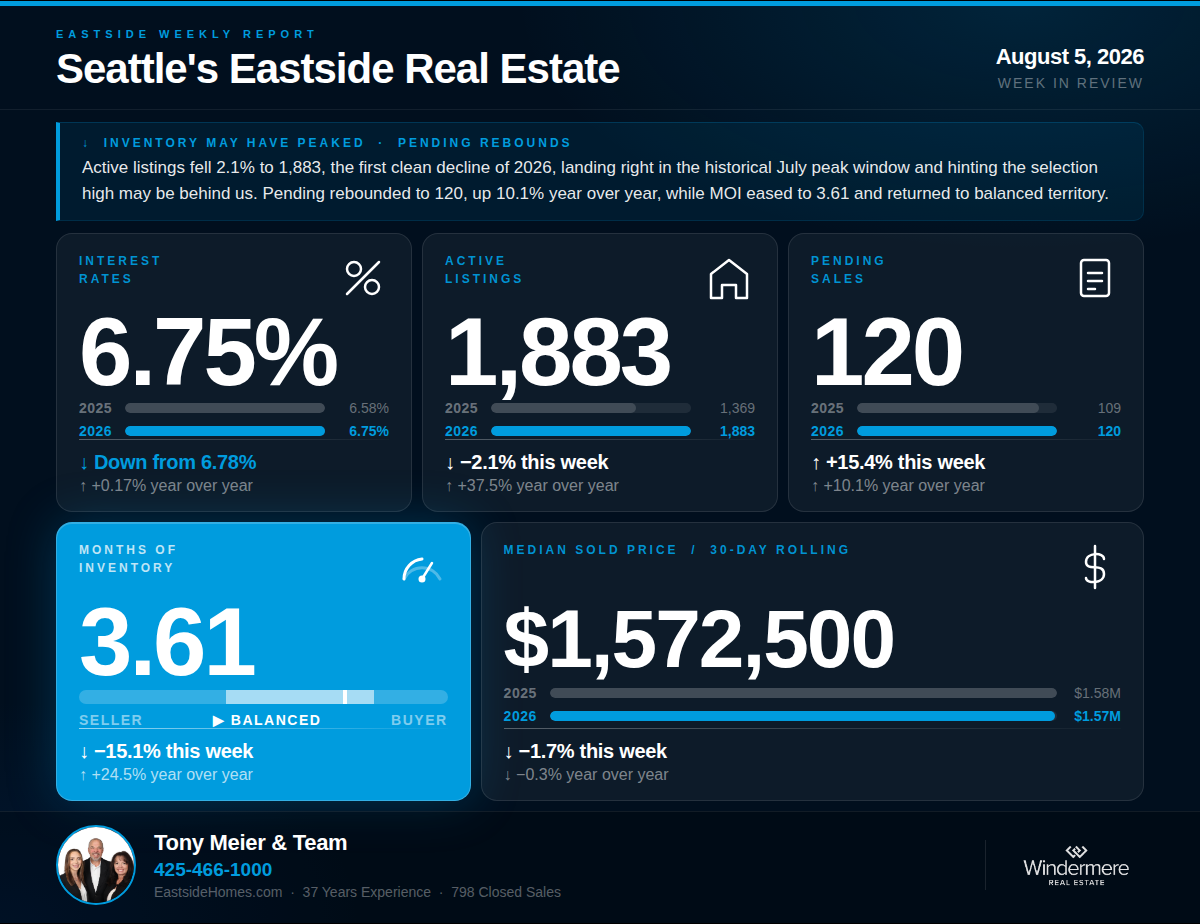
The whiplash continues, and this week it swings back the other way. Pending sales rebounded to 120, up 15.4% from last week and up 10.1% year over year, only the second positive year-over-year pending reading since February. MOI pulled back to 3.61, returning to balanced territory one week after crossing above 4. Rates eased off their 2026 high to 6.75%. And the data point with the longest shadow: active listings fell 2.1% to 1,883, the first clean, non-holiday decline of the year. If that holds, July 29 at 1,923 may have been the 2026 inventory peak, right on schedule with the 20-year historical pattern.
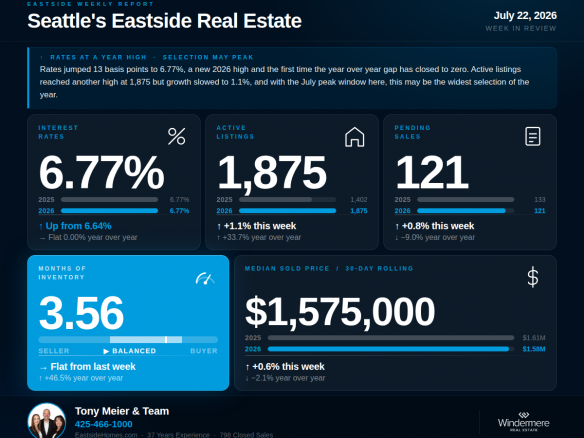
Rates eased to 6.75% this week, down 3 basis points from last week's 2026 high. Rates remain 0.17% above the comparable week in 2025, the second consecutive week of rates above year-ago levels. The pre-conflict baseline of 5.99% sits 0.76 points below where rates are today. On a $1.5M home, this week's rate represents roughly $760 more per month in carrying costs than buyers faced in late February.
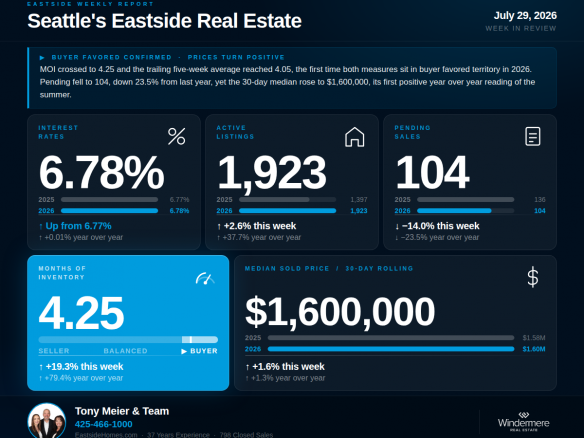
Active listings fell to 1,883 this week, down 2.1% from last week's 1,923. This is the data point with the longest shadow in this update. It is the first non-holiday weekly decline in active listings all year. The only prior decline, in the July 4 week, was calendar-driven. This one is not. Historically, active listings peak in July in 8 of the last 20 years, and last week's 1,923 landed squarely in that window. One week does not confirm a peak, and year over year inventory remains 37.5% above the 1,369 recorded during the comparable week in 2025. But if the pattern holds, selection has just started its seasonal decline, and the widest choice of 2026 is now behind us.
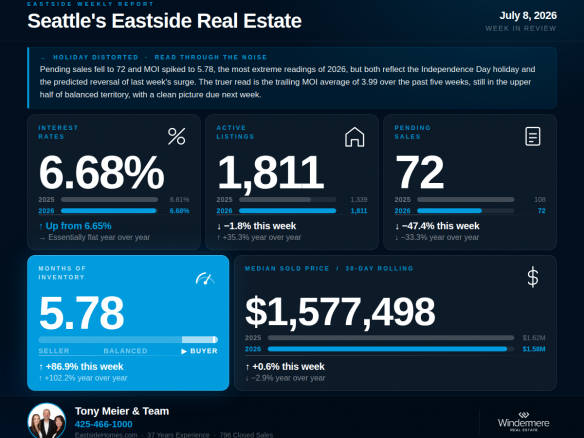
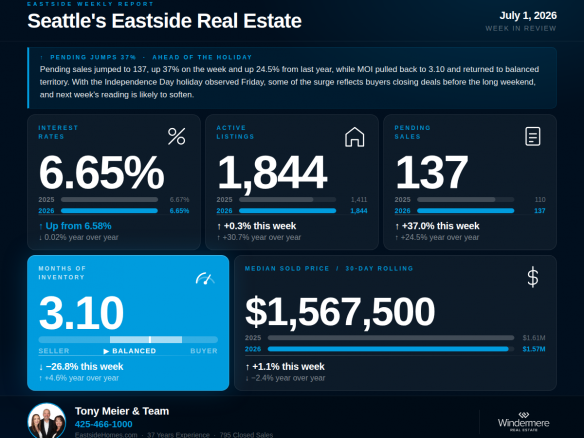
Pending sales rebounded to 120 this week, up 15.4% from last week's 104 and up 10.1% from the 109 recorded during the comparable week in 2025. This is only the second positive year-over-year pending reading since February, and it arrives one week after the steepest clean decline of the summer. The trailing five-week average sits at 107. The week-to-week volatility that has defined this summer continues: 104, 120, and before that 121, 120, 72, 137. Read as a whole, demand is oscillating in a band rather than trending in one direction, and this week's reading lands at the top of that band.
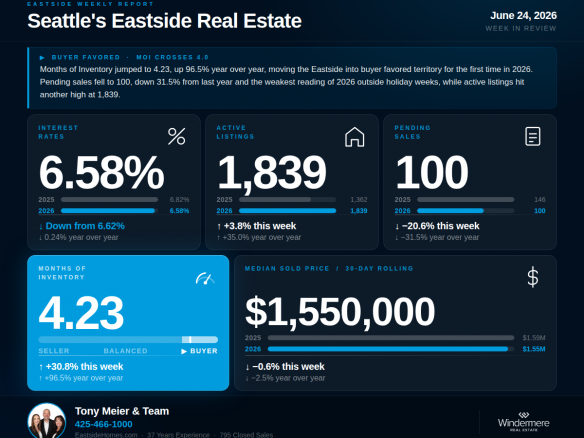
MOI pulled back to 3.61 this week, down 15.1% from last week and 24.5% above the 2.90 recorded during the comparable week in 2025. One week after crossing the buyer-favored threshold, the market is back in balanced territory. A note of honesty about the trailing average we cited last week: the five-week average now reads 4.15, but that figure still carries the holiday-distorted 5.78 from the July 4 week. Setting that outlier aside, the four clean weeks since average 3.75, solidly in upper balanced territory. The most accurate description of this market is that it is oscillating around the boundary between balanced and buyer-favored, crossing it in weak demand weeks and pulling back in stronger ones.
The 30-day median came in at $1,572,500, down 1.7% from last week and essentially flat at 0.3% below the $1,577,500 recorded at this same point in 2025. Last week's positive year-over-year reading did not hold, but the near-zero gap continues the story of price resilience. Closed sales came in at 97, down 12.6% year over year from the 111 recorded during the comparable week in 2025.
Two storylines are converging as summer enters its final stretch. The first is the possible inventory peak. The first clean weekly decline in active listings, landing exactly in the historical July peak window, suggests the selection high-water mark of 2026 may now be behind us. The next two weeks will confirm or reject that. The second is the demand oscillation. Pending has now swung between 72 and 137 over six weeks, and this week's 120 with a positive year-over-year comparison shows real buyers are still engaging whenever conditions align. Prices, meanwhile, refuse to break: the median is within a fraction of a percent of last year. Put together, this is a market in late-summer equilibrium: elevated inventory that may have peaked, demand that is choppy but present, rates near their high, and prices holding. The question for August is which of these breaks first.
The possible inventory peak changes the competitive math in your favor for the first time in months. If July 29 proves to be the top, every week from here forward means fewer competing listings, and the historical pattern says that decline continues through winter. Demand remains present, as this week's positive year-over-year pending reading shows, and prices are holding within a fraction of a percent of last year. Pricing discipline still decides who transacts: the buyers who are active are qualified and selective, and they are comparing your home against 37.5% more inventory than last year. But for accurately priced sellers, the environment tilts slightly more favorable each week the inventory decline continues.
We have done extensive analysis on what this shift means for sellers in each Eastside sub-market and would welcome the opportunity to walk you through what the data shows for your specific area and home.
Buyers, this week carries a genuine timing signal: if the July 29 peak holds, the widest selection of 2026 is already behind you, and choices will narrow each week through fall and winter. That does not mean panic, it means the browsing phase should become the deciding phase if you have been waiting for maximum choice. Competition remains light by historical standards, rates eased slightly to 6.75%, and the negotiating environment is still the most favorable for this time of year since 2011. Stress-test your qualification at current rates, and be ready to move on the right property, because the selection window has likely started to close.
If we can help you think through what this means for your move, we are here.
Tony Meier & Team — Windermere Real Estate / NE, Kirkland, WA
Audio Version
Tony Meier | Windermere Real Estate | 37 Years Experience | 798 Closed Eastside Sales
The whiplash continues, and this week it swings back the other way. Pending sales rebounded to 120, up 15.4% from last week and up 10.1% year over year, only the second positive year-over-year pending reading since February. MOI pulled back to 3.61, returning to balanced territory one week after crossing above 4. Rates eased off their 2026 high to 6.75%. And the data point with the longest shadow: active listings fell 2.1% to 1,883, the first clean, non-holiday decline of the year. If that holds, July 29 at 1,923 may have been the 2026 inventory peak, right on schedule with the 20-year historical pattern.
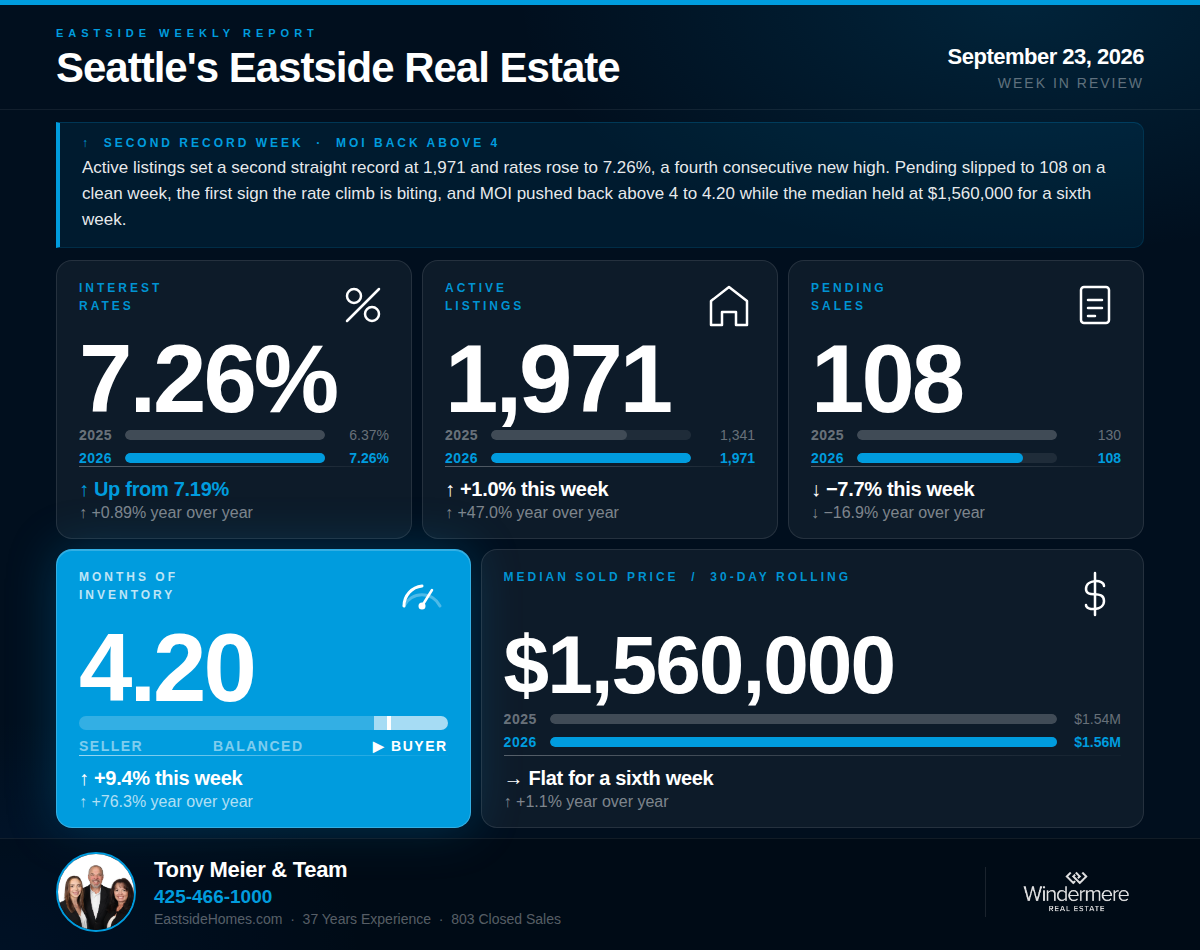
💰 Interest Rates — 6.75% | ↓ Down 3 bp from last week's 6.78% | ↑ Up 0.17% year over year
Rates eased to 6.75% this week, down 3 basis points from last week's 2026 high. Rates remain 0.17% above the comparable week in 2025, the second consecutive week of rates above year-ago levels. The pre-conflict baseline of 5.99% sits 0.76 points below where rates are today. On a $1.5M home, this week's rate represents roughly $760 more per month in carrying costs than buyers faced in late February.
🏡 Active Listings — 1,883 | ↓ Down 2.1% from last week | ↑ Up 37.5% year over year
Active listings fell to 1,883 this week, down 2.1% from last week's 1,923. This is the data point with the longest shadow in this update. It is the first non-holiday weekly decline in active listings all year. The only prior decline, in the July 4 week, was calendar-driven. This one is not. Historically, active listings peak in July in 8 of the last 20 years, and last week's 1,923 landed squarely in that window. One week does not confirm a peak, and year over year inventory remains 37.5% above the 1,369 recorded during the comparable week in 2025. But if the pattern holds, selection has just started its seasonal decline, and the widest choice of 2026 is now behind us.
📝 Pending Sales — 120 | ↑ Up 15.4% from last week | ↑ Up 10.1% year over year
Pending sales rebounded to 120 this week, up 15.4% from last week's 104 and up 10.1% from the 109 recorded during the comparable week in 2025. This is only the second positive year-over-year pending reading since February, and it arrives one week after the steepest clean decline of the summer. The trailing five-week average sits at 107. The week-to-week volatility that has defined this summer continues: 104, 120, and before that 121, 120, 72, 137. Read as a whole, demand is oscillating in a band rather than trending in one direction, and this week's reading lands at the top of that band.
📦 Months of Inventory — 3.61 | ↓ Down 15.1% from last week's 4.25 | ↑ Up 24.5% year over year
MOI pulled back to 3.61 this week, down 15.1% from last week and 24.5% above the 2.90 recorded during the comparable week in 2025. One week after crossing the buyer-favored threshold, the market is back in balanced territory. A note of honesty about the trailing average we cited last week: the five-week average now reads 4.15, but that figure still carries the holiday-distorted 5.78 from the July 4 week. Setting that outlier aside, the four clean weeks since average 3.75, solidly in upper balanced territory. The most accurate description of this market is that it is oscillating around the boundary between balanced and buyer-favored, crossing it in weak demand weeks and pulling back in stronger ones.
🏠 Median Sold Price (Rolling 30-Day) — $1,572,500 | ↓ Down 1.7% from last week | ↓ Down 0.3% year over year
The 30-day median came in at $1,572,500, down 1.7% from last week and essentially flat at 0.3% below the $1,577,500 recorded at this same point in 2025. Last week's positive year-over-year reading did not hold, but the near-zero gap continues the story of price resilience. Closed sales came in at 97, down 12.6% year over year from the 111 recorded during the comparable week in 2025.
🔍 The Big Picture — What This All Means
Two storylines are converging as summer enters its final stretch. The first is the possible inventory peak. The first clean weekly decline in active listings, landing exactly in the historical July peak window, suggests the selection high-water mark of 2026 may now be behind us. The next two weeks will confirm or reject that. The second is the demand oscillation. Pending has now swung between 72 and 137 over six weeks, and this week's 120 with a positive year-over-year comparison shows real buyers are still engaging whenever conditions align. Prices, meanwhile, refuse to break: the median is within a fraction of a percent of last year. Put together, this is a market in late-summer equilibrium: elevated inventory that may have peaked, demand that is choppy but present, rates near their high, and prices holding. The question for August is which of these breaks first.
🏠 For Sellers
The possible inventory peak changes the competitive math in your favor for the first time in months. If July 29 proves to be the top, every week from here forward means fewer competing listings, and the historical pattern says that decline continues through winter. Demand remains present, as this week's positive year-over-year pending reading shows, and prices are holding within a fraction of a percent of last year. Pricing discipline still decides who transacts: the buyers who are active are qualified and selective, and they are comparing your home against 37.5% more inventory than last year. But for accurately priced sellers, the environment tilts slightly more favorable each week the inventory decline continues.
We have done extensive analysis on what this shift means for sellers in each Eastside sub-market and would welcome the opportunity to walk you through what the data shows for your specific area and home.
🔑 For Buyers
Buyers, this week carries a genuine timing signal: if the July 29 peak holds, the widest selection of 2026 is already behind you, and choices will narrow each week through fall and winter. That does not mean panic, it means the browsing phase should become the deciding phase if you have been waiting for maximum choice. Competition remains light by historical standards, rates eased slightly to 6.75%, and the negotiating environment is still the most favorable for this time of year since 2011. Stress-test your qualification at current rates, and be ready to move on the right property, because the selection window has likely started to close.
If we can help you think through what this means for your move, we are here.
Tony Meier & Team — Windermere Real Estate / NE, Kirkland, WA