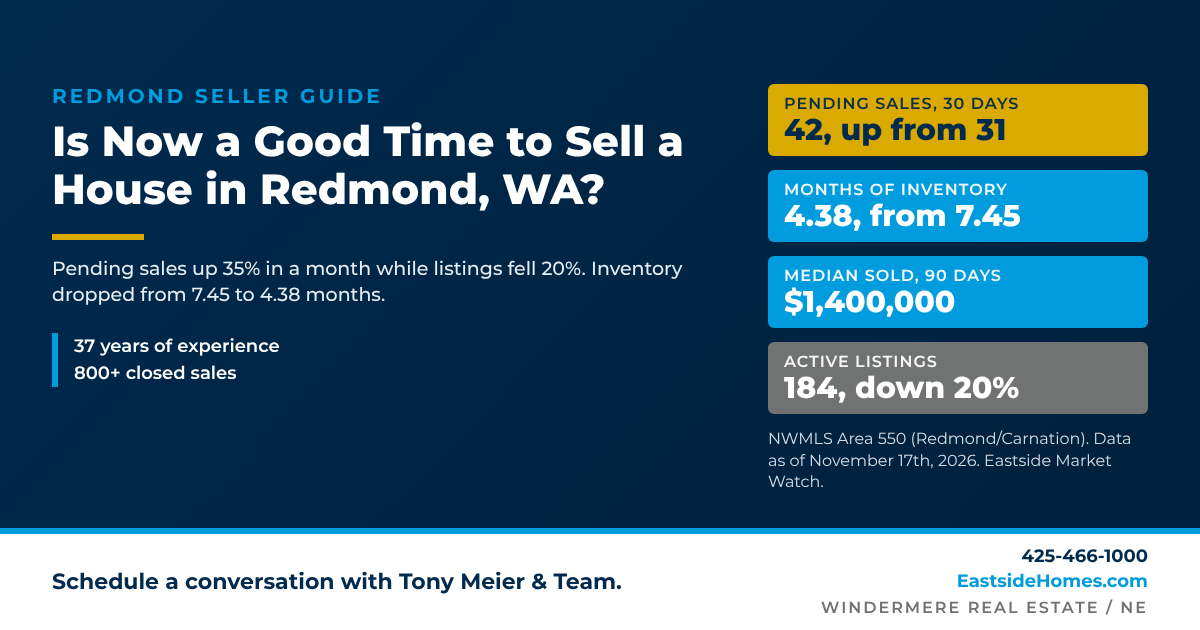
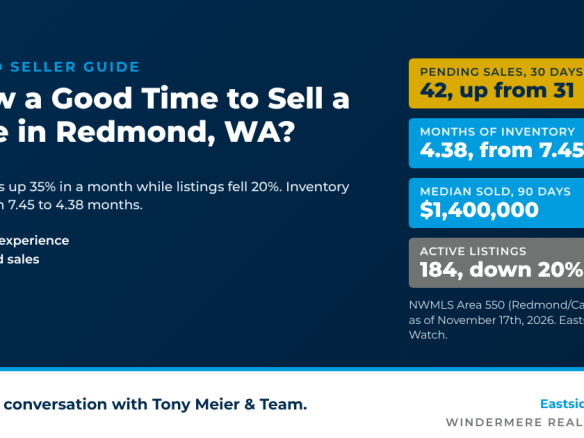
For a well prepared, correctly priced home, yes. As of November 17th, 2026, Redmond buyers put 42 homes under contract in the last 30 days, up 35.5% from 31 a month earlier, while homes for sale fell from 231 to 184. Months of inventory dropped from 7.45 to 4.38 in one month. That is still a Buyer's Market, and a year ago Redmond sat at 1.84 months in a Seller's Market, so sellers do not hold the advantage they had in November 2025. What changed is the direction: Redmond tightened this month while pending sales across the whole Eastside fell 14.6%.
These figures come from Eastside Market Watch, Tony Meier & Team's daily database of every NWMLS listing on the Eastside, for NWMLS Area 550 (Redmond/Carnation).
What Changed in Redmond in the Last 30 Days
Sellers pulled back faster than buyers did. Only 55 new listings came on in the last 30 days, down 47% from 104, while pending sales rose from 31 to 42. Momentum reads Steady (pending slices of 62, 31, and 42), so October's slowdown was recovered rather than extended.
| Redmond, NWMLS Area 550 |
Now (November 17th, 2026) |
1 month ago |
1 year ago |
| Pending sales, last 30 days |
42 |
31 |
43 |
| Active listings |
184 |
231 |
about 79 |
| New listings, last 30 days |
55 |
104 |
39 |
| Months of inventory |
4.38 (Buyer's Market) |
7.45 (Buyer's Market) |
1.84 (Seller's Market) |
What Redmond Homes Are Actually Selling For
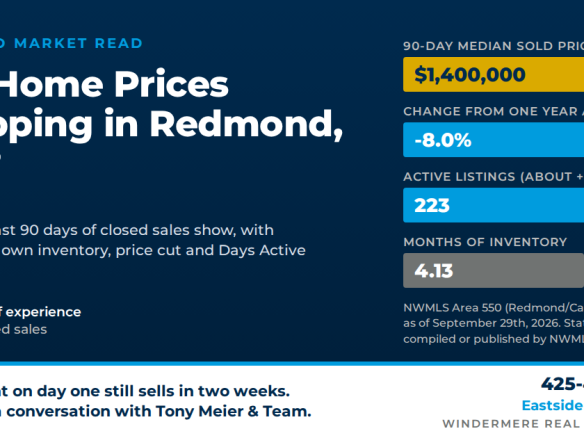
Over the last 90 days, 154 Redmond homes closed at a median of $1,400,000, down 11.6% from $1,583,500 a year ago. The median sale closed at 97.18% of final list price, 9.7% went over list (18.0% a year ago), and the median Cumulative Days Active (CDA) was 29 days, up from 19.5. The 30-day median of $1,285,000 rests on only 33 closings and swings with mix, so the 90-day figures lead here.
| Closed sales, trailing 90 days |
Now |
1 month ago |
1 year ago |
| Closings |
154 |
166 |
172 |
| Median sold price |
$1,400,000 |
$1,412,500 |
$1,583,500 |
| Median sale price to list price |
97.18% |
97.47% |
98.36% |
| Share sold over list price |
9.7% |
10.2% |
18.0% |
| Median CDA |
29.0 days |
28.0 days |
19.5 days |
How Redmond Is Repricing
About one in three homes currently for sale took a price reduction in the last 30 days, and list price per square foot is 10.6% below a year ago even though the median list price is only 3.2% lower. Active list prices are as of the latest feed on November 17th, 2026.
| Repricing measure |
Now |
1 month change |
1 year change |
| Active listings |
184 |
-20.3% (from 231) |
+132.9% (from about 79) |
| Price reductions in the last 30 days |
59 |
73 a month ago |
not available |
| Median list price |
$1,636,500 |
+3.0% |
-3.2% |
| List price per square foot |
$579 |
-1.5% |
-10.6% |
| Median CDA (90-day closings) |
29.0 days |
28.0 a month ago |
19.5 a year ago |
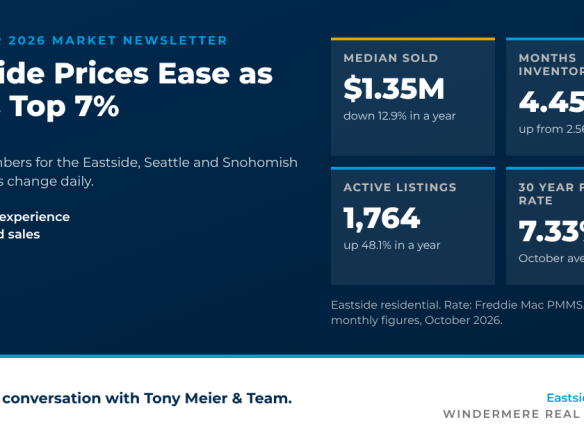
The 30-year fixed rate was 7.51% on November 16th, 2026, up from 7.37% a month ago and 6.25% a year ago; rates change daily. The buyers still active at 7.51% are serious, and 42 of them wrote contracts in the last 30 days.
Sell Now or Wait for Spring?
Spring brings more buyers, and it also brings the listing wave. Right now Redmond has the thinnest flow of new competition in months, so a home that launches in the next few weeks competes with fewer listings than it will in March. The trade is that winter buyers pay for condition and price, not potential. With 97.18% of list as the median outcome and 59 recent price cuts, a home that opens above the 90-day closed evidence will sit, and every added week of CDA costs leverage. If the home needs real preparation, use December to get it ready and launch in January or February, ahead of the spring inventory.
Here's What I Suggest
1. Price from the 90-day closed sales, not from the list prices around you. The median closing is $1,400,000 at 97.18% of list; the actives at $1,636,500 are the homes that have not sold yet.
2. Launch midweek with one strong weekend open house so buyers see each other, and let the first 14 days of CDA do the work.
3. Finish the preparation before photos. When one in three listings cuts its price, condition is the cheapest way to avoid being the next one.
4. If the home cannot be ready by early December, be the first fresh listing of the year rather than one of many in April.
Tony Meier & Team brings 37 years of experience, 808 closed sales, and $259M+ closed across 208 transactions since 2020 to every Eastside listing, plus 220 sales serving the English Hill Area as a resident since 2001. Weighing a Redmond sale? Call 425-466-1000 or visit
EastsideHomes.com and we will walk through your home's numbers, not the city's averages.
Related reading:
Are Home Prices Dropping in Redmond, WA?,
How Much House Can You Afford on a $250K Salary in Redmond?, and
Why Selling Your House This Winter Gives You an Edge.
Frequently Asked Questions
Is Redmond, WA a buyer's market right now?
By the numbers, yes. Redmond has 4.38 months of inventory as of November 17th, 2026, above the 4-month line. A month ago it was 7.45 and a year ago 1.84, so the market is softer than last year but tightening quickly.
What is the hardest month to sell a house?
In most years, late November through December brings the fewest new listings and closings. This November in Redmond, new listings fell 47% while pending sales rose 35.5%, so a smaller buyer pool is meeting even less competition. Price and condition matter more than the calendar.
Data as of November 17th, 2026, from Eastside Market Watch (Tony Meier & Team) for NWMLS Area 550 (Redmond/Carnation). Active listing counts and list prices are as of the latest feed and are provisional until confirmed against the live MLS; the one-year active count is reconstructed and approximate. Sold figures are final. Months of inventory is active plus contingent inventory divided by the trailing 30-day pending pace. The 30-year fixed rate is the Mortgage News Daily index for November 16th, 2026; rates change daily. Source: NWMLS listing data, compiled and analyzed by Tony Meier & Team through Eastside Market Watch. Statistics not compiled or published by Northwest Multiple Listing Service.
Tony Meier & Team | Windermere Real Estate / NE | Kirkland, WA | 425-466-1000 | EastsideHomes.com