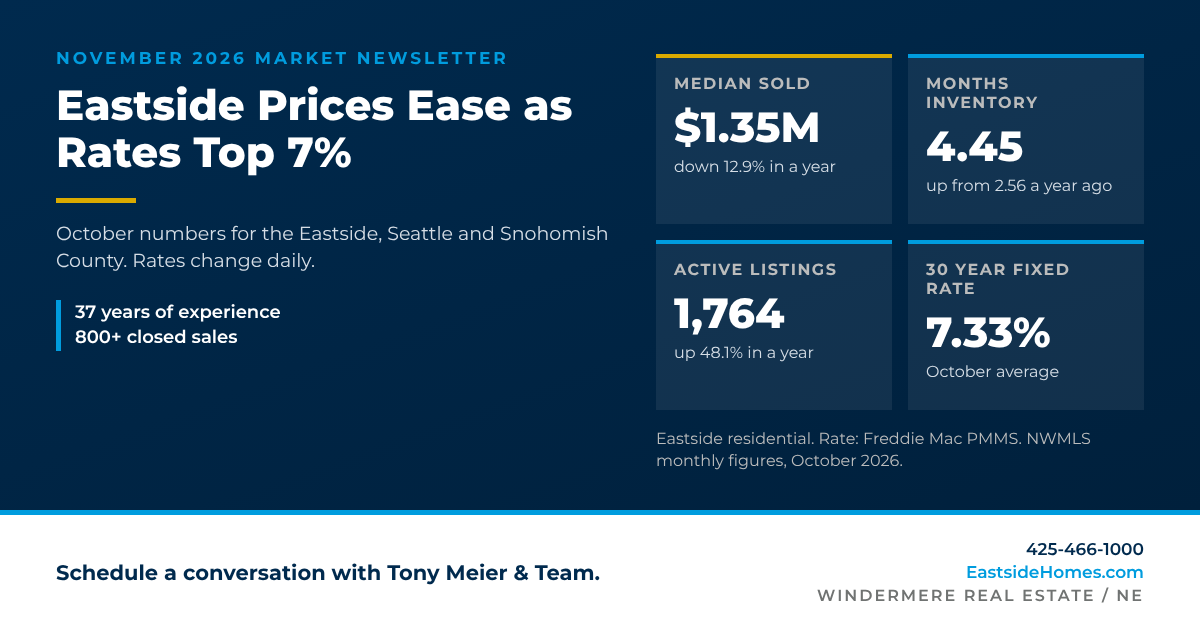
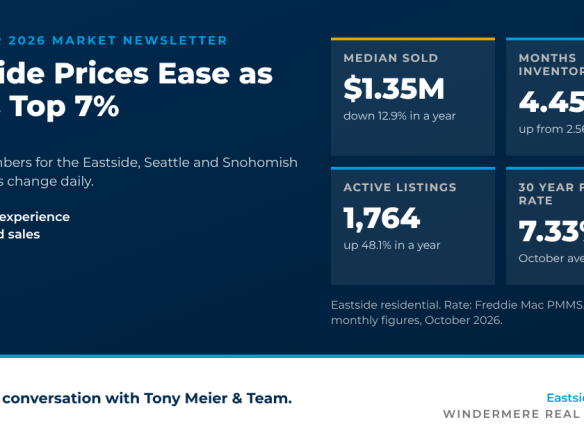
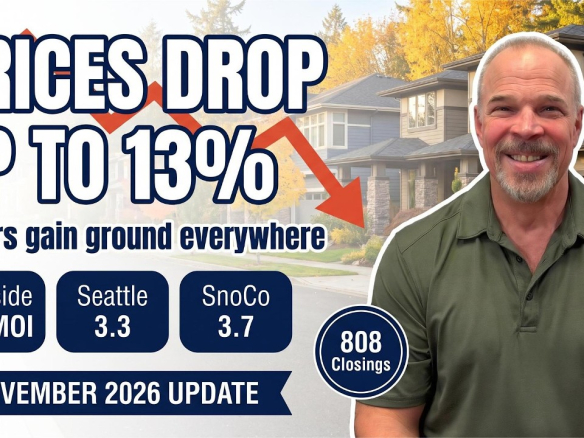
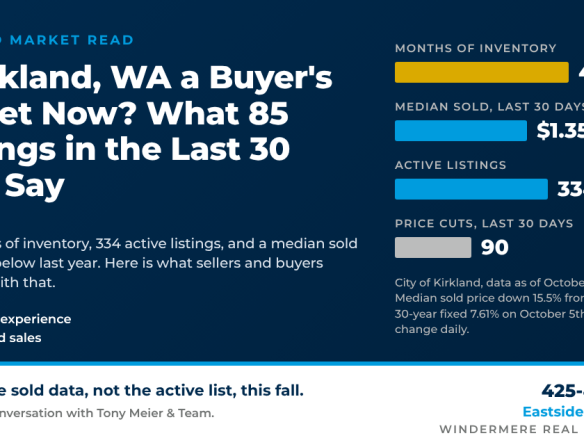
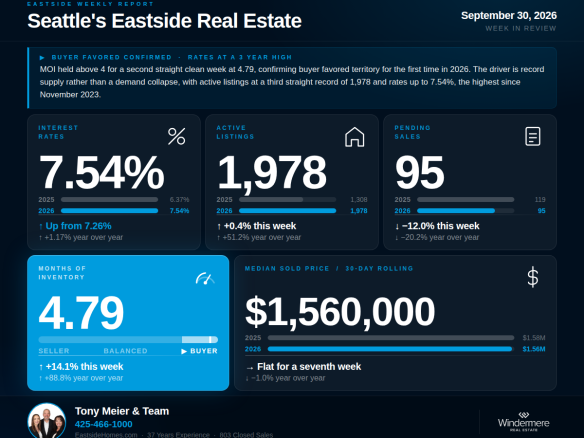
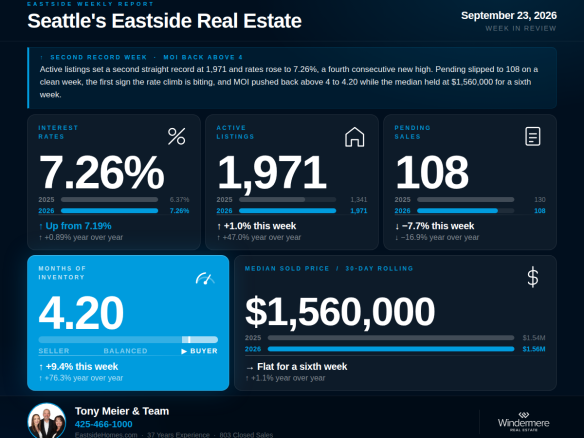
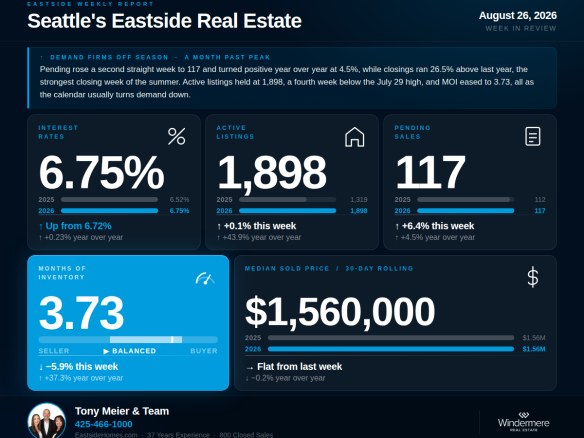
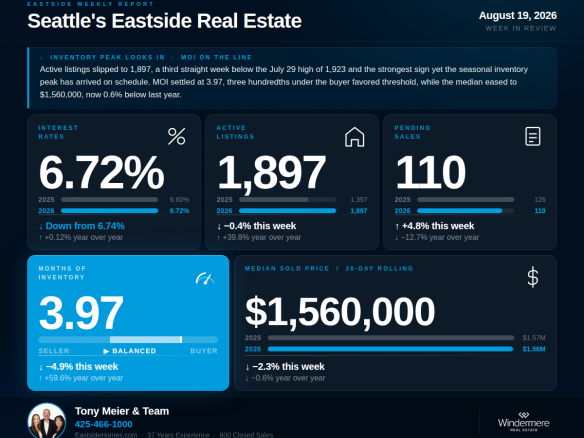
October put the Eastside firmly in buyers’ territory. The Eastside residential median sold price slipped to
$1,350,000, down 5.3% from September and down 12.9% from October 2025, while active listings ran 48.1% higher than a year ago and months of inventory rose to
4.45. With the 30-year fixed rate averaging
7.33% in October, here is what the NWMLS monthly numbers show for the Eastside, Seattle and Snohomish County, and what they mean for your next move.
What NWMLS Reported for October
Across the full NWMLS service area, active listings reached 23,519 in October, up 25.2% from a year ago, while pending sales fell 17.8% to 5,541 and closed sales fell 14.3%. The median price for all homes was $620,000, down 3.1%, and condominiums saw the sharpest drop, down 13.0% to $435,000. You can read the
full NWMLS release from November 5th, 2026. The statewide picture is useful context, but the numbers below are the ones that matter for homes on the Eastside, in Seattle and in Snohomish County.
The Eastside: A Buyer’s Market, Softening
|
October 2026 |
September 2026 |
October 2025 |
vs. last year |
| Median sold price |
$1,350,000 |
$1,425,000 |
$1,550,000 |
down 12.9% |
| Active listings |
1,764 |
1,941 |
1,191 |
up 48.1% |
| Pending sales |
396 |
478 |
466 |
down 15.0% |
| Months of inventory |
4.45 |
4.06 |
2.56 |
+1.89 |
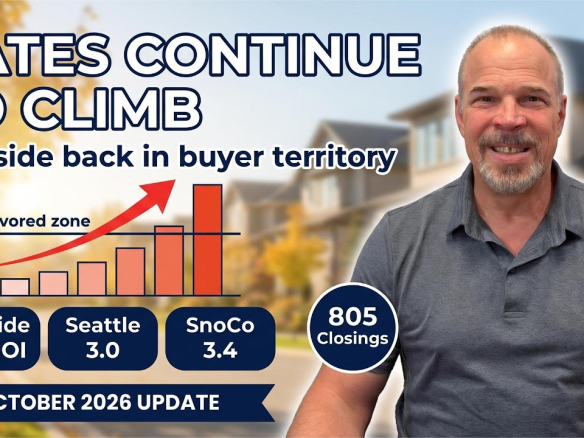
At 4.45 months of inventory, the Eastside sits above the 4.0 line that marks a buyer’s market, up from 4.06 in September and 2.56 a year ago. Active listings eased from September, but pending sales fell faster, from 478 to 396. Buyers have more homes to choose from and more time to decide than at any point in the past year.
Eastside condominiums moved further in the same direction. The condo median sold price was $572,472 in October, down 23.3% from a year ago, with 735 active listings, 131 pending sales and 5.61 months of inventory.
Seattle and Snohomish County
|
Median sold |
vs. September |
vs. last year |
Active listings |
Pending sales |
Months of inventory |
| Seattle |
$982,500 |
up 2.3% |
down 6.4% |
1,588 (up 22.4% YoY) |
479 (down 16.3% YoY) |
3.32 |
| Snohomish County |
$724,450 |
down 3.4% |
down 5.9% |
2,292 (up 44.3% YoY) |
622 (down 18.6% YoY) |
3.68 |
Seattle and Snohomish County are still balanced markets by months of inventory, at 3.32 and 3.68, but both rose from September (2.96 and 3.40) and are well above a year ago (2.27 and 2.08). Seattle was the only one of the three markets where the median sold price rose from September, up 2.3% to $982,500. In Snohomish County, active listings are 44.3% higher than a year ago while pending sales are 18.6% lower.
For Sellers: Here’s What I Suggest
Pricing right from the first day matters more than ever. Homes that launch at the right number still sell, and the ones that miss sit while the market moves past them. With 48% more homes for sale on the Eastside than a year ago, a pricing misstep is costly.
- Price to October, not last spring. The Eastside median is 12.9% below October 2025. Buyers compare your home with what just sold, not with what sold a year ago.
- Make the first two weeks count. Preparation, photography and launch timing carry more weight when buyers have more choices.
- Do not anchor on an online estimate. Online values lag a shifting market. Ask us for a number built from this month’s actual sales.
For Buyers: Here’s What I Suggest
Buyers have more leverage right now than they have had in recent years, but leverage only pays off at the negotiating table: knowing which homes have room on price, how to structure terms, and when to press or hold takes someone who studies this market every day.
- Get pre-approved and compare lenders. At 7.33%, a small difference in rate makes a real difference in your monthly payment.
- Use your leverage on terms, not just price. Inspection, timing and seller credits are all on the table when inventory is high.
- Look closely at homes that have been on the market longer. They are often where the most room to negotiate is.
After 37 years on the Eastside, that is what Tony Meier & Team does for every client. If you are thinking about a move, or simply want to know where your home stands today, call us at 425-466-1000 or visit
EastsideHomes.com. For the full breakdown on video, watch
our November market update, and for the latest weekly numbers see
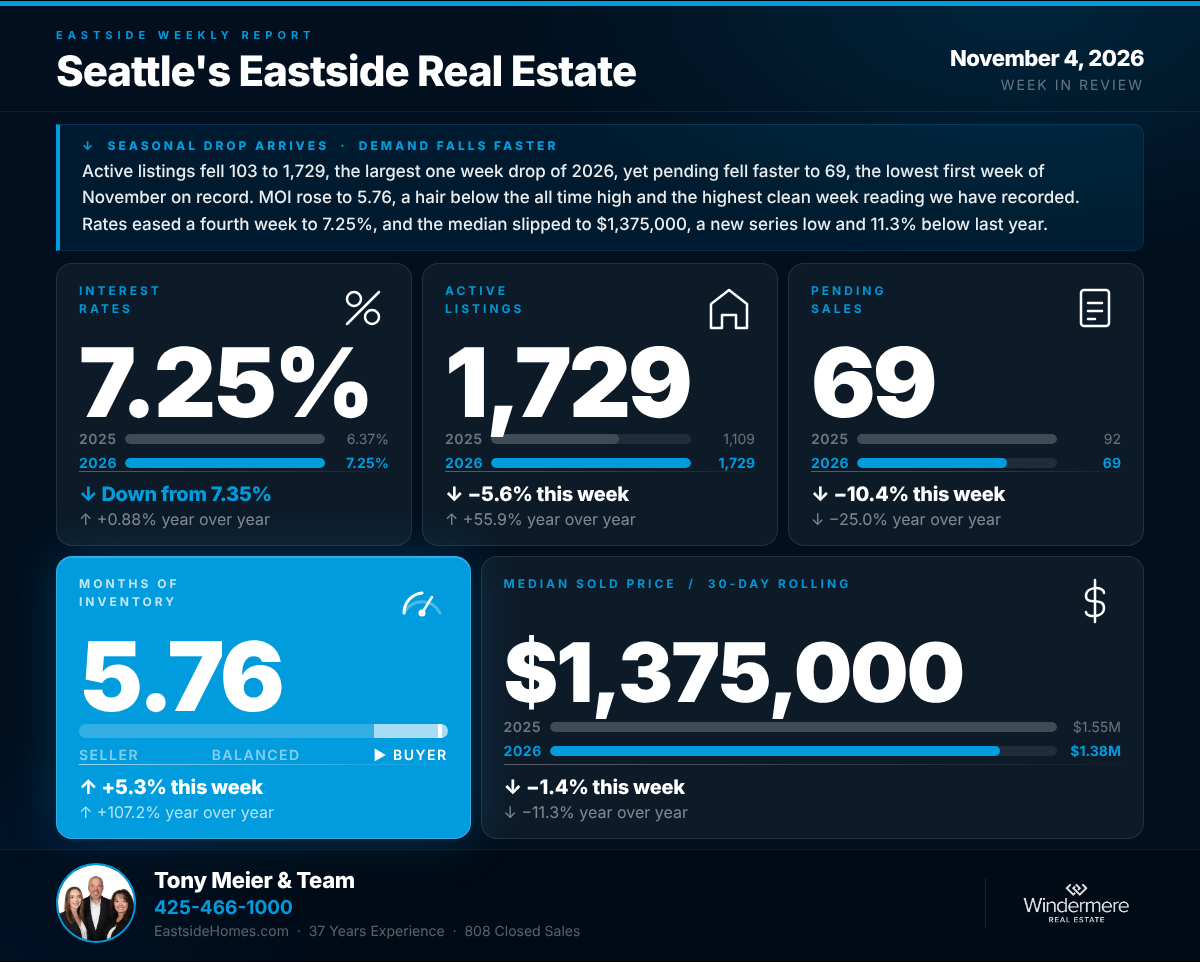
this week’s Eastside update.
Frequently Asked Questions
Is the Eastside a buyer’s market right now?
Yes, by months of inventory. The Eastside ended October at 4.45 months of inventory. Below 2 months is a seller’s market, 2 to 4 months is balanced, and above 4 months is a buyer’s market.
How much have Eastside home prices dropped?
The Eastside residential median sold price was $1,350,000 in October 2026, down 5.3% from September and down 12.9% from $1,550,000 in October 2025. A median reflects the mix of homes that sold in a given month, so the value of an individual home depends on its own neighborhood and features.
Are Seattle and Snohomish County buyer’s markets too?
No. Seattle (3.32) and Snohomish County (3.68) are balanced by months of inventory, though both rose from September and are well above a year ago.
Figures are NWMLS monthly residential statistics for October 2026 (Eastside condominium figures shown separately), the same series used in Tony Meier & Team’s monthly market reports. Months of inventory is active listings divided by pending sales. The 30-year fixed rate is the Freddie Mac PMMS average for October 2026 (7.33%); rates change daily. Median prices reflect the mix of homes sold in a given month. Information is deemed reliable but not guaranteed. Source: NWMLS listing data, compiled and analyzed by Tony Meier & Team through Market Watch. Statistics not compiled or published by Northwest Multiple Listing Service.