4 Min. Read
Audio Version
Tony Meier | Windermere Real Estate | 37 Years Experience | 798 Closed Eastside Sales
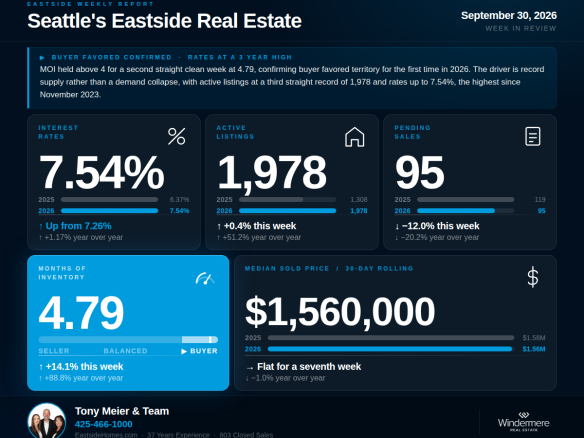
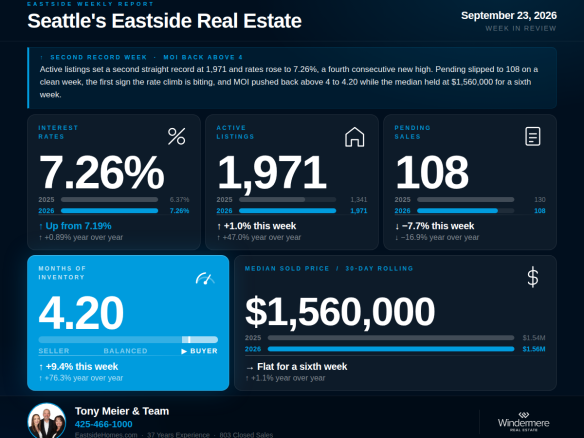
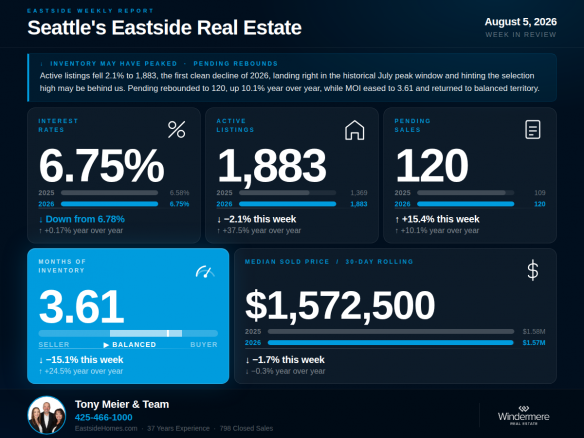
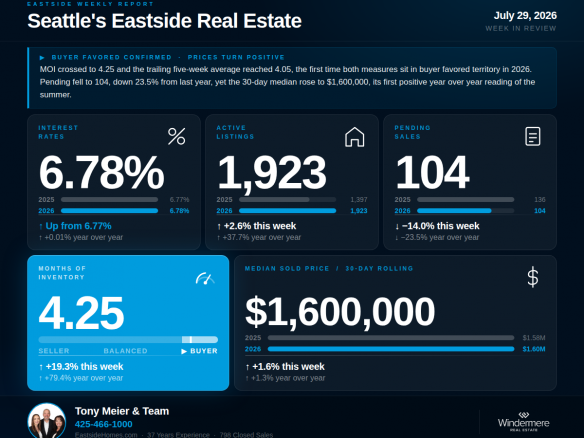
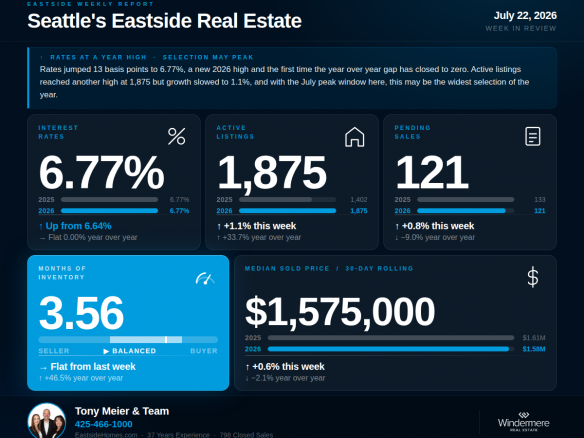
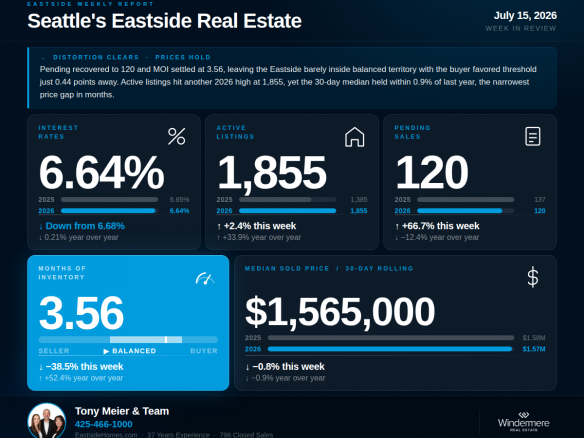
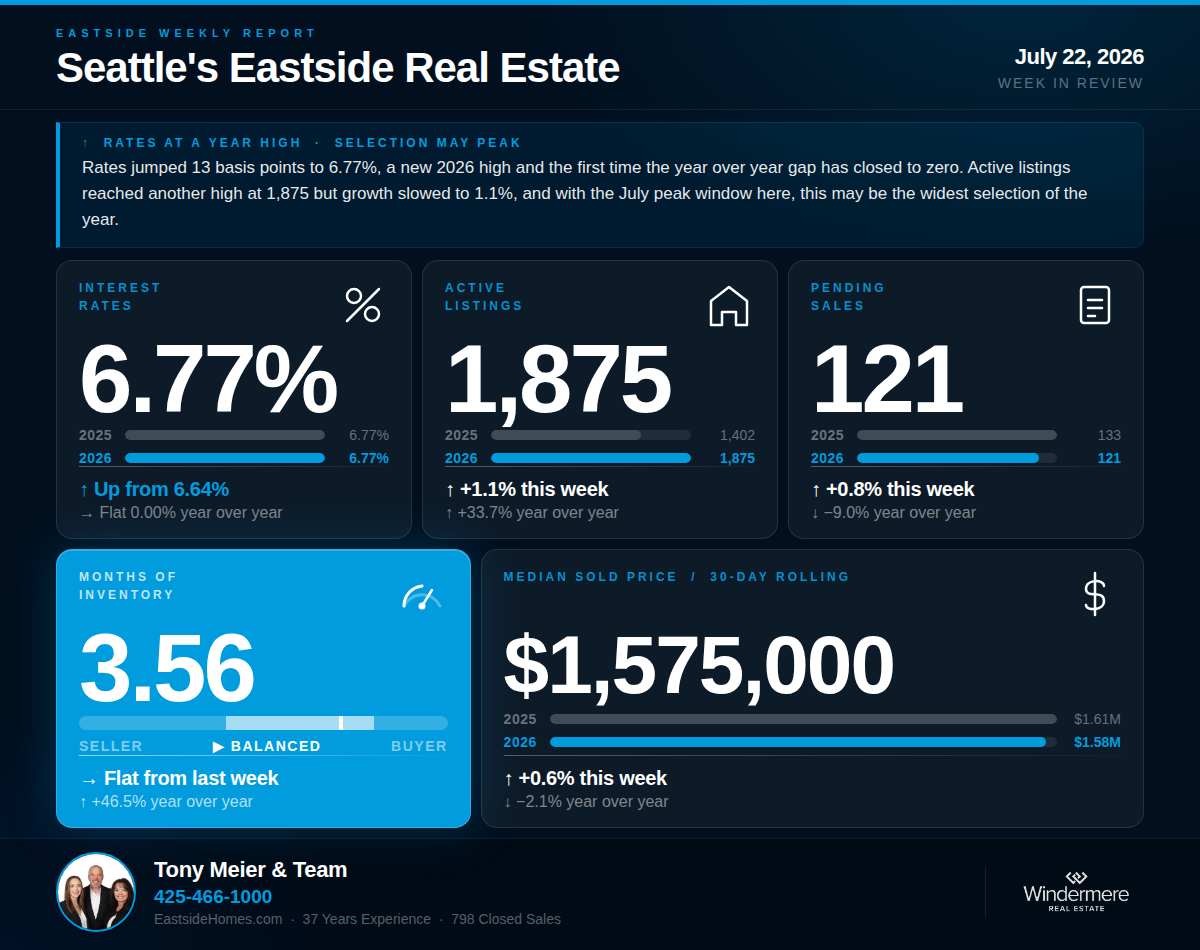
The rate story takes center stage this week. At 6.77%, rates jumped 13 basis points to a new 2026 high, surpassing the previous post-conflict high of 6.68%. More significantly, the last time rates were higher than today was July 28, 2025, when they briefly touched 6.81%. Nearly a full year has passed since buyers faced financing costs above this week's level. The year-over-year rate comparison now reads exactly 0.00%. The affordability tailwind that quietly helped buyers throughout the first half of 2026 is fully gone. Meanwhile, active listings reached another 2026 high at 1,875, but the pace of growth has slowed sharply, and the historical July peak window is now upon us. Pending sales held steady at 121, and MOI was flat at 3.56.
Rates jumped to 6.77% this week, up 13 basis points from last week and a new 2026 high. This surpasses the previous post-conflict high of 6.68% set two weeks ago. The more meaningful context is the longer view: the last time rates were higher than today was July 28, 2025, when they briefly touched 6.81%. Nearly a full year has passed since buyers faced financing costs above this level. The year-over-year rate comparison now reads exactly 0.00%. For the entire first half of 2026, buyers benefited from rates that were meaningfully below year-ago levels. That tailwind is now fully gone. The pre-conflict baseline of 5.99% sits 0.78 points below where rates are today. On a $1.5M home, this week's rate represents roughly $780 more per month in carrying costs than buyers faced in late February.
Active listings reached 1,875 this week, another 2026 high and up 33.7% from the 1,402 homes on the market during the comparable week in 2025. The pace of growth has slowed to 1.1% week over week, among the smallest gains of the year. The historical July peak window is now upon us. Whether inventory tops out in the next two weeks or continues grinding higher will be a defining data point for the second half of 2026.
Pending sales held essentially flat at 121 this week, up 0.8% from last week's 120 and down 9.0% from the 133 recorded during the comparable week in 2025. Two consecutive stable, clean readings after the holiday volatility give us a reliable demand baseline: buyer activity is running about 9 to 12 percent below last year. The stability itself is worth noting, given that this week's reading arrived alongside the highest rates of the year.
MOI held flat at 3.56 this week, unchanged from last week and 46.5% above the 2.43 recorded during the comparable week in 2025. The trailing five-week average is 3.91, just below the buyer-favored threshold of 4. The market remains in the upper end of balanced territory, where it has now sat for most of the summer. Two consecutive identical readings suggest the market has found a temporary equilibrium: inventory growth has slowed and demand has stabilized, leaving the supply and demand balance essentially unchanged week to week.
The 30-day median ticked up to $1,575,000, up 0.6% from last week and 2.1% below the $1,608,240 recorded at this same point in 2025. The price gap has widened slightly from last week's 0.9% but remains far narrower than the 7.7% gap of early June. Closed sales came in at 112, exactly matching the 112 recorded during the comparable week in 2025.
We have done extensive analysis on what this shift means for sellers in each Eastside sub-market and would welcome the opportunity to walk you through what the data shows for your specific area and home.
If we can help you think through what this means for your move, we are here.
Tony Meier & Team — Windermere Real Estate / NE, Kirkland, WA
Audio Version
Tony Meier | Windermere Real Estate | 37 Years Experience | 798 Closed Eastside Sales
The rate story takes center stage this week. At 6.77%, rates jumped 13 basis points to a new 2026 high, surpassing the previous post-conflict high of 6.68%. More significantly, the last time rates were higher than today was July 28, 2025, when they briefly touched 6.81%. Nearly a full year has passed since buyers faced financing costs above this week's level. The year-over-year rate comparison now reads exactly 0.00%. The affordability tailwind that quietly helped buyers throughout the first half of 2026 is fully gone. Meanwhile, active listings reached another 2026 high at 1,875, but the pace of growth has slowed sharply, and the historical July peak window is now upon us. Pending sales held steady at 121, and MOI was flat at 3.56.
💰 Interest Rates — 6.77%
↑ Up 13 bp from last week's 6.64% | → Flat 0.00% year over yearRates jumped to 6.77% this week, up 13 basis points from last week and a new 2026 high. This surpasses the previous post-conflict high of 6.68% set two weeks ago. The more meaningful context is the longer view: the last time rates were higher than today was July 28, 2025, when they briefly touched 6.81%. Nearly a full year has passed since buyers faced financing costs above this level. The year-over-year rate comparison now reads exactly 0.00%. For the entire first half of 2026, buyers benefited from rates that were meaningfully below year-ago levels. That tailwind is now fully gone. The pre-conflict baseline of 5.99% sits 0.78 points below where rates are today. On a $1.5M home, this week's rate represents roughly $780 more per month in carrying costs than buyers faced in late February.
🏡 Active Listings — 1,875
↑ Up 1.1% from last week | ↑ Up 33.7% year over yearActive listings reached 1,875 this week, another 2026 high and up 33.7% from the 1,402 homes on the market during the comparable week in 2025. The pace of growth has slowed to 1.1% week over week, among the smallest gains of the year. The historical July peak window is now upon us. Whether inventory tops out in the next two weeks or continues grinding higher will be a defining data point for the second half of 2026.
📝 Pending Sales — 121
↑ Up 0.8% from last week | ↓ Down 9.0% year over yearPending sales held essentially flat at 121 this week, up 0.8% from last week's 120 and down 9.0% from the 133 recorded during the comparable week in 2025. Two consecutive stable, clean readings after the holiday volatility give us a reliable demand baseline: buyer activity is running about 9 to 12 percent below last year. The stability itself is worth noting, given that this week's reading arrived alongside the highest rates of the year.
📦 Months of Inventory — 3.56
→ Flat from last week | ↑ Up 46.5% year over yearMOI held flat at 3.56 this week, unchanged from last week and 46.5% above the 2.43 recorded during the comparable week in 2025. The trailing five-week average is 3.91, just below the buyer-favored threshold of 4. The market remains in the upper end of balanced territory, where it has now sat for most of the summer. Two consecutive identical readings suggest the market has found a temporary equilibrium: inventory growth has slowed and demand has stabilized, leaving the supply and demand balance essentially unchanged week to week.
🏠 Median Sold Price (Rolling 30-Day) — $1,575,000
↑ Up 0.6% from last week | ↓ Down 2.1% year over yearThe 30-day median ticked up to $1,575,000, up 0.6% from last week and 2.1% below the $1,608,240 recorded at this same point in 2025. The price gap has widened slightly from last week's 0.9% but remains far narrower than the 7.7% gap of early June. Closed sales came in at 112, exactly matching the 112 recorded during the comparable week in 2025.
🔍 The Big Picture — What This All Means
This week's data would read as stable, almost quiet, if not for the rate move. Inventory is at a high but growing slowly. Pending is flat. MOI is unchanged. Prices are holding within about two percent of last year. Then there is the rate story: rates have not been higher since July 28, 2025, and the year-over-year rate advantage that buyers carried through the entire first half of 2026 has now closed to zero. The question for the weeks ahead is whether demand, which has held steady in the 120 range through the recent rate climb, can continue absorbing higher carrying costs. Historically, sustained rate moves above prior-year levels pressure demand with a lag of several weeks. That, combined with whether the July inventory peak arrives on schedule, will shape the second half of the summer.🏠 For Sellers
Pricing discipline remains the most critical decision you will make this summer, and this week's rate move raises the stakes. At 6.77%, buyers are carrying the highest financing costs in a year, which tightens every affordability calculation against your list price. Inventory is at another 2026 high, demand is running about 9 percent below last year, and the trailing MOI average sits just below the buyer-favored threshold. Prices have held remarkably well, within about two percent of last year, but that resilience belongs to homes priced accurately against current comparable sales. Sellers who are in the market now, priced to today's reality, continue to have the best opportunity of the summer.We have done extensive analysis on what this shift means for sellers in each Eastside sub-market and would welcome the opportunity to walk you through what the data shows for your specific area and home.
🔑 For Buyers
Buyers today continue to have more negotiating leverage for this time of year than at any point since 2011, but this week's data carries two warnings. First, the rate move changes the affordability math. At 6.77%, rates are the highest in a year, and stress-testing your qualification at current levels is now essential rather than optional. Second, and just as important: do not assume selection will keep growing. The pace of inventory growth has slowed to 1.1% week over week, among the smallest gains of the year, and the historical July peak window is now upon us. Based on 20 years of data, active listings typically top out in July and then begin a sustained decline through fall and winter. Buyers waiting for more choices may find the selection window has already peaked. Active listings at 1,875 are the widest of 2026, and that may be as wide as it gets this year. For buyers with rate flexibility, whether through points, buydowns, or adjustable products, this combination of maximum selection and reduced competition is a genuine opportunity, but it is a window, not a permanent condition.If we can help you think through what this means for your move, we are here.
Tony Meier & Team — Windermere Real Estate / NE, Kirkland, WA