Audio Version
Tony Meier | Windermere Real Estate | 37 Years Experience | 798 Closed Eastside Sales
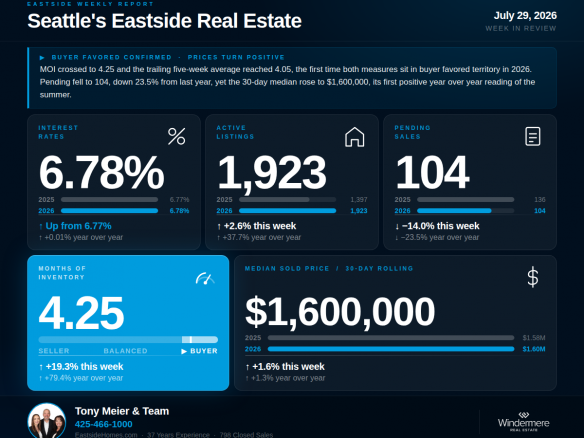
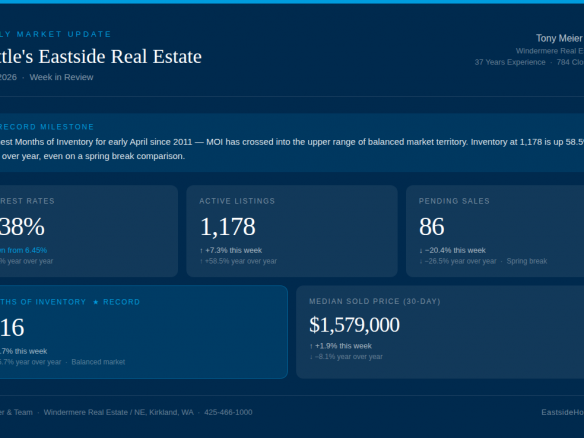
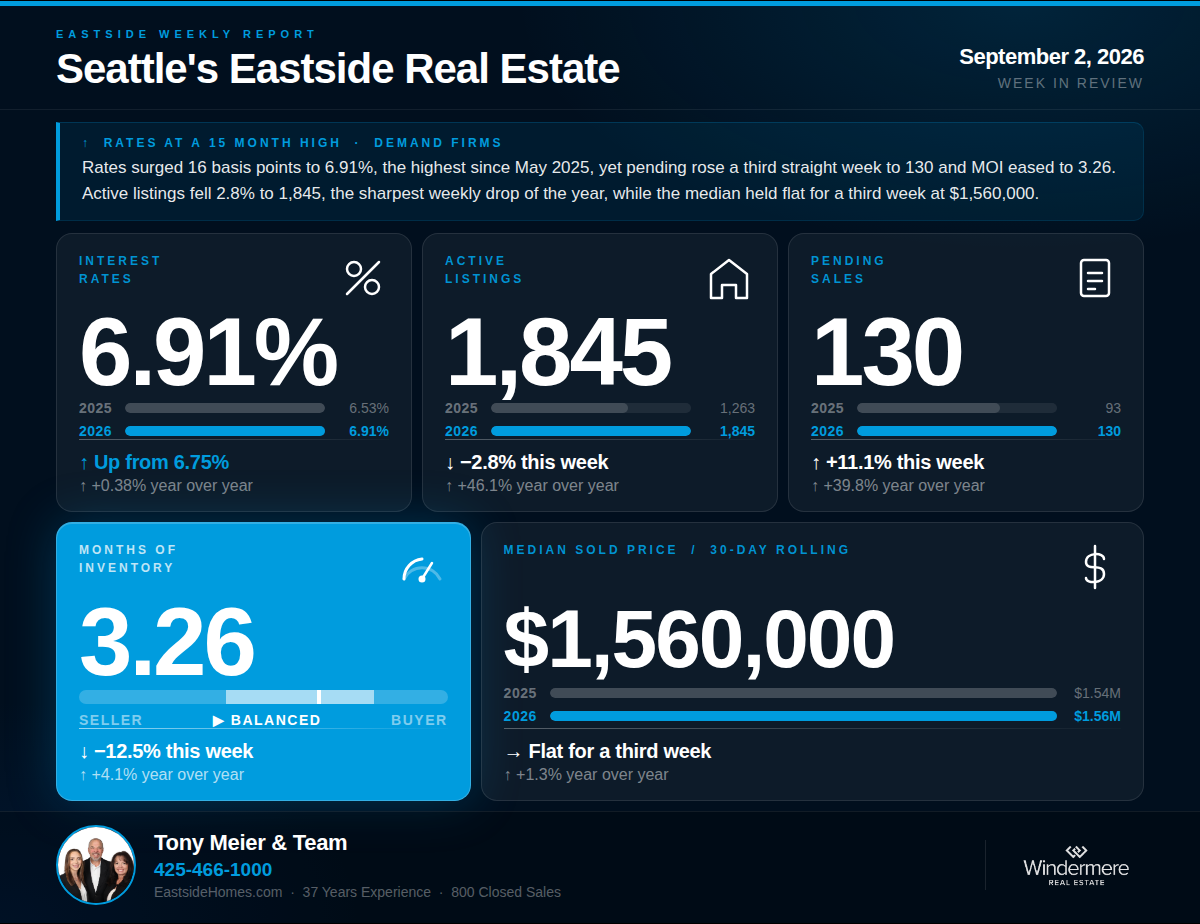
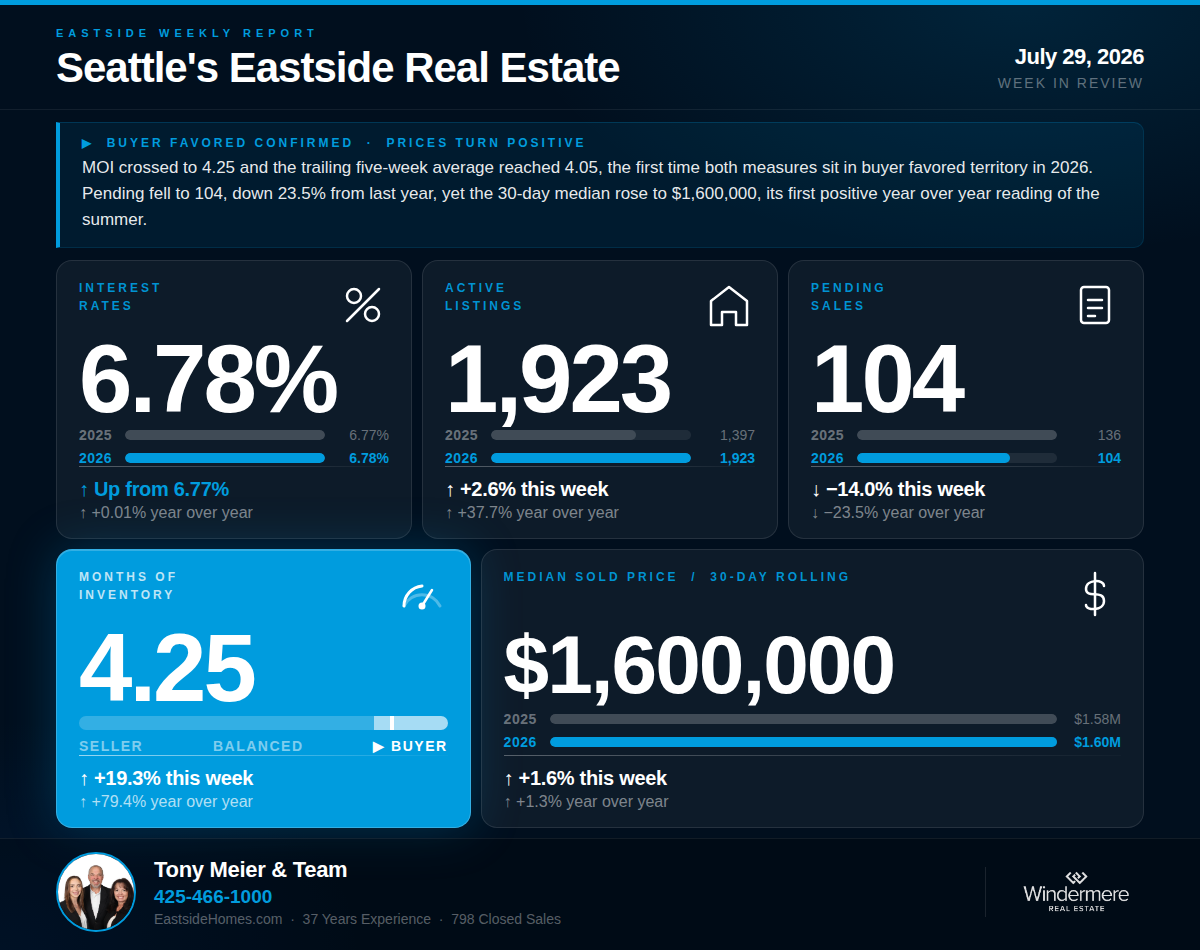
This week delivers the cleanest and most consequential data of the summer, with no holiday to explain any of it. Pending sales fell to 104 on a clean, full working week, down 23.5% year over year. Months of Inventory crossed back above 4 to 4.25, and for the first time in 2026, the trailing five-week average also crossed the buyer-favored threshold at 4.05. Active listings jumped to 1,923, another 2026 high with the year-over-year gap at its widest of the year. Rates ticked up to 6.78%, yet another new 2026 high. And in the middle of all of it, the 30-day median posted its first positive year-over-year reading of the summer at $1,600,000, up 1.3% from a year ago.
💰 Interest Rates — 6.78% | ↑ Up 1 bp from last week's 6.77% | ↑ Up 0.01% year over year
Rates ticked up to 6.78% this week, up 1 basis point from last week and another new 2026 high. Rates are now 0.01% above the comparable week in 2025, the first positive year-over-year reading of 2026. The last time rates were higher remains July 28, 2025, when they briefly touched 6.81%, and this week's reading sits just 3 basis points below that mark. The pre-conflict baseline of 5.99% is now 0.79 points below where rates sit today. On a $1.5M home, this week's rate represents roughly $790 more per month in carrying costs than buyers faced in late February.
🏡 Active Listings — 1,923 | ↑ Up 2.6% from last week | ↑ Up 37.7% year over year
Active listings jumped to 1,923 this week, another 2026 high and up 37.7% from the 1,397 homes on the market during the comparable week in 2025. That is the widest year-over-year inventory gap of the entire year. The pace of growth re-accelerated to 2.6% week over week after two weeks of slowing, which answers last week's question directly: the July peak has not yet arrived. Inventory is still building as we head into August.
📝 Pending Sales — 104 | ↓ Down 14.0% from last week | ↓ Down 23.5% year over year
Pending sales fell to 104 this week, down 14.0% from last week's 121 and down 23.5% from the 136 recorded during the comparable week in 2025. This is the reading that matters most in this update. There is no holiday this week, no distortion, and no calendar excuse. Two weeks ago we noted that sustained rate moves above prior-year levels historically pressure demand with a lag of several weeks. This week's decline, arriving alongside the second consecutive week of new rate highs, is consistent with that lag beginning to bite. The trailing five-week pending average now sits at 111, and the year-over-year gap has widened from the 9 to 12 percent range to 23.5% in a single clean week.
📦 Months of Inventory — 4.25 | ↑ Up 19.3% from last week's 3.56 | ↑ Up 79.4% year over year
MOI jumped to 4.25 this week, up 19.3% from last week and 79.4% above the 2.37 recorded during the comparable week in 2025. This is the second weekly crossing into buyer-favored territory this year, but the more significant milestone is quieter: the trailing five-week average is now 4.05, above the buyer-favored threshold of 4 for the first time in 2026. The June 24 crossing was a single-week event that reversed the following week. This one arrives with the smoothed measure confirming it. By the local classification, 0 to 2 months is seller favored, 2 to 4 is balanced, and 4 or more is buyer favored. On both the weekly reading and the five-week average, the Eastside is now in buyer-favored territory.
🏠 Median Sold Price (Rolling 30-Day) — $1,600,000 | ↑ Up 1.6% from last week | ↑ Up 1.3% year over year
The 30-day median rose to $1,600,000 this week, up 1.6% from last week and up 1.3% from the $1,580,000 recorded at this same point in 2025. This is the first positive year-over-year price reading of the summer, a remarkable data point given everything else in this update. From a 7.7% deficit in early June, the price gap has closed entirely and turned positive. Closed sales came in at 102, down 21.5% year over year from the 130 recorded during the comparable week in 2025, reflecting contracts written during the softer late-June period.
🔍 The Big Picture — What This All Means
The story this week is convergence. For months, the structural picture has pointed toward a buyer-favored market: inventory climbing, demand below year-ago levels, MOI grinding higher. This week, all of it arrived at once on a clean calendar. MOI is above 4 on both the weekly reading and the five-week average. Pending fell hard with no holiday to blame, consistent with the lagged rate effect we flagged two weeks ago. Inventory hit a new high with the widest year-over-year gap of 2026. And yet the median price posted its first positive year-over-year reading of the summer. That last point deserves emphasis: this is not a market where values are collapsing. It is a market where well-priced, well-prepared homes are still commanding strong prices while the number of transactions shrinks. Fewer deals are happening, but the deals that happen are holding value. That is the defining tension of the second half of 2026.
🏠 For Sellers
The Eastside is now in buyer-favored territory on both the weekly MOI reading and the five-week average, and pricing discipline has never mattered more this year. Here is the paradox working in your favor: the 30-day median is up 1.3% year over year, the first positive reading of the summer. Accurately priced homes are not just selling, they are holding value in a market with 37.7% more competition than last year. What has changed is the margin for error. With pending sales down 23.5% year over year and buyers carrying the highest rates in a year, an overpriced listing does not get a second look. Sellers who price to today's comparable sales are capturing strong values. Sellers who price to hope are feeding days on market.
We have done extensive analysis on what this shift means for sellers in each Eastside sub-market and would welcome the opportunity to walk you through what the data shows for your specific area and home.
🔑 For Buyers
Buyers, the market has now formally shifted in your favor by the local MOI standard, and selection is still growing. Active listings at 1,923 are the widest of 2026, and the July peak has not yet arrived, meaning August may open with even more choices. Competition is thinner: pending sales at 104 on a clean week means fewer rival offers on most properties. The counterweight is financing. At 6.78%, rates are at their 2026 high and now slightly above year-ago levels, so stress-testing your qualification at current rates is essential. One more consideration: the median price just turned positive year over year, which means waiting for broad price declines has not been a winning strategy. The opportunity is negotiating position and selection, not falling values.
If we can help you think through what this means for your move, we are here.
Tony Meier & Team — Windermere Real Estate / NE, Kirkland, WA