5 Min. Read
Audio Version
Tony Meier | Windermere Real Estate | 37 Years Experience | 804 Closed Eastside Sales
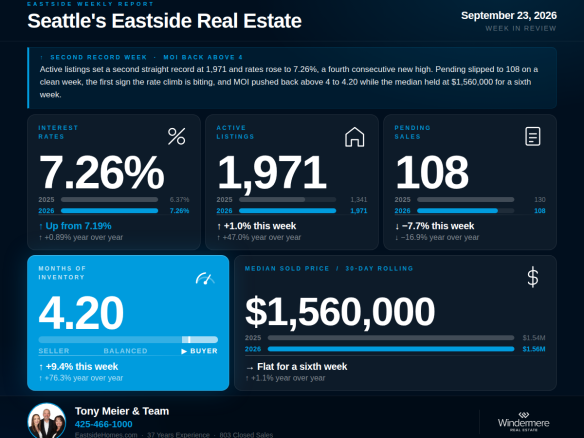
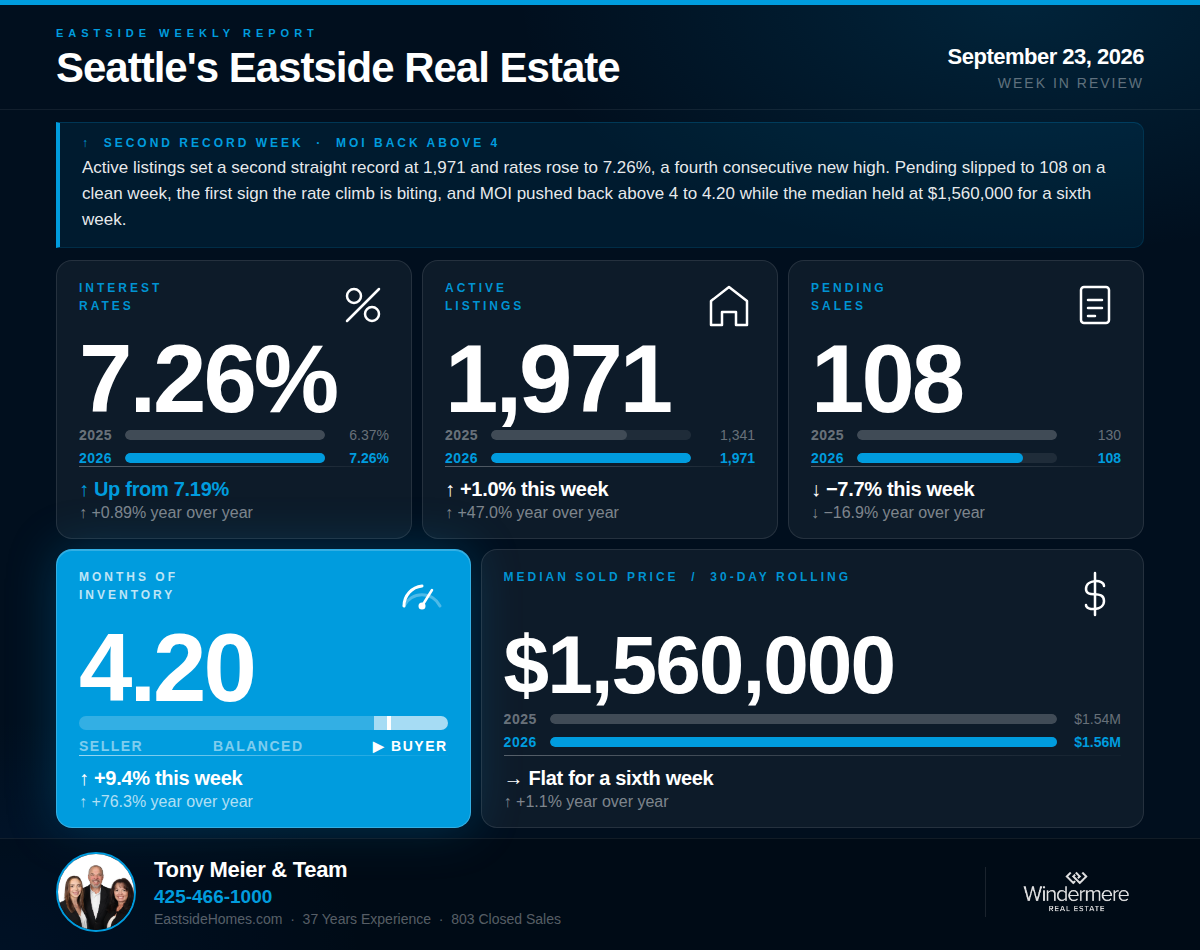
Last week we wrote that if the rate spike slowed demand while the fall listing wave kept building, the next test of the buyer-favored line would come from both directions at once. That is exactly what this week delivered. Active listings climbed to 1,971, a second consecutive record week for our six-year weekly series. Rates rose to 7.26%, a fourth straight new 2026 high and the highest since May 2024. Pending sales slipped to 108 on a clean calendar week, the first sign the rate surge may be biting. MOI crossed back above 4 to 4.20, pushed from both sides of the ratio. And through all of it, the 30-day median held at $1,560,000 for a sixth consecutive week, now 1.1% above last year.
If we can help you think through what this means for your move, we are here. Tony Meier & Team — Windermere Real Estate / NE, Kirkland, WA
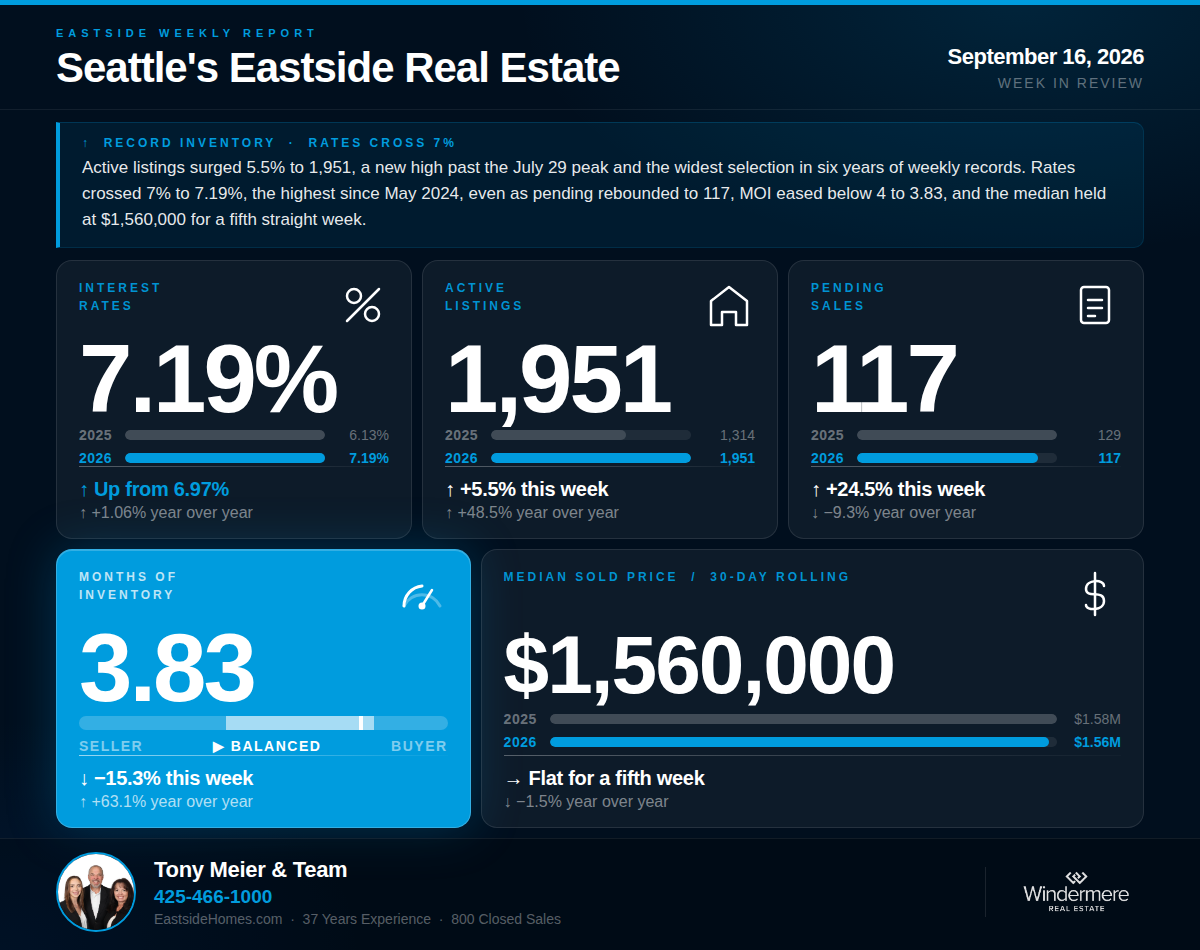
💰 Interest Rates — 7.26% | ↑ Up 7 bp from last week's 7.19% | ↑ Up 0.89% year over year
Rates climbed to 7.26% this week, up 7 basis points from last week and a fourth consecutive new 2026 high. The last time rates printed higher was late May 2024, when they reached 7.34%. The four-week climb now totals 51 basis points, and the pre-conflict baseline of 5.99% sits 1.27 points below current rates. On a $1.5M home, this week's rate represents roughly $1,270 more per month in carrying costs than buyers faced in late February. Rates are up 0.89% from the comparable week in 2025, and every week of this climb tightens the affordability math a little further.🏡 Active Listings — 1,971 | ↑ Up 1.0% from last week | ↑ Up 47.0% year over year
Active listings rose to 1,971 this week, up 1.0% from last week and a second consecutive record for our six-year weekly series. The fall listing wave that rewrote the inventory story last week is still building, though the pace slowed from 5.5% to 1.0%. Year over year, inventory sits 47.0% above the 1,341 recorded during the comparable week in 2025. Two record weeks in late September put 2026 in rare territory: as we noted last week, no September in twenty years of NWMLS monthly data has carried more than 1,900 active listings since 2011, and this month is now tracking near 2,000.📝 Pending Sales — 108 | ↓ Down 7.7% from last week | ↓ Down 16.9% year over year
Pending sales slipped to 108 this week, down 7.7% from last week and down 16.9% from the 130 recorded during the comparable week in 2025. This is a clean calendar week with no holiday to blame, and it is the reading we flagged to watch. The four-week rate climb of 51 basis points is larger than the July surge that cooled demand with a several-week lag, and this week's decline is consistent with that lag beginning again. One week is not confirmation. The trailing five-week average of 113 still describes a market in the demand band that has held since June. But the direction bears watching, because it arrived exactly on the schedule the July precedent predicted.📦 Months of Inventory — 4.20 | ↑ Up 9.4% from last week's 3.83 | ↑ Up 76.3% year over year
MOI crossed back above 4 this week, landing at 4.20, up 9.4% from last week and 76.3% above the 2.38 recorded during the comparable week in 2025. This is the seventh reading above 4 this year, and it is different from the last one: no holiday produced it. The numerator rose to a record 1,971 while the denominator slipped to 108, the both-directions squeeze we flagged last week. The market has still never held above 4 for two consecutive weeks in 2026, and the trailing five-week average of 3.91 sits just below the line. Whether next week makes it two in a row is now the single most important question in the data.🏠 Median Sold Price (Rolling 30-Day) — $1,560,000 | → Flat for a sixth week | ↑ Up 1.1% year over year
The 30-day median held at $1,560,000 for a sixth consecutive week, and the year-over-year comparison turned positive at 1.1% as last year's September softening rolls into the comparison window. Six identical weekly readings spanning a holiday, a record inventory wave, and a 51-basis-point rate climb is a price floor with conviction. The mid-August caveat still applies: per-square-foot values run softer than the headline. Closed sales came in at 107, up 18.9% from the 90 recorded during the comparable week in 2025, the strongest closing comparison since late August, reflecting contracts written during the firm late-August stretch.🔍 The Big Picture — What This All Means
The squeeze we anticipated is now visible in the data. Selection is at a record and still growing. Financing is at a twenty-eight-month high and still climbing. Demand slipped this week for the first time since the holiday, right on the lag schedule the July rate surge taught us. MOI is back above 4 with both sides of the ratio pushing it there. And prices have not moved in six weeks. This is a market where the stakes are rising for both sides: sellers face the most competition in the modern record, buyers face the most expensive financing in over two years, and the standoff shows up as a frozen median and thinning transaction volume. Next week answers the question 2026 has asked seven times: can MOI hold above 4 for two consecutive weeks? If pending keeps sliding while the fall wave builds, the answer is probably yes, and the buyer-favored designation would finally arrive with staying power.🏠 For Sellers
Sellers, the competitive picture sharpened again: 1,971 active listings is a second straight record, and the buyers absorbing 7.26% financing just showed the first sign of thinning. This is the environment where pricing decides everything. The median has held six straight weeks because accurately priced homes keep selling at full value, and closings are up 18.9% year over year, proof that well-positioned listings are transacting right through the rate climb. But the margin is gone: with a record number of alternatives and financing costs up $1,270 a month since February, buyers walk past any home priced above the evidence. If you are on the market or coming soon, price to the current per-square-foot comparables, present impeccably, and capture the serious buyers before the holiday slowdown thins them further. We have done extensive analysis on what this shift means for sellers in each Eastside sub-market and would welcome the opportunity to walk you through what the data shows for your specific area and home.🔑 For Buyers
Buyers, the selection record extended and your competition thinned, but the financing bill rose again. At 7.26%, rates are the highest in twenty-eight months, and the four-week climb of 51 basis points has repriced every payment calculation, so refresh your qualification before touring. The leverage math still favors you: nearly 2,000 homes to choose from, pending down 17% from last year, MOI back above the buyer-favored line, and a median that has not budged in six weeks. If MOI holds above 4 next week, negotiating conditions tilt further your way heading into October. The discipline is on the financing side: price buydowns with your lender, know your true monthly number at today's rates, and let the record selection do the negotiating for you on the right home.If we can help you think through what this means for your move, we are here. Tony Meier & Team — Windermere Real Estate / NE, Kirkland, WA