Audio Version
Tony Meier | Windermere Real Estate | 37 Years Experience | 800 Closed Eastside Sales
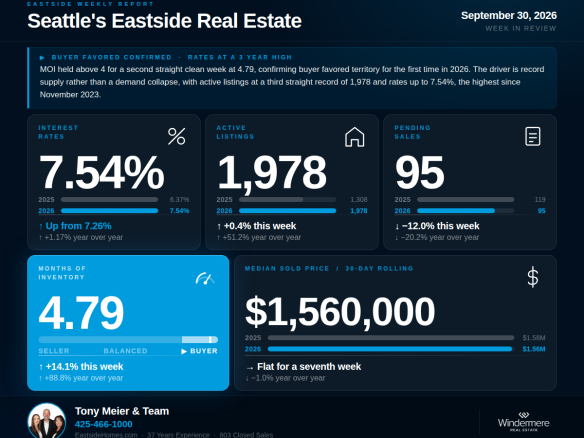
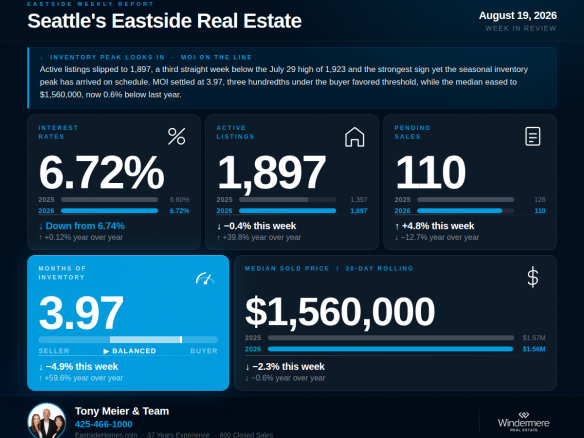
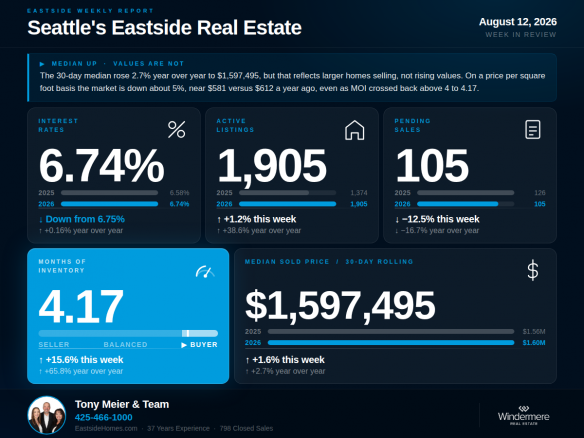
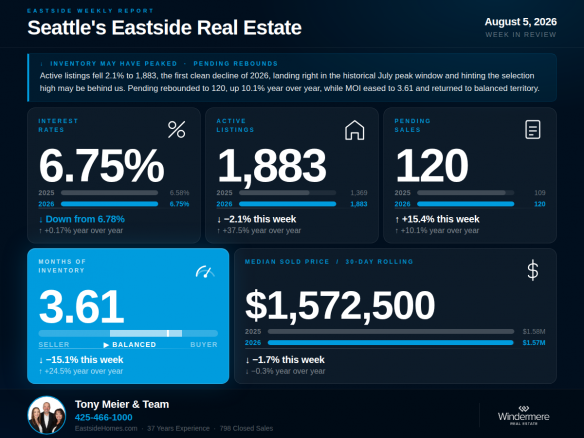
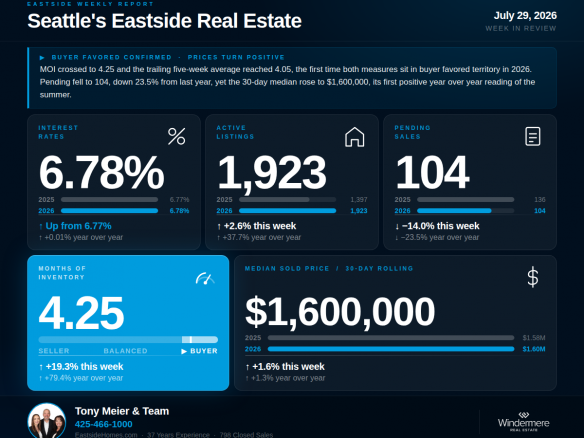
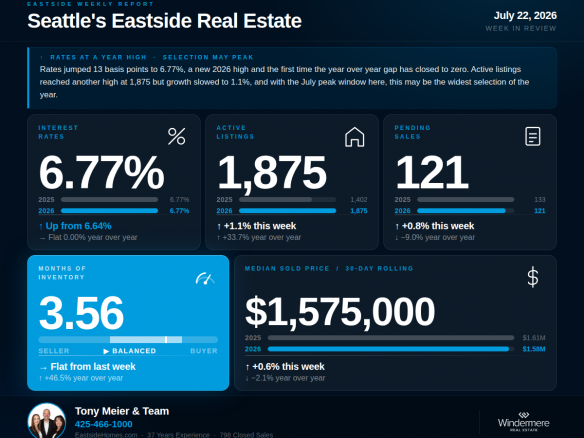
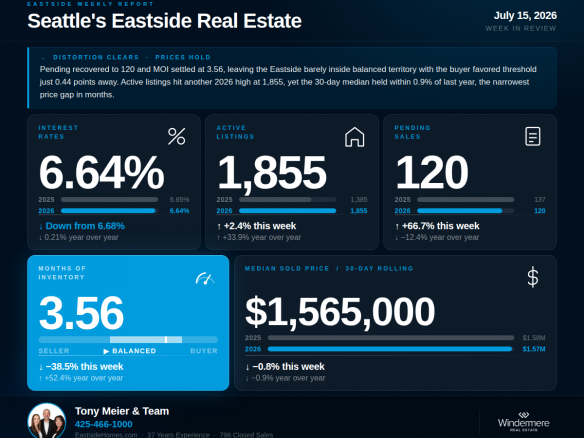
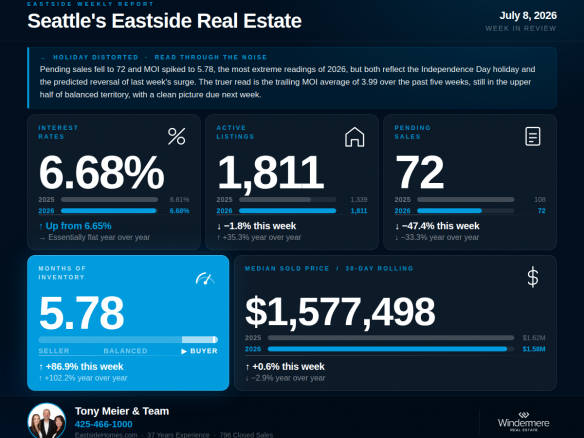
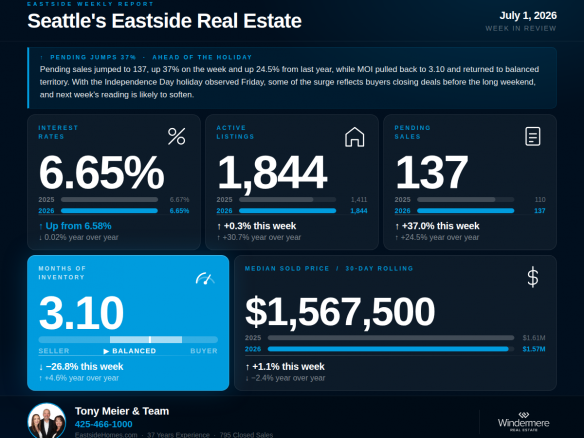
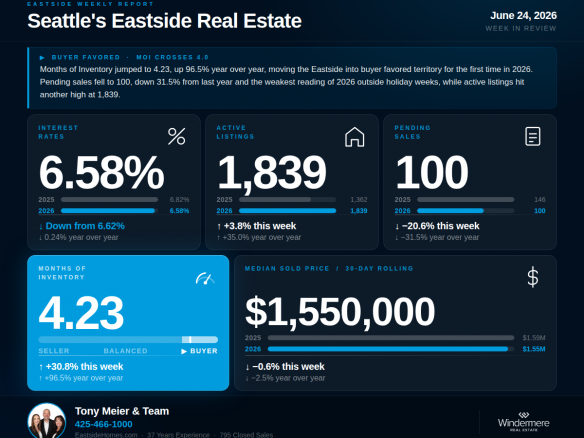
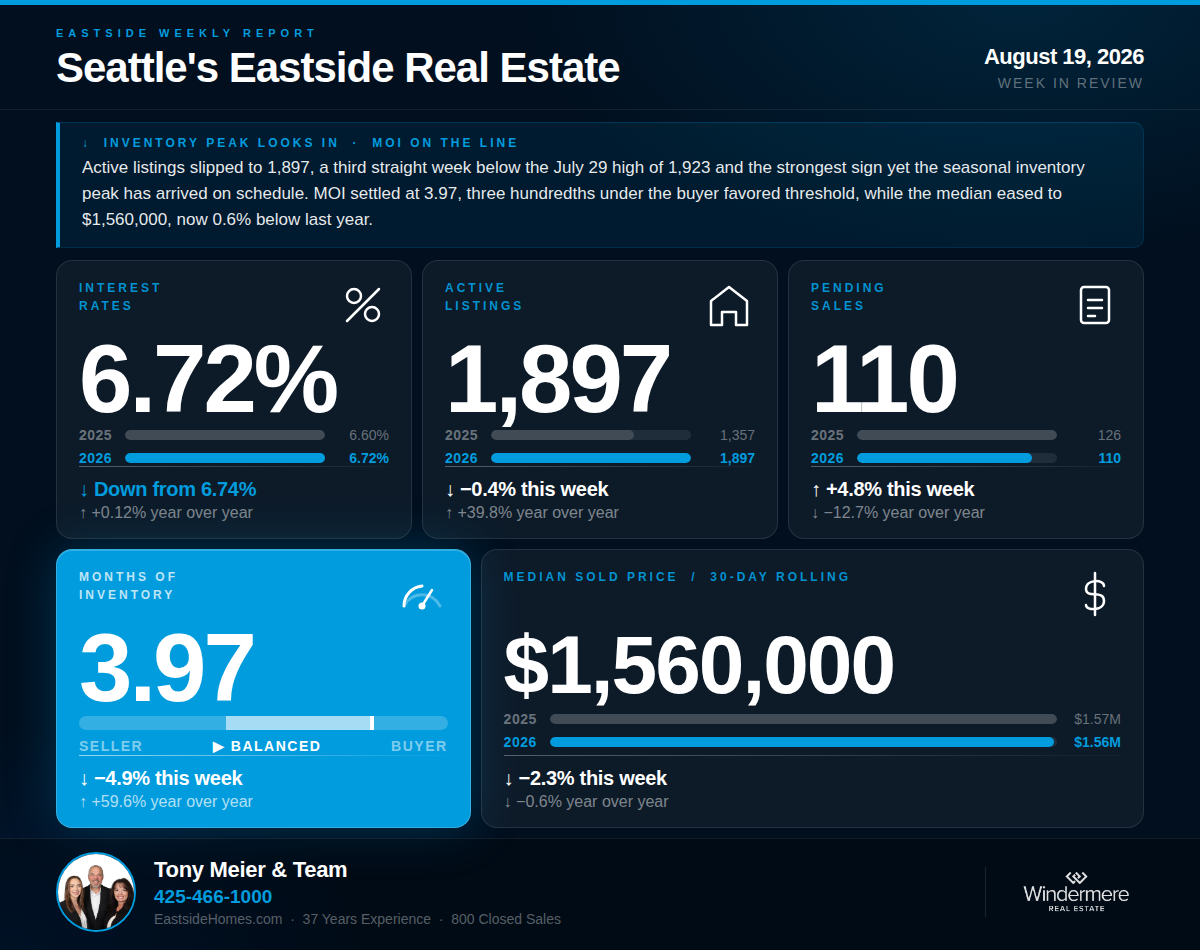
The summer is settling, and the data is starting to answer the questions we have been tracking for weeks. Active listings slipped to 1,897, the third consecutive week below the July 29 high of 1,923. The seasonal peak is looking more and more like it is in. Pending sales edged up to 110, a modest move by this summer's standards. MOI settled at 3.97, a hair below the buyer-favored threshold after crossing it last week. Rates eased for the third straight week to 6.72%. And the 30-day median pulled back to $1,560,000, slipping 0.6% below last year, consistent with the per-square-foot softness we flagged last week.
💰 Interest Rates — 6.72% | ↓ Down 2 bp from last week's 6.74% | ↑ Up 0.12% year over year
Rates eased to 6.72% this week, down 2 basis points from last week and the third consecutive weekly decline from the 6.78% high set July 29. Rates remain 0.12% above the comparable week in 2025, the fourth consecutive week above year-ago levels. The pre-conflict baseline of 5.99% sits 0.73 points below where rates are today. On a $1.5M home, this week's rate represents roughly $730 more per month in carrying costs than buyers faced in late February.
🏡 Active Listings — 1,897 | ↓ Down 0.4% from last week | ↑ Up 39.8% year over year
Active listings slipped to 1,897 this week, down 0.4% from last week's 1,905 and the third consecutive week below the July 29 reading of 1,923. Three straight weeks under the high is the strongest evidence yet that the 2026 inventory peak is in, and it landed exactly where 20 years of Eastside data said it would: late July. Year over year, inventory sits 39.8% above the 1,357 recorded during the comparable week in 2025, the widest gap of the year. That is the tension for the weeks ahead: the count is starting to ease, but from a level far above anything buyers saw last year.
📝 Pending Sales — 110 | ↑ Up 4.8% from last week | ↓ Down 12.7% year over year
Pending sales edged up to 110 this week, up 4.8% from last week's 105 and down 12.7% from the 126 recorded during the comparable week in 2025. The direction reversed again, but the move was small by this summer's standards. The trailing five-week average sits at 112, and the year-over-year gap of 12.7% is right in the 10 to 15 percent band that has defined demand since June. Buyers remain active but with more options than at any point in years, and they are using that leverage to take their time.
📦 Months of Inventory — 3.97 | ↓ Down 4.9% from last week's 4.17 | ↑ Up 59.6% year over year
MOI settled at 3.97 this week, down 4.9% from last week's 4.17 and 59.6% above the 2.49 recorded during the comparable week in 2025. That is three hundredths of a point below the buyer-favored threshold. MOI has now crossed above 4 five times this year and pulled back each time, and the market has yet to hold above 4 for two consecutive weeks. The trailing five-week average is 3.91. The picture has not changed: the Eastside is oscillating along the boundary between balanced and buyer-favored, and this week it sits right on the line.
🏠 Median Sold Price (Rolling 30-Day) — $1,560,000 | ↓ Down 2.3% from last week | ↓ Down 0.6% year over year
The 30-day median pulled back to $1,560,000 this week, down 2.3% from last week and 0.6% below the $1,570,000 recorded at this same point in 2025. Last week we showed that the median's recent gains reflected larger homes selling rather than rising values, with price per square foot down about 5% year over year. This week's dip is consistent with that read. The headline median has now swung between positive and negative year-over-year readings four times since late July, which is itself a signal that it is being driven by mix rather than a value trend. Closed sales came in at 105, down 8.7% year over year from the 115 recorded during the comparable week in 2025.
🔍 The Big Picture — What This All Means
The defining stories of the summer are beginning to resolve. The inventory peak is very likely in, with active listings down three consecutive weeks from the July 29 high, right on the historical schedule. Demand has settled into a consistent band 10 to 15 percent below last year. Rates have eased modestly for three weeks but remain above year-ago levels. MOI is sitting on the boundary between balanced and buyer-favored. And pricing, when you look past the headline median to what homes are actually trading for per square foot, is softer than a year ago. Put together, this is a market that has found its late-summer shape: more inventory than buyers have seen in years, buyers who are active but unhurried, and values that reward accurate pricing and punish optimism. The next several weeks will show whether the fall market brings any firming in demand as the inventory count continues to ease.
🏠 For Sellers
Sellers, the inventory peak appears to be behind us, and that is the first structural positive in months. Every week active listings decline from here, your competition thins. But do not mistake that for a turn in values. The median slipped below last year this week, and on a per-square-foot basis the market remains roughly 5% softer than a year ago. Buyers have 39.8% more homes to choose from than last year and pending is down 12.7%, so the ones who are active can afford to be selective. Homes priced to current comparable sales, presented well, are still selling. Homes priced to last year's numbers are the ones accumulating days on market.
We have done extensive analysis on what this shift means for sellers in each Eastside sub-market and would welcome the opportunity to walk you through what the data shows for your specific area and home.
🔑 For Buyers
Buyers, the leverage remains yours, but the selection window has very likely started to close. Active listings have declined three straight weeks from the July 29 high, and the historical pattern says the count keeps easing through fall and winter. Selection is still near its 2026 high, so this is not a reason to rush, but it is a reason to move from browsing to deciding if you have been waiting for maximum choice. Rates at 6.72% have eased slightly for three weeks, pending at 110 means limited competition on most properties, and values on a per-square-foot basis remain below last year. Confirm your qualification at current rates and be ready to act when the right home appears.
If we can help you think through what this means for your move, we are here.
Tony Meier & Team — Windermere Real Estate / NE, Kirkland, WA