Audio Version
Tony Meier | Windermere Real Estate | 37 Years Experience | 800 Closed Eastside Sales
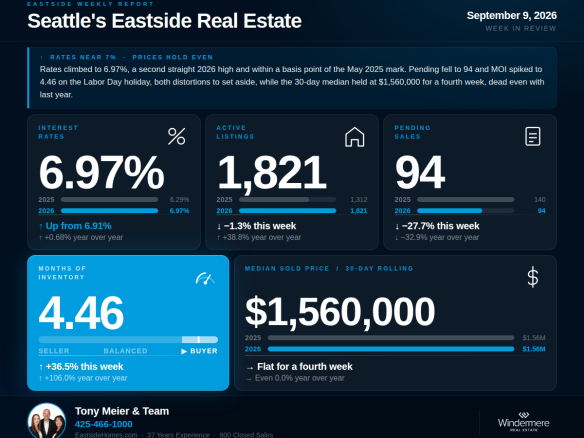
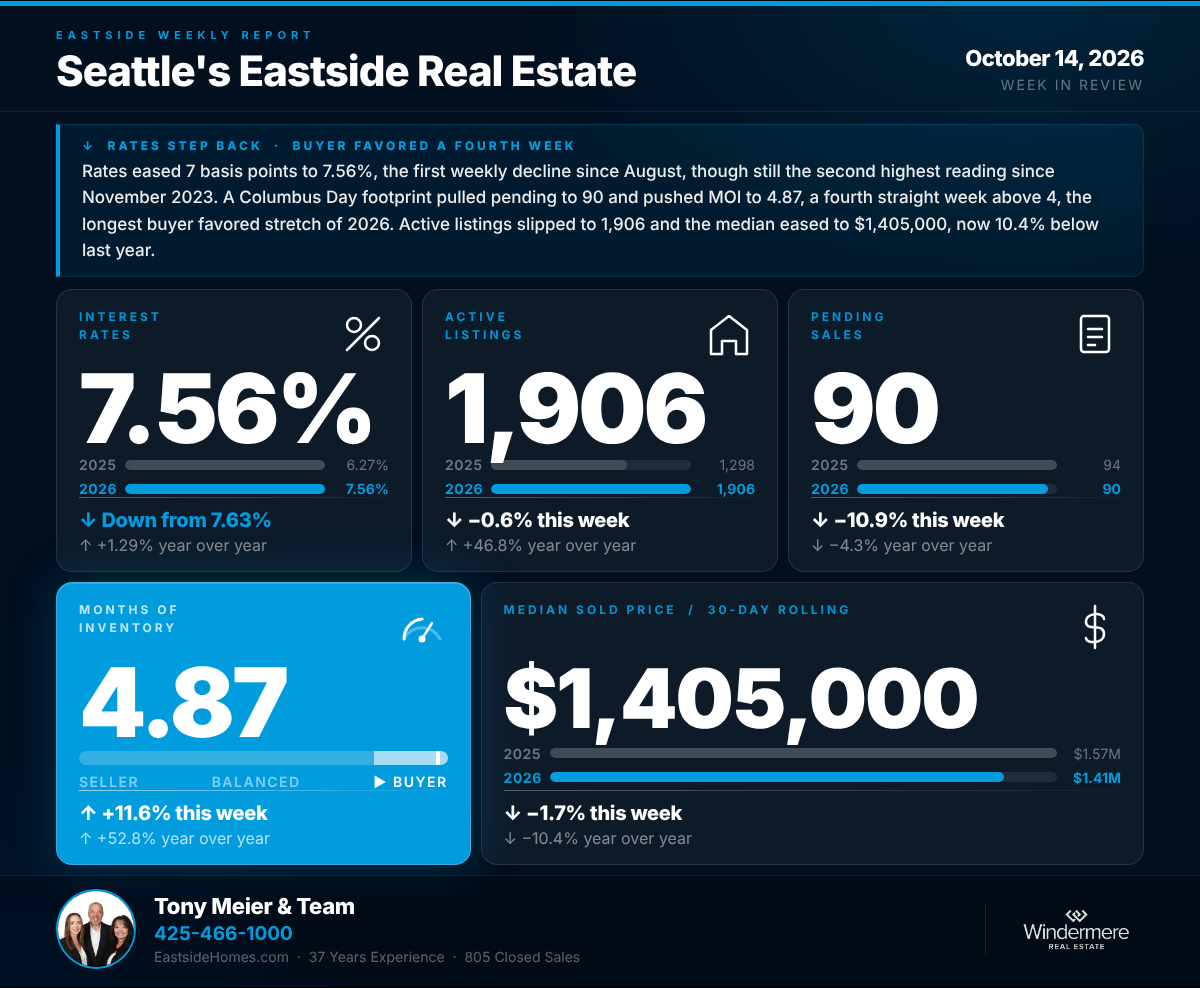
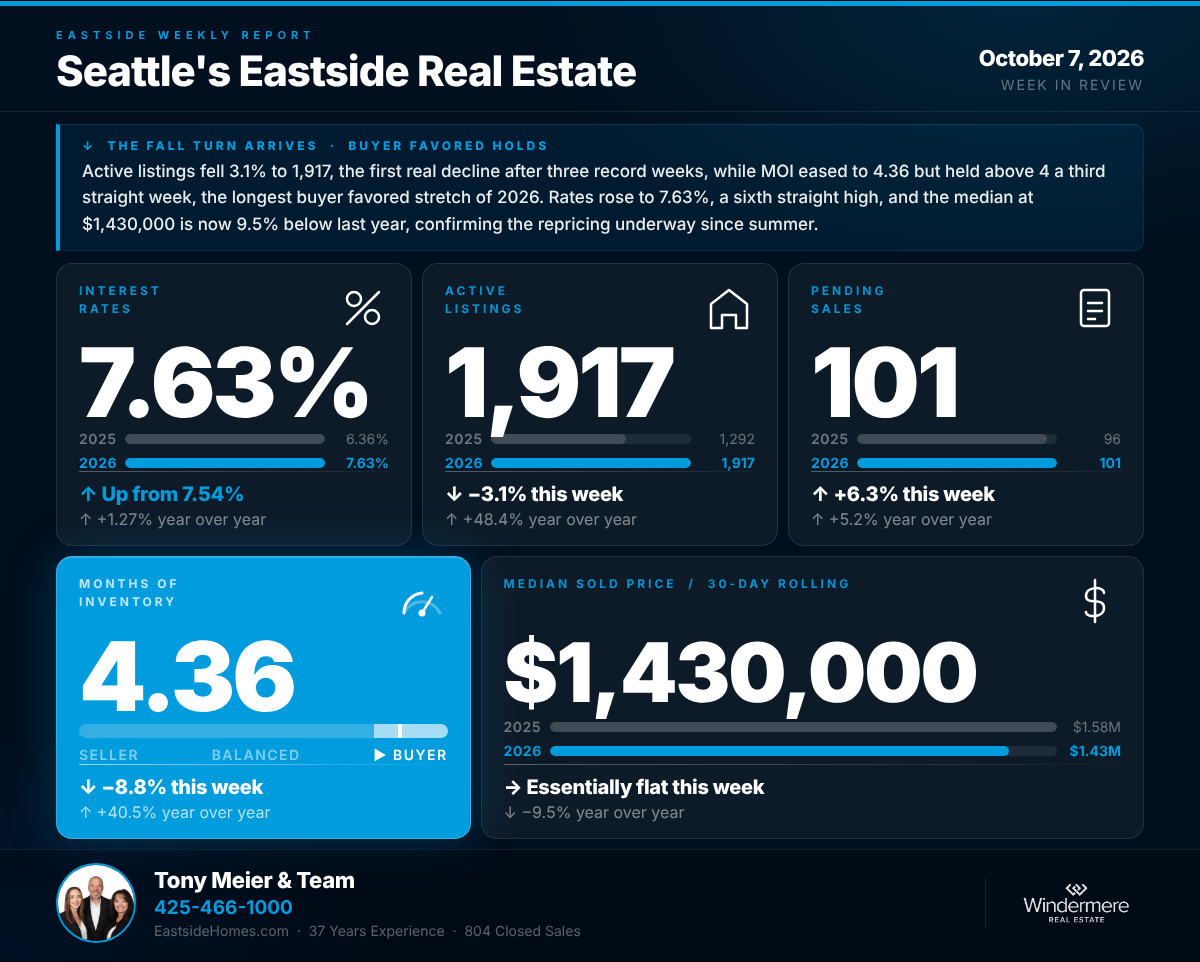
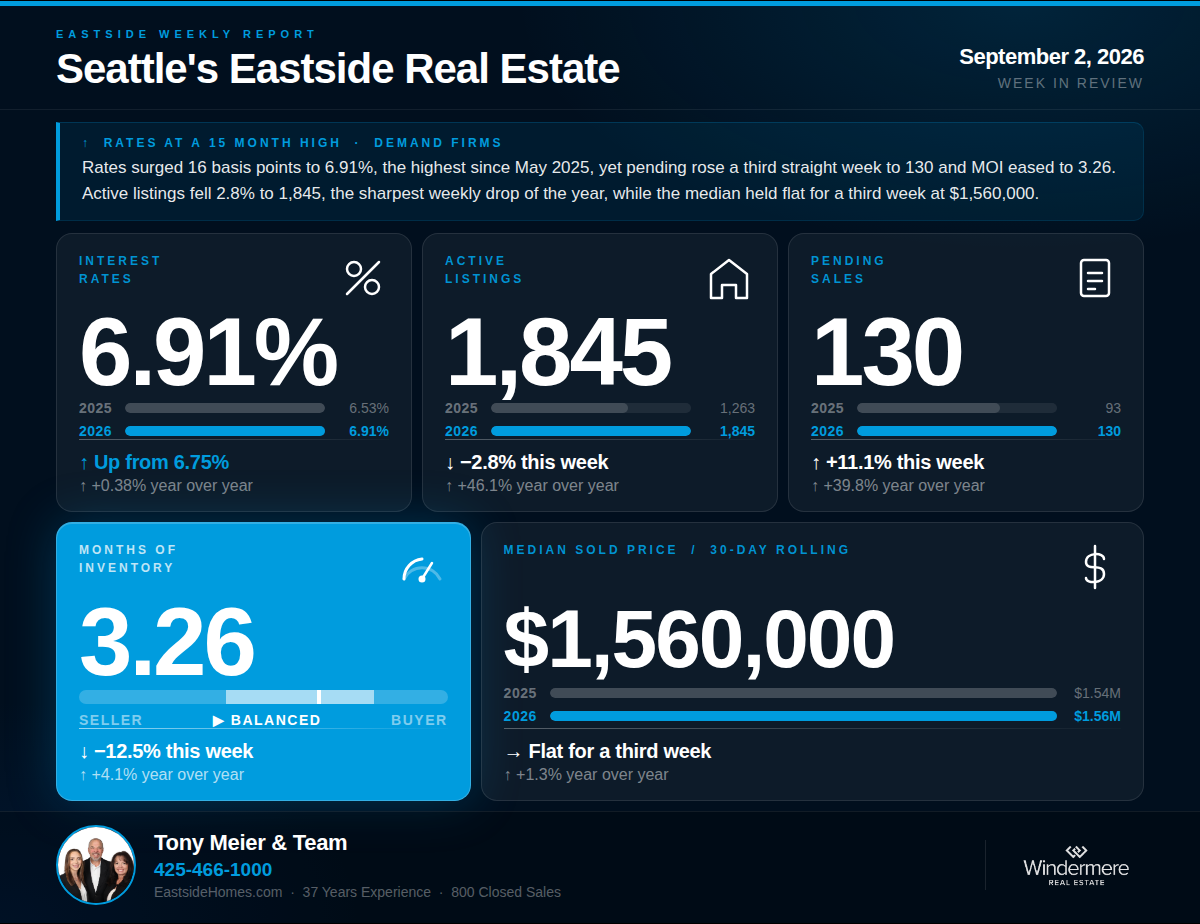
This week hands us the sharpest contrast of the year: the highest mortgage rates in fifteen months arriving in the same breath as the firmest demand streak of the summer. Rates surged 16 basis points to 6.91%, clearing the July 2025 mark we have been citing all summer and reaching territory last seen in May 2025. Buyers did not blink. Pending sales rose a third consecutive week to 130. Active listings fell 2.8% to 1,845, the sharpest weekly decline of the year and the fifth week below the July 29 peak. MOI dropped a third straight week to 3.26, its lowest reading since July 1. Prices held flat for a third week. One flag before next week: Labor Day lands September 7, so expect a holiday-suppressed reading in the next update.
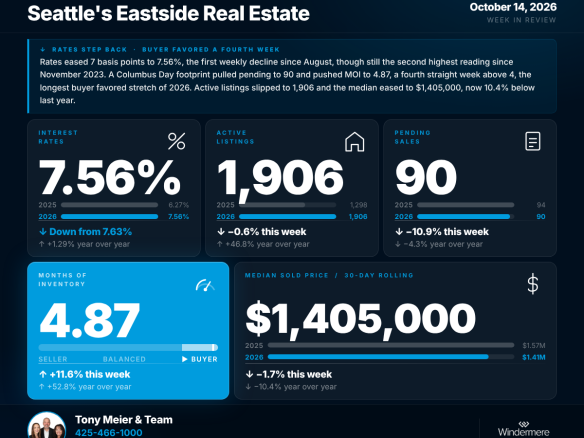
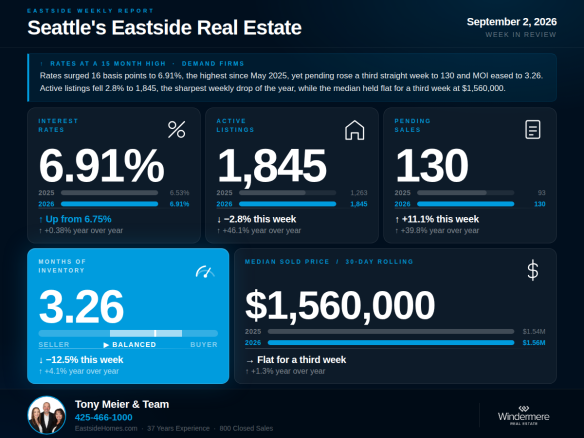
💰 Interest Rates — 6.91% | ↑ Up 16 bp from last week's 6.75% | ↑ Up 0.38% year over year
Rates surged to 6.91% this week, up 16 basis points from last week, a new 2026 high by a wide margin. This clears the 6.81% from late July 2025 that stood as the recent ceiling, and it is the highest weekly reading since May 2025, fifteen months ago. Rates are now 0.38% above the comparable week in 2025 and 0.92 points above the pre-conflict baseline of 5.99%. On a $1.5M home, this week's rate represents roughly $920 more per month in carrying costs than buyers faced in late February. A move this size would normally be the whole story. This week it has competition.
🏡 Active Listings — 1,845 | ↓ Down 2.8% from last week | ↑ Up 46.1% year over year
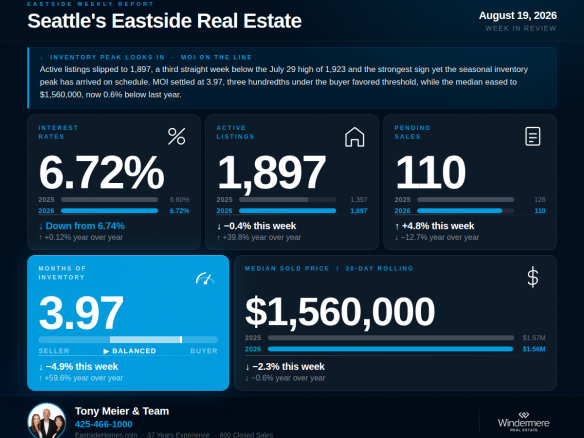
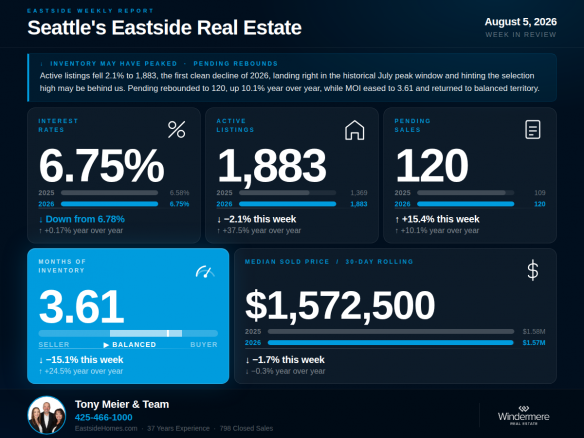
Active listings fell to 1,845 this week, down 2.8% from last week's 1,898, the sharpest weekly decline of 2026 and the fifth consecutive week below the July 29 high of 1,923. The seasonal slide is no longer a forecast; it is underway. The year-over-year gap reads 46.1%, the widest of the year, but as we explained last week, that reflects how quickly last year's count was falling at this point rather than growth in this year's. Selection remains historically wide and is now shrinking on schedule.
📝 Pending Sales — 130 | ↑ Up 11.1% from last week | ↑ Up 39.8% year over year
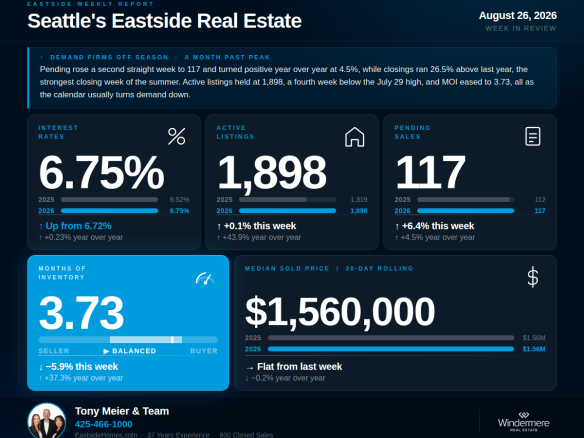
Pending sales rose to 130 this week, up 11.1% from last week's 117, the third consecutive weekly increase: 110, 117, 130. The year-over-year comparison of positive 39.8% needs an honest footnote: Labor Day fell on September 1 last year, so the 2025 comparable week was holiday-suppressed at 93, which flatters this week's gap. The week-over-week trend carries no such distortion, and three straight gains into the highest rates in fifteen months is a genuine signal of demand firmness. Closed sales reinforce it: 129 this week, up 10.3% from the 117 recorded during the comparable week in 2025, a second consecutive positive closing comparison.
📦 Months of Inventory — 3.26 | ↓ Down 12.5% from last week's 3.73 | ↑ Up 4.1% year over year
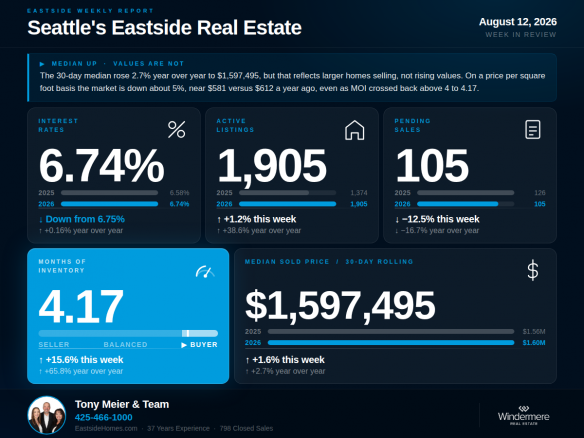
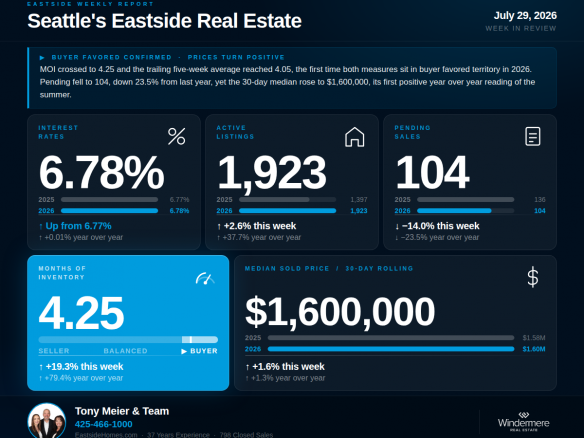
MOI dropped to 3.26 this week, down 12.5% from last week's 3.73 and just 4.1% above the 3.13 recorded during the comparable week in 2025. This is the third consecutive weekly decline and the lowest reading since July 1. The trailing five-week average sits at 3.75. Note how the year-over-year gap has collapsed: from 79% in late July to 4% today, as last year's fall softening meets this year's firming. The market has moved from testing the buyer-favored line to sitting in the middle of upper balanced territory in three weeks.
🏠 Median Sold Price (Rolling 30-Day) — $1,560,000 | → Flat for a third week | ↑ Up 1.3% year over year
The 30-day median held at $1,560,000 for a third consecutive week, up 1.3% from the $1,540,000 recorded at this same point in 2025. Three identical weekly readings while the mix of homes shifts week to week is the picture of a stable price floor. As we detailed in mid-August, per-square-foot values continue to run softer than the headline, so flat remains the honest description, but flat through the highest rate week in fifteen months is its own kind of statement.
🔍 The Big Picture — What This All Means
Step back and the shape of early fall is forming. Selection peaked five weeks ago and is now declining at the fastest pace of the year. Demand has risen three consecutive weeks into the sharpest rate spike of 2026. MOI has fallen from 4.25 to 3.26 in four weeks, and its year-over-year gap has nearly closed. Prices have not moved in three weeks. The buyers transacting today are doing so with full knowledge of 6.91% financing, which says the remaining buyer pool is qualified, committed, and less rate-sensitive than the buyers who stepped back in spring. The unknowns ahead: whether the rate surge cools demand with the several-week lag we saw in July, and how the market reads through next week's Labor Day distortion. The clean September data arrives mid-month, and it will show whether this firming survives its first real stress test.
🏠 For Sellers
Sellers, the environment continues tilting your way. Your competition is now shrinking at the fastest pace of the year, demand has risen three straight weeks, and MOI has moved from the buyer-favored line to mid-balanced territory in under a month. The rate surge is the risk to watch: at 6.91%, affordability math tightens for every buyer, and the July pattern showed rate spikes hitting demand with a lag. If you are planning a fall listing, the historically strong Labor-Day-to-mid-October window opens now, and this year it opens with momentum. Price to current per-square-foot comparables, present well, and meet the qualified buyers who are clearly still active.
We have done extensive analysis on what this shift means for sellers in each Eastside sub-market and would welcome the opportunity to walk you through what the data shows for your specific area and home.
🔑 For Buyers
Buyers, the math changed this week. At 6.91%, carrying costs on a typical purchase rose meaningfully, and stress-testing your qualification at current rates is now the first conversation to have, not the last. The selection story compounds the urgency: inventory is falling at the fastest pace of the year, and the historical pattern says it shrinks through winter. What has not changed is that prices are flat, per-square-foot values sit below last year, and most listings still face limited competition. If rates matter to your plans, ask your lender about buydowns and adjustable products, because the spread between a 6.91% headline rate and a well-structured loan is real money. The window is still open. It is just no longer widening.
If we can help you think through what this means for your move, we are here.
Tony Meier & Team — Windermere Real Estate / NE, Kirkland, WA