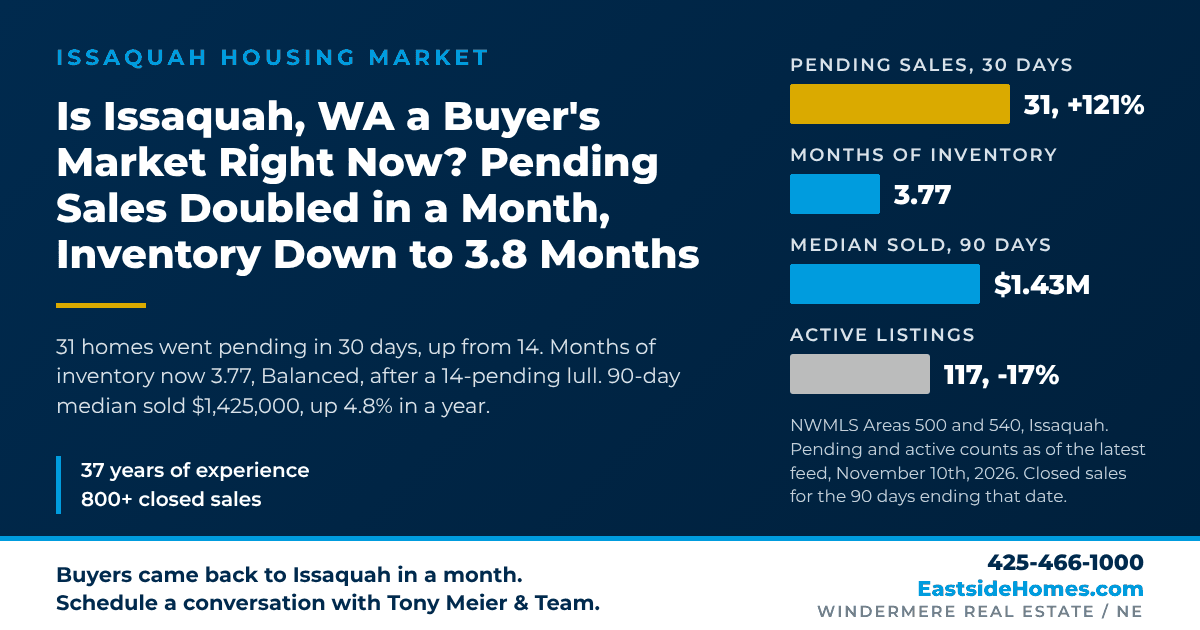
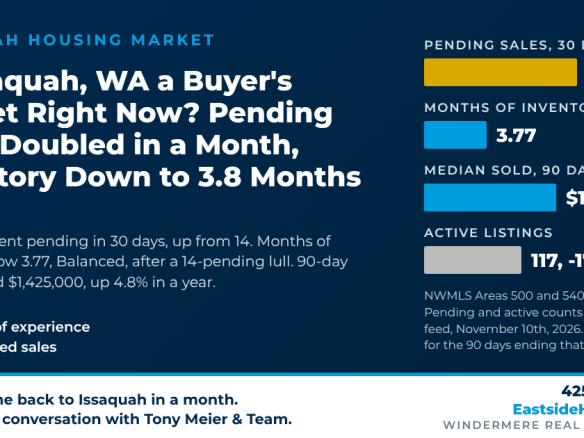
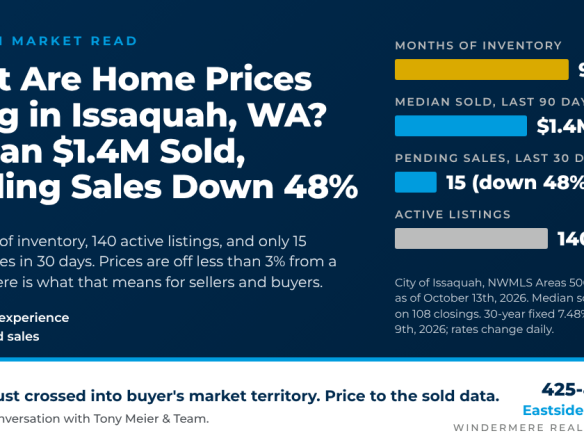
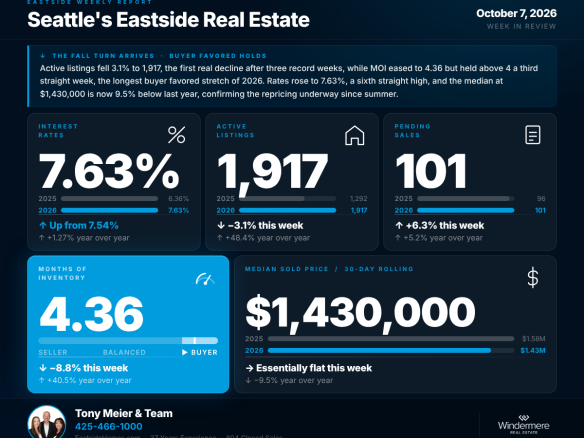
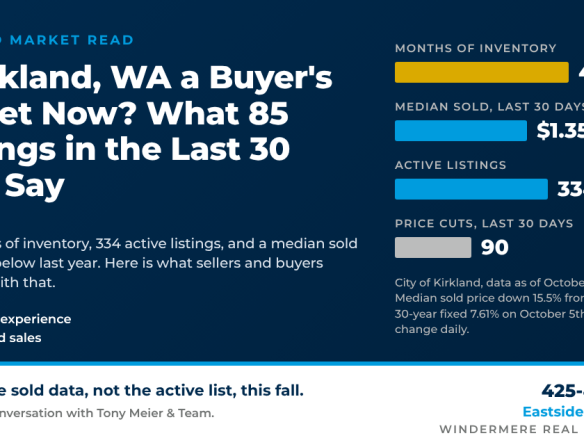
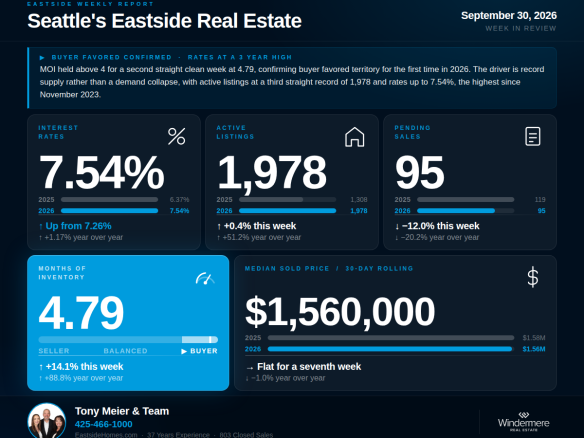
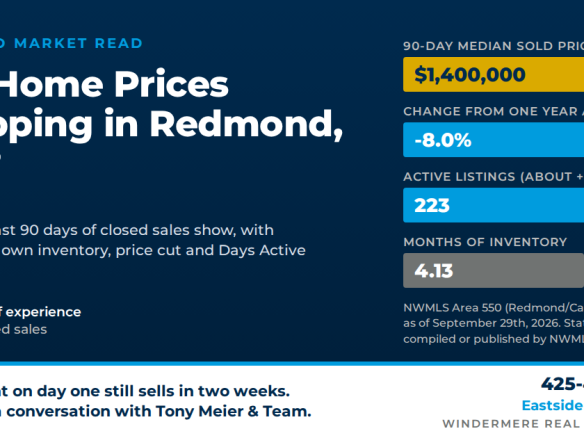
Not by our measure, not anymore. Issaquah, WA sits at 3.77 months of inventory as of November 10th, 2026, which is Balanced on our scale (0 to 2 months Seller's, 2 to 4 Balanced, 4 and up Buyer's). A month ago, when only 14 Issaquah homes had gone pending in 30 days, the same measure read as a Buyer's Market. What changed is demand: 31 Issaquah homes went pending in the last 30 days, up from 14 the month before, a 121% jump, while active listings fell 17% to 117. Issaquah is the only one of the Eastside's six largest cities not in Buyer's Market territory right now; the Eastside as a whole is at 5.08 months. Homes that closed in the last 90 days sold at a median $1,425,000, up 4.8% from a year ago. Data from Eastside Market Watch, Tony Meier & Team's daily database of every NWMLS listing on the Eastside, for Issaquah listings in NWMLS Areas 500 (South of I-90) and 540 (East of Lake Sammamish).
What Flipped in Issaquah in Four Weeks
On October 13th, 2026 we wrote that Issaquah pending sales had fallen 48% in a month and inventory had stretched well into Buyer's Market territory. Four weeks later the picture has reversed. The last three 30-day pending windows ran 25, 15, then 31, and our momentum model now reads Issaquah as Accelerating. A year ago the same window had 28, so this is more than a rebound from a weak October.
| Demand (Issaquah) |
Now |
1 month ago |
1 year ago |
| Pending sales, last 30 days |
31 |
14 |
28 |
| Months of inventory |
3.77 (Balanced) |
Buyer's (on 14 pendings) |
2.64 (Balanced) |
| Active listings |
117 |
141 |
about 74 |
| New listings, last 30 days |
41 |
59 |
36 |
| 30-year fixed rate (MND) |
7.18% |
7.48% |
6.205% |
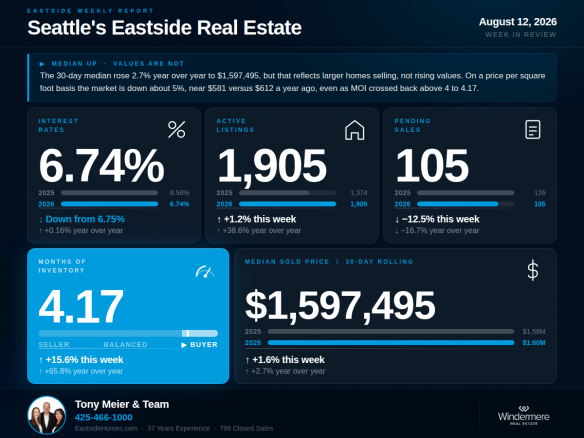
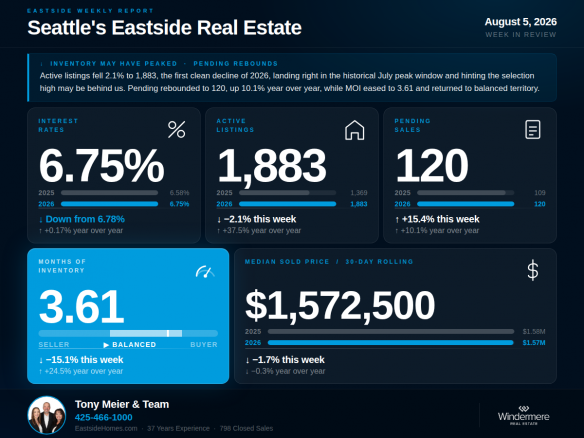
Rates eased from 7.48% to 7.18% over the month (Mortgage News Daily, November 9th, 2026; rates change daily) while new listings slowed from 59 to 41, so returning buyers met a smaller set of homes.
What Issaquah Homes Are Selling For
Issaquah had 19 closings in the last 30 days, a small sample, so the monthly median of $1,500,000 says more about which homes closed than about values. Price from the 90-day figures below. CDA is Cumulative Days Active (formerly CDOM), the NWMLS count of days on the market before a home went under contract.
| Closed sales (Issaquah) |
Now |
1 month ago |
1 year ago |
| Median sold price, last 90 days |
$1,425,000 |
$1,420,000 |
$1,360,000 |
| Median sold price, last 30 days |
$1,500,000 |
$1,300,000 |
$1,325,705 |
| Closings, last 90 days |
87 |
106 |
101 |
| Sold price as % of list, last 90 days |
98.84% |
98.51% |
98.82% |
| Sold over list price, last 90 days |
18.4% |
17.9% |
16.8% |
| Median CDA, last 90 days |
17 days |
13.5 days |
21 days |
The 90-day median of $1,425,000 is up 4.8% from a year ago while the Eastside median is down 9.3%, so Issaquah has held value better than almost any city we track. Nearly one closing in five sold over list, the highest share on the Eastside this week alongside Woodinville, and the typical home went under contract in 17 days.
How Issaquah Is Repricing
Read this table before you set a list price. Active list prices are as of the latest feed and provisional until re-verified against live MLS data; the one-year active count is reconstructed, so read it as about 74.
| Active market (Issaquah) |
Now |
1-month change |
1-year change |
| Active listings |
117 |
-17.0% |
+58.1% (from about 74) |
| Price reductions, last 30 days |
28 (24% of actives) |
34 a month ago |
not tracked a year ago |
| Median list price |
$1,399,999 |
+3.7% |
+5.7% |
| Median list price per sq ft |
$542 |
-1.8% |
-4.2% |
| Median CDA, last 90 days of closings |
17 days |
+3.5 days |
-4 days |
Asking prices are not falling in Issaquah. The median list price is up 3.7% in a month and 5.7% from a year ago, even as list price per square foot slipped, so larger homes make up more of what is on the market. About one active in four took a price cut in the last 30 days. The soft spot is the newest closings: the 19 homes that closed in the last 30 days took a median 32 days to go under contract against 8 days a month earlier. Most of the homes that launched above the comps in September needed a reduction before they sold.
Here's What I Suggest
If you are selling in Issaquah: this is the strongest seller window on the Eastside right now, and it may be narrow. Buyers are active, inventory is 17% lower than a month ago, and homes priced on the closed comps are going under contract in about two and a half weeks. Price from the 87 closed sales, not the 117 asking prices around you. Launch on a Wednesday, hold one concentrated Saturday open house, and make the first weekend count.
If you are buying in Issaquah: the leverage you had in October is fading. A month ago, with barely a dozen homes going pending in a month, you could wait; today a well-priced home may have other buyers on it within two weeks. Negotiate on homes past 30 days of CDA and move quickly on fresh listings priced right. Related reads:
What Are Home Prices Doing in Issaquah, WA? (our October 13th read, for the before picture),
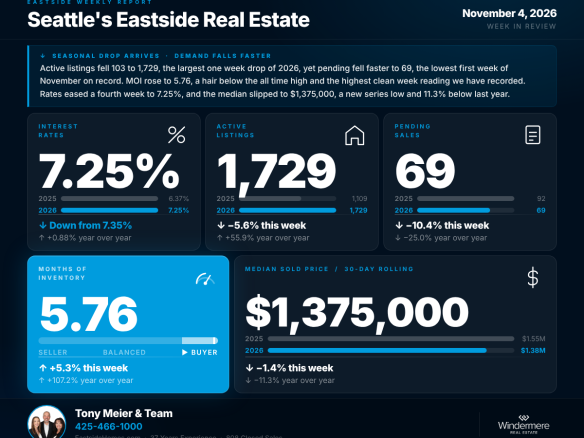
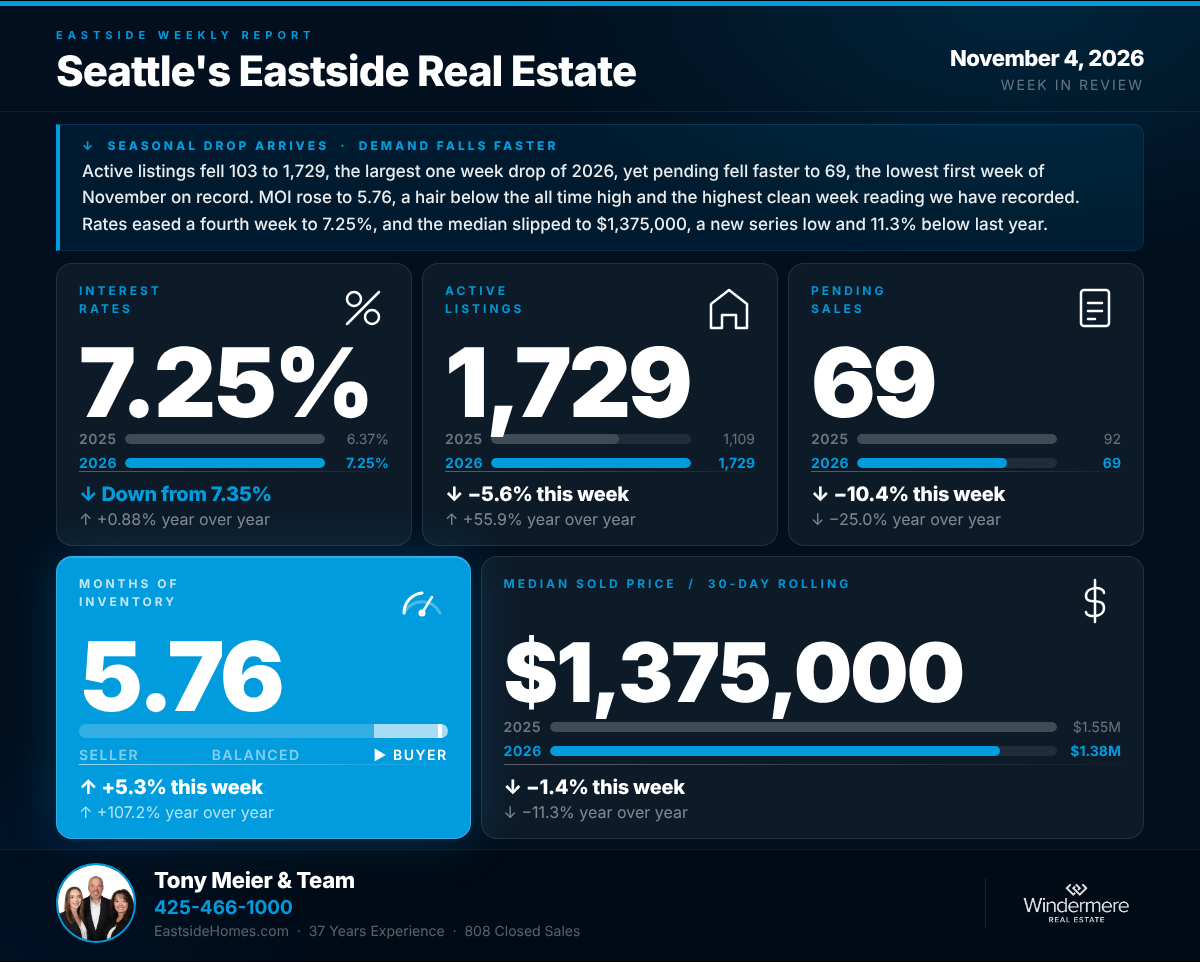
Seattle's Eastside Real Estate Update 11-04-26, and
Selling a House in Sammamish, WA?.
Want to know what these numbers mean for your Issaquah home or your search? Call or text Tony Meier & Team at 425-466-1000 or visit EastsideHomes.com. With 37 years of experience, 808 closed residential sales, and $259M+ in closed volume across 208 transactions since 2020, we can show you exactly where your home sits against the last 90 days of closings.
Frequently Asked Questions
Is Issaquah, WA a buyer's market right now?
Not on our scale as of November 10th, 2026. Issaquah has 3.77 months of inventory, which is Balanced, after a Buyer's Market reading a month ago when only 14 homes went pending in 30 days. The Eastside as a whole is at 5.08 months and still a Buyer's Market.
What is the average home price in Issaquah, WA?
The median closed price over the last 90 days is $1,425,000, up 4.8% from a year ago. The median asking price on the 117 active listings is $1,399,999 as of the latest feed.
How long does it take to sell a house in Issaquah?
The median CDA for homes that closed in the last 90 days is 17 days. The 19 that closed in the last 30 days took a median 32 days, because many launched in the slow September stretch and reduced before selling.
Data as of November 10th, 2026, from Eastside Market Watch (Tony Meier & Team) for Issaquah listings in NWMLS Areas 500 (South of I-90) and 540 (East of Lake Sammamish). One-month comparisons are to October 10th, 2026, and one-year comparisons to November 10th, 2025. Active list prices are as of the latest feed and are provisional until verified against live MLS data; the one-year active count is reconstructed. Months of inventory is (Active + Contingent + First Look) divided by the trailing 30-day pending pace. The 30-year fixed rate of 7.18% is the Mortgage News Daily reading for November 9th, 2026; rates change daily. Source: NWMLS listing data, compiled and analyzed by Tony Meier & Team through Eastside Market Watch. Statistics not compiled or published by Northwest Multiple Listing Service.
Tony Meier & Team | Windermere Real Estate / NE | Kirkland, WA | 425-466-1000 | EastsideHomes.com | 220 closed sales serving the English Hill Area, English Hill resident since 2001